The Economics of Extreme Heat
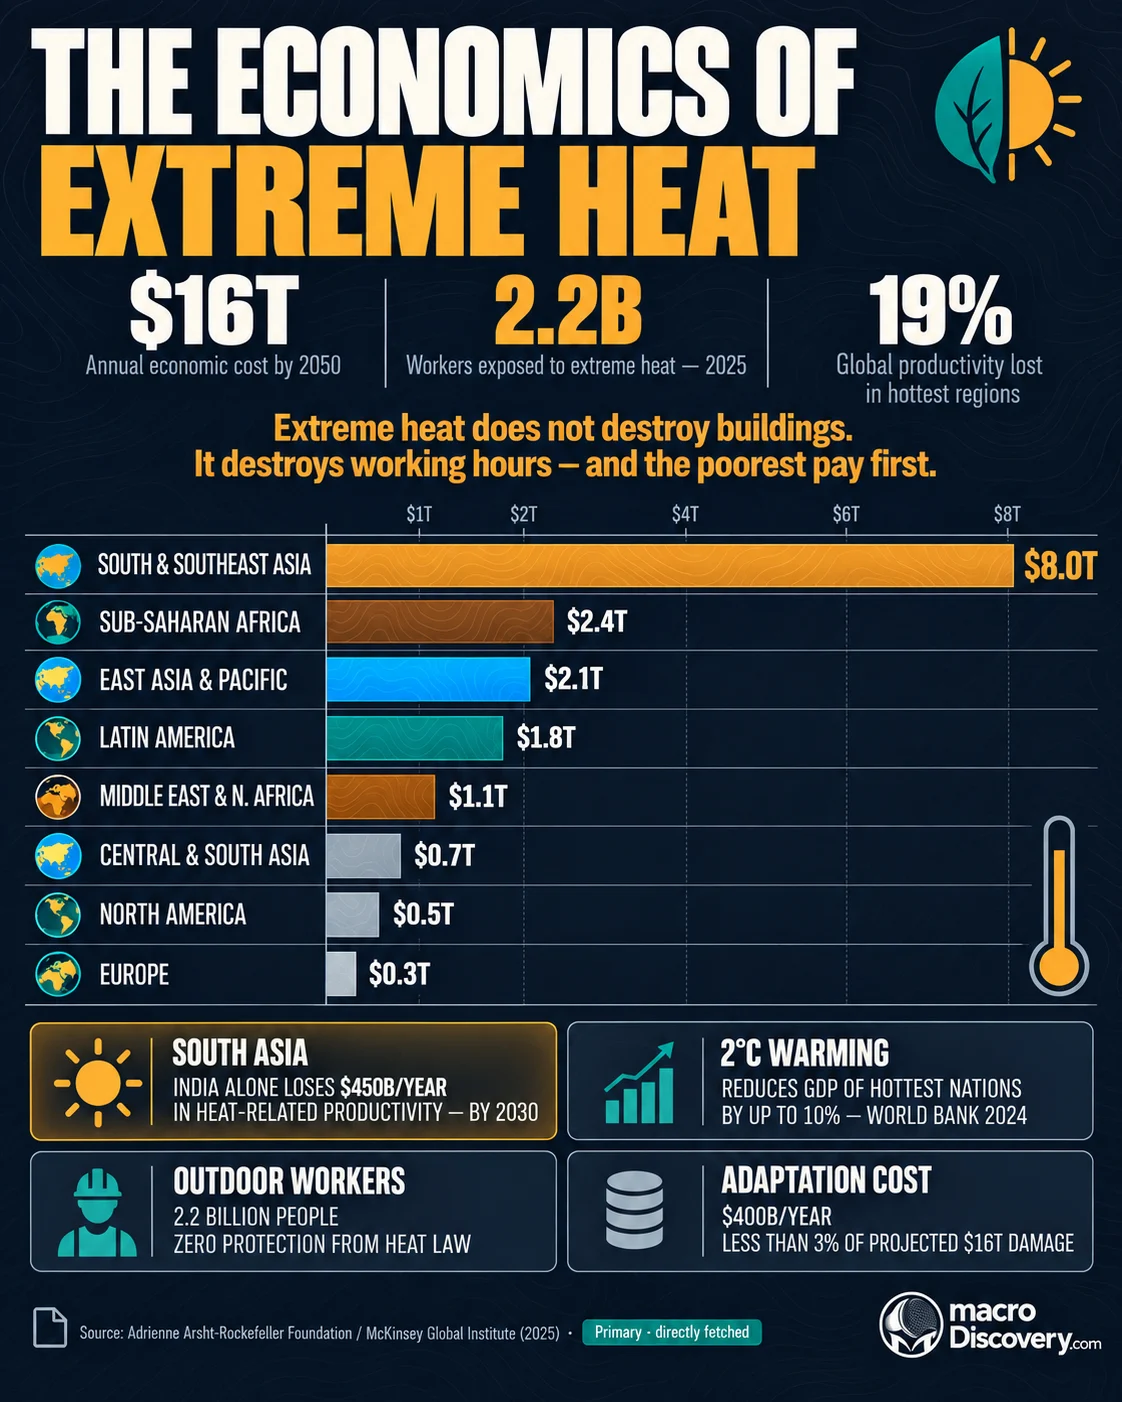
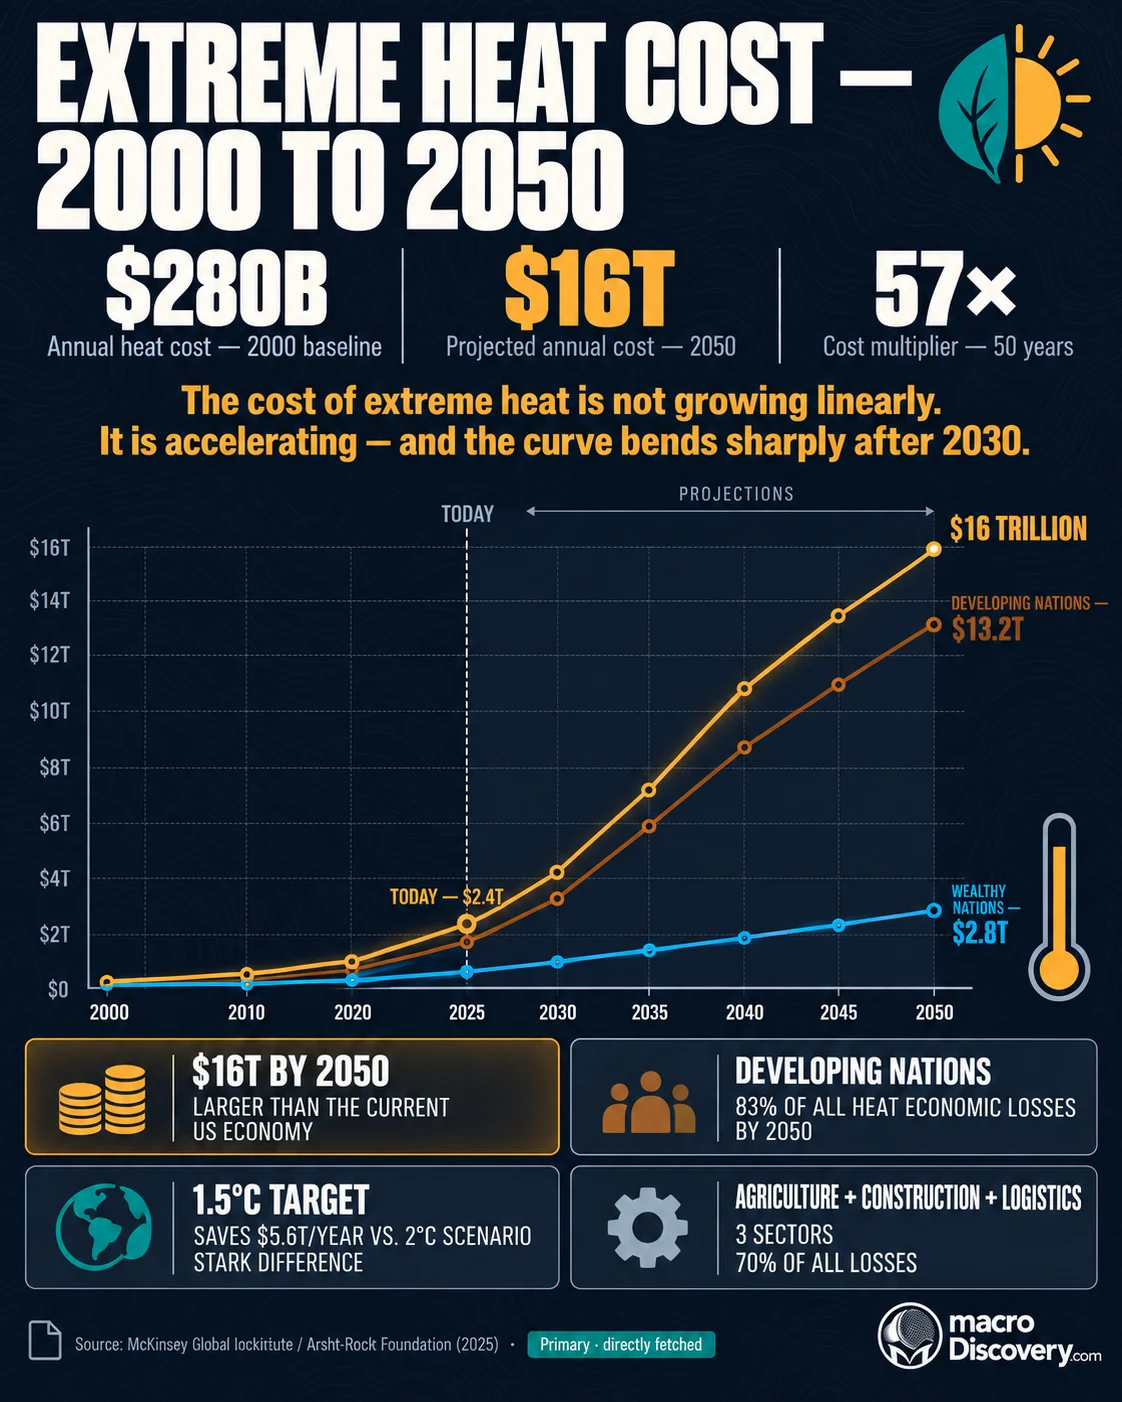
By 2050 extreme heat will cost the world $16 trillion a year in lost work.
That line is not an ILO or Lancet forecast. The $16 trillion figure is the low end of a 1992–2013 cumulative range, not a yearly bill.
Three numbers
- $2.4 trillion — global productivity loss the ILO projects for 2030, equal to 2.2% of working hours. Source: ILO.
- 512 billion — potential work hours lost to heat exposure in 2023. Source: Lancet Countdown.
- $16–50 trillion — likely cumulative losses from human-caused extreme heat, 1992–2013. Not an annual figure. Source: Science Advances.
What the data shows
A common claim is that extreme heat will cost the world $16 trillion a year in lost work by 2050. The fact is that figure is not an annual forecast. Callahan and Mankin, in Science Advances in 2022, put cumulative losses from human-caused extreme heat between 1992 and 2013 in a likely range of $16 trillion to $50 trillion. The central estimate was more than $33 trillion over those 22 years. The total covers health, productivity, and farm output. It is not a 2050 payroll.
The ILO’s labour count is smaller, and it is dated. Under a path to 1.5°C by the end of the century, and assuming work in the shade, the ILO projects that 2.2% of working hours will be lost in 2030. That is about 80 million full-time jobs, and $2.4 trillion. In the sun, the hour loss rises to 3.8%. Agriculture is projected to account for 60% of lost hours. Construction accounts for 19%. Southern Asia and western Africa each lose about 5% of working hours, about 43 million and 9 million jobs.
Lancet Countdown counted the loss already on the books. In 2023, heat exposure cost 512 billion potential work hours and $835 billion of potential income. About two-thirds of the hours were in agriculture. Low-HDI countries lost the equivalent of 7.6% of GDP. Very high-HDI countries lost about 1%. A 2021 Nature Communications paper on heavy labour put annual losses at about $1.6 trillion in a 2°C world. That is a labour model, not a 2050 bill, and it is not $16 trillion.
Bars are share of working hours, not dollars. The $16 trillion claim is a cumulative total and is not on this scale.
| Count | Figure | What it is |
|---|---|---|
| ILO productivity loss | $2.4 trillion | 2030, 1.5°C path, shade |
| ILO working hours | 2.2% (3.8% in sun) | 2030 projection |
| Lancet potential hours | 512 billion | 2023 |
| Lancet potential income | $835 billion | 2023 |
| Callahan and Mankin | $16–50 trillion | Cumulative, 1992–2013 |
How it was measured
The ILO uses temperature, humidity, and the pace of work. A hotter hour cuts the safe work rate. The dollar figure prices those lost hours. It is not a count of wages that failed to clear a bank. The shade assumption makes the 2.2% figure a lower case. The sun case is 3.8%.
Lancet uses the same idea of potential hours, then prices them. A country can lose a large share of farm hours and a small share of office hours. Callahan and Mankin link the hottest five days of each year to regional GDP per person, then attribute the human-caused share. Their $16 trillion is the low end of a likely cumulative range, not a yearly run rate.
What it means
It is settled that heat already cuts outdoor work, and that the ILO’s 2030 figure is $2.4 trillion under a 1.5°C path. It is not settled that the world loses $16 trillion a year by 2050. Use $2.4 trillion for 2030. Use $835 billion for 2023. Use $16–50 trillion only as a 1992–2013 cumulative range.
Common misreadings
- $16 trillion is not a 2050 annual bill. It is the low end of a 22-year total.
- Lost hours are not a shutdown. Most are in agriculture and construction.
- The shade case is not the sun case. The ILO’s own sun case is 3.8%, not 2.2%.
Where the numbers come from
How we built this
- Dataset: ILO 2019 heat-stress projections; Lancet Countdown 2024 labour indicator; Callahan and Mankin 2022; Parsons and others 2021.
- Scope: Lost work and the viral $16 trillion line. Deaths, crop yields, and insurance losses are out of the main count.
- Figures: Dollar figures kept in the unit each source published. Cumulative totals are not divided into a fake annual bill.