The Longevity Divide
The rich are living longer. The poor are dying younger. The gap has never been wider.
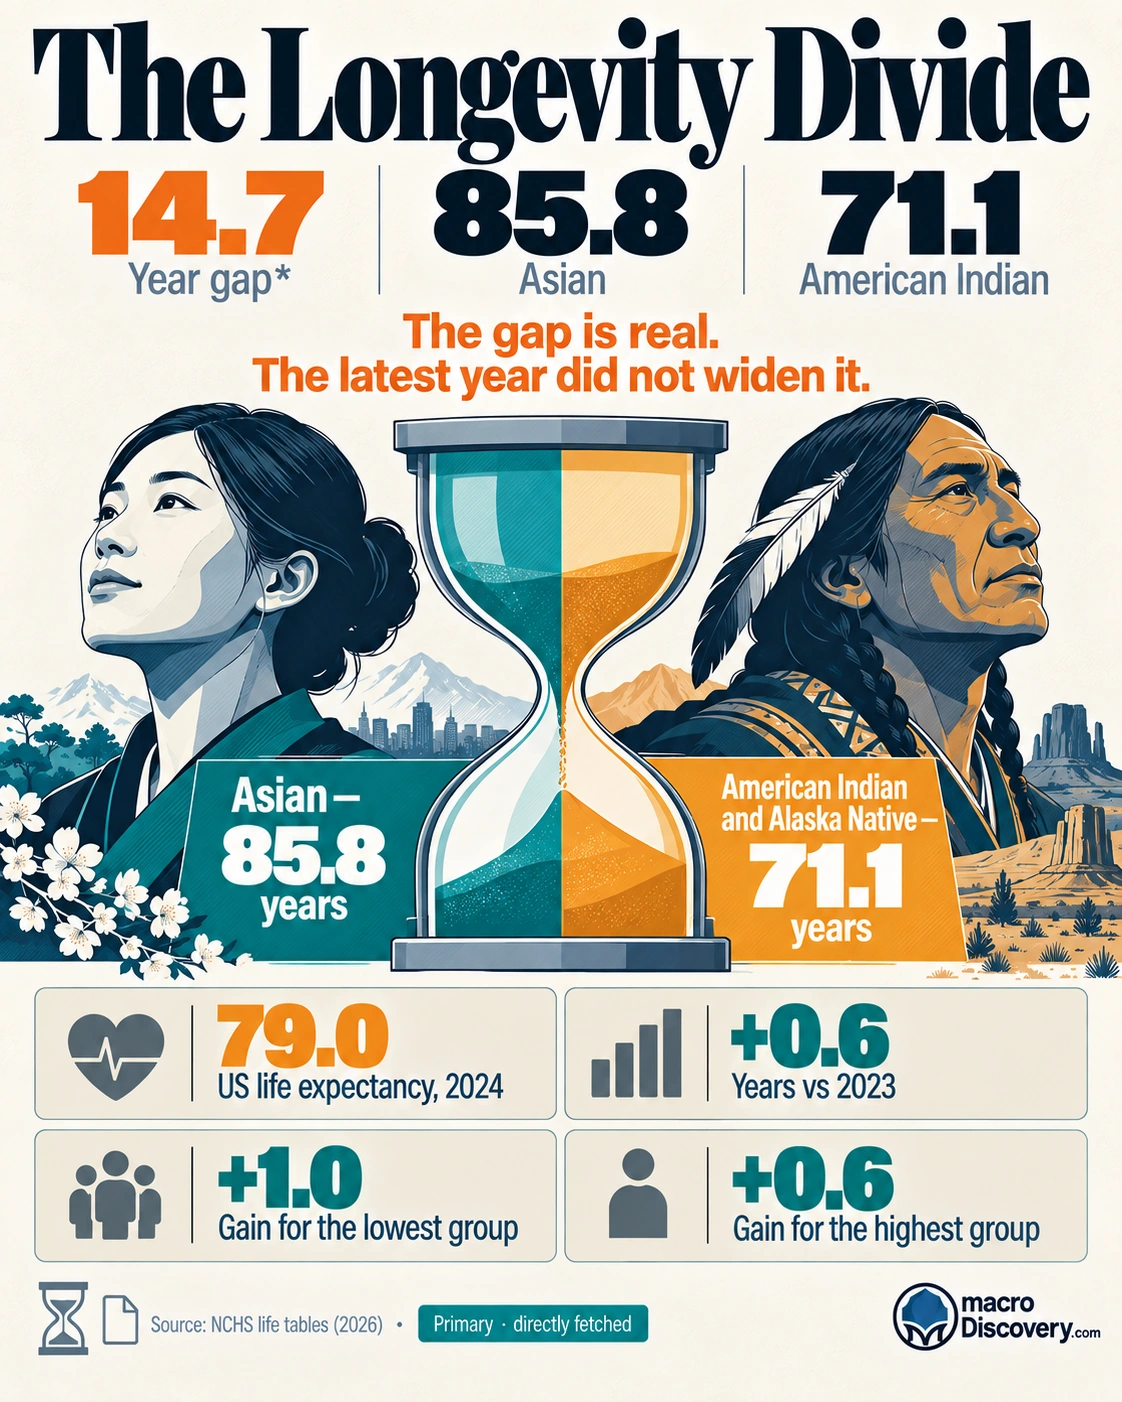
The poor are not dying younger in the latest counts. US life expectancy rose to 79.0. Wealth still predicts death, and the US gap is wider than Europe’s.
Three numbers
- 79.0 years — US life expectancy at birth in 2024, up from 78.4 in 2023. Source: CDC.
- 0.60 — adjusted death hazard for the top wealth quartile against the bottom, in older US and European adults. Source: NEJM, 2025.
- 64 and 76 — men’s life expectancy in the least developed countries and in more developed countries, 2024. Source: UN-based country averages.
What the data shows
A common claim is that the rich are living longer, the poor are dying younger, and the gap has never been wider. The fact is that the latest national count went up, and “never wider” is not a measured series. US life expectancy at birth was 79.0 years in 2024, up 0.6 year from 78.4 in 2023. Men rose from 75.8 to 76.5. Women rose from 81.1 to 81.4. The gain showed up in every large race and origin group the CDC tables. A year in which the average rose is not a year in which the poor died younger than the year before.
Wealth still sorts who dies. A New England Journal of Medicine study published in 2025 followed older adults in the United States and 16 European countries from 2010 to 2022. Against the bottom wealth quartile, the adjusted death hazard was 0.80 in the second quartile, 0.68 in the third, and 0.60 in the top. The survival gap between top and bottom was wider in the United States than in Europe. Survival in the richest US quartile looked similar to the poorest quartile in northern and western Europe. That is a gap in the level of risk. It is not a finding that poor Americans are dying younger than they used to.
The country gap is also a level, not a new collapse. In 2024, men in more developed countries had a life expectancy of about 76, and men in the least developed countries about 64. Women were about 82 and 69. Both ends are far above the mid-twentieth century, when many poor countries sat near 40. A 12-year gap can persist while both sides rise. “Dying younger” needs a fall against a past year. The 2024 US table does not show one. “Never wider” needs a long income series. The studies here do not supply it.
The US figure, 79.0, is a national average. It is not a rich-poor split.
| Count | Figure | What it is |
|---|---|---|
| US life expectancy, 2024 | 79.0 | Up 0.6 year from 2023 |
| US men, 2024 | 76.5 | Up from 75.8 |
| Top vs bottom wealth | 0.60 hazard | Older adults, US and Europe |
| Men, least developed | about 64 | 2024. More developed about 76 |
| Never wider | not measured | No income series in these sources |
How it was measured
The CDC figure is a period life table. It asks how long a newborn would live if 2024 death rates lasted a lifetime. It is not a count of how long people now alive will live, and it is not split by income. A rise in the average can hide a fall in one small group. The tables do not show that fall.
The wealth study follows people already in older age, from 2010 to 2022, and adjusts for age, sex, education, smoking, and illness. A hazard of 0.60 is a lower death rate in the follow-up, not a 40% longer life. Country life expectancy is a birth average. It is not the US wealth quartile.
What it means
It is settled that US life expectancy rose to 79.0 in 2024, and that richer older adults had lower mortality than poorer ones, with a wider gap in the United States than in Europe. It is not settled that the poor are dying younger, or that the gap has never been wider. Use 79.0 for the US year. Use 0.60 for the wealth hazard. Use 64 and 76 for the country gap. Do not use “dying younger” for a year that rose.
Common misreadings
- A lower expectancy than the rich is not a fall. The US average rose in 2024.
- A 0.60 hazard is a lower death rate in a study of older adults. It is not a count of years lost at birth.
- “Never wider” needs a long income series. These sources do not have one.
Where the numbers come from
How we built this
- Dataset: CDC 2024 life tables; NEJM 2025 wealth-mortality study; 2024 life expectancy by development group.
- Scope: A national average, a wealth hazard in older adults, and a country gap. No claim that the income gap has never been wider.
- Figures: 79.0 is the US year. 0.60 is the top-quartile hazard. 64 and 76 are men’s country averages.