
World’s Most Unequal Countries
The Gini ranks income gaps inside a country. The world number fell after 1990. It did not keep rising.
Namibia’s 59.1 is a 2015 survey. Colombia’s 54.4 is from 2024. Years are not the same.
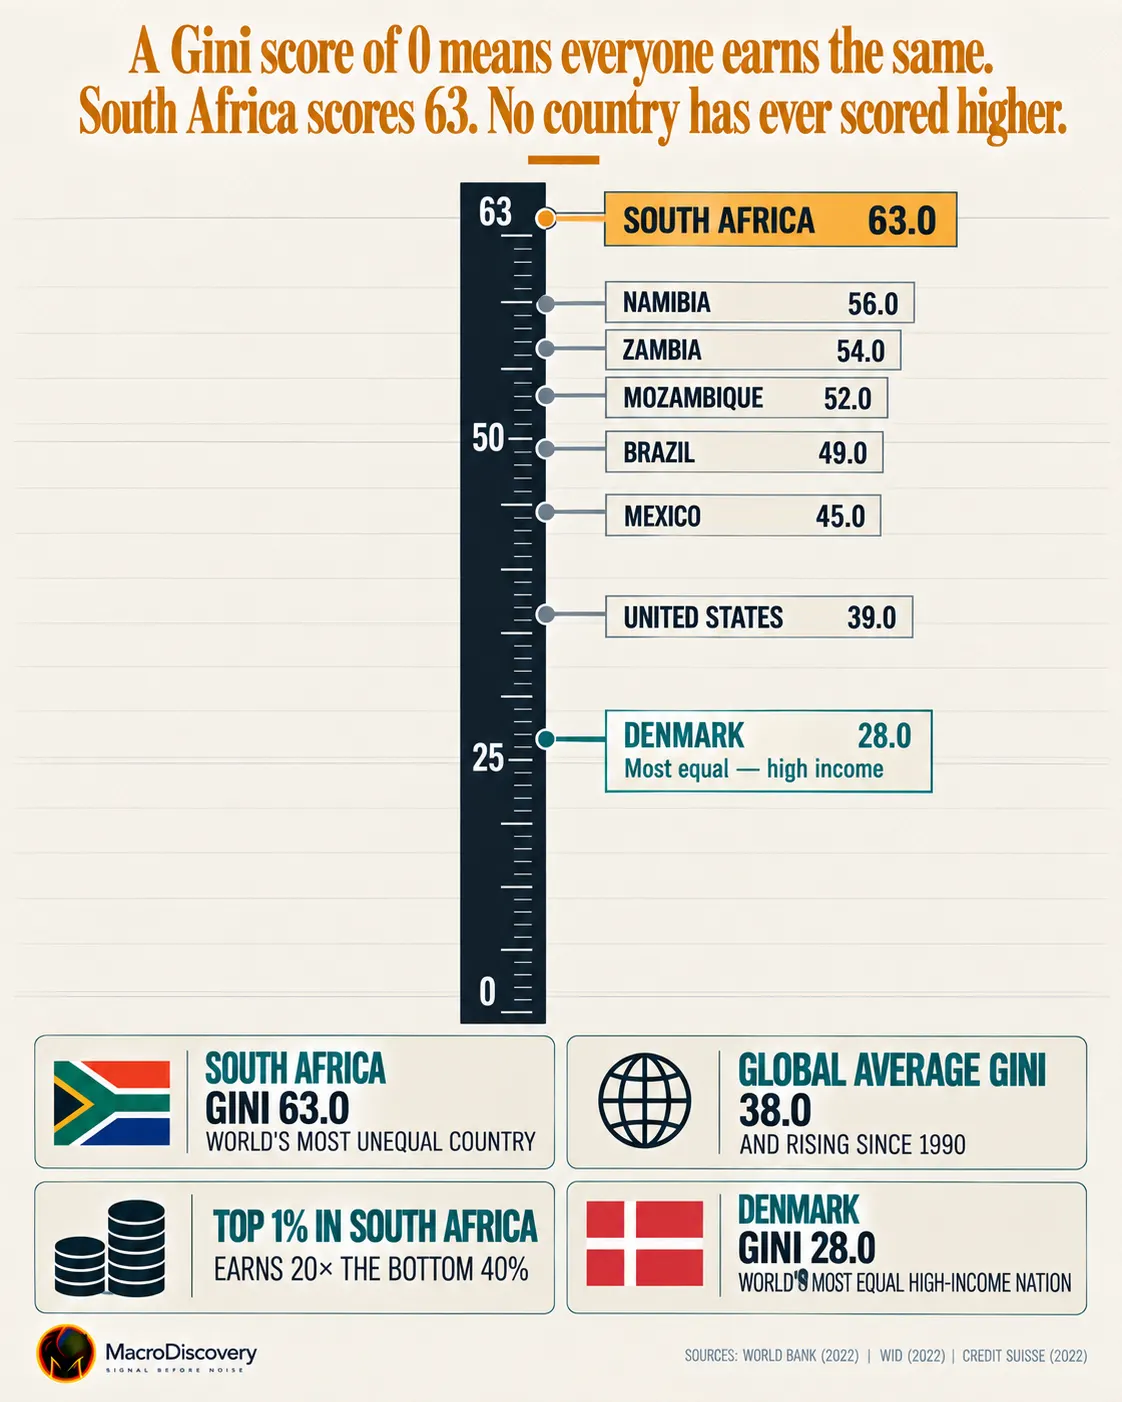
Three numbers
- 59.1 — Namibia’s Gini, the highest latest World Bank survey. Source: World Bank, survey year 2015.
- 54.4 — Colombia’s Gini in 2024, the highest recent reading among large updated surveys. Source: World Bank.
- 62 — global Gini in 2019, down from about 70 in 1990. Source: World Bank.
What the data shows
A common claim is that the Gini keeps rising, and that one list of countries shows where inequality is worst now. The fact is the global Gini fell from about 70 in 1990 to about 62 in 2019, according to the World Bank. Most of that fall came from faster income growth in China and India. The average gap inside countries has been roughly flat since the mid-2010s.
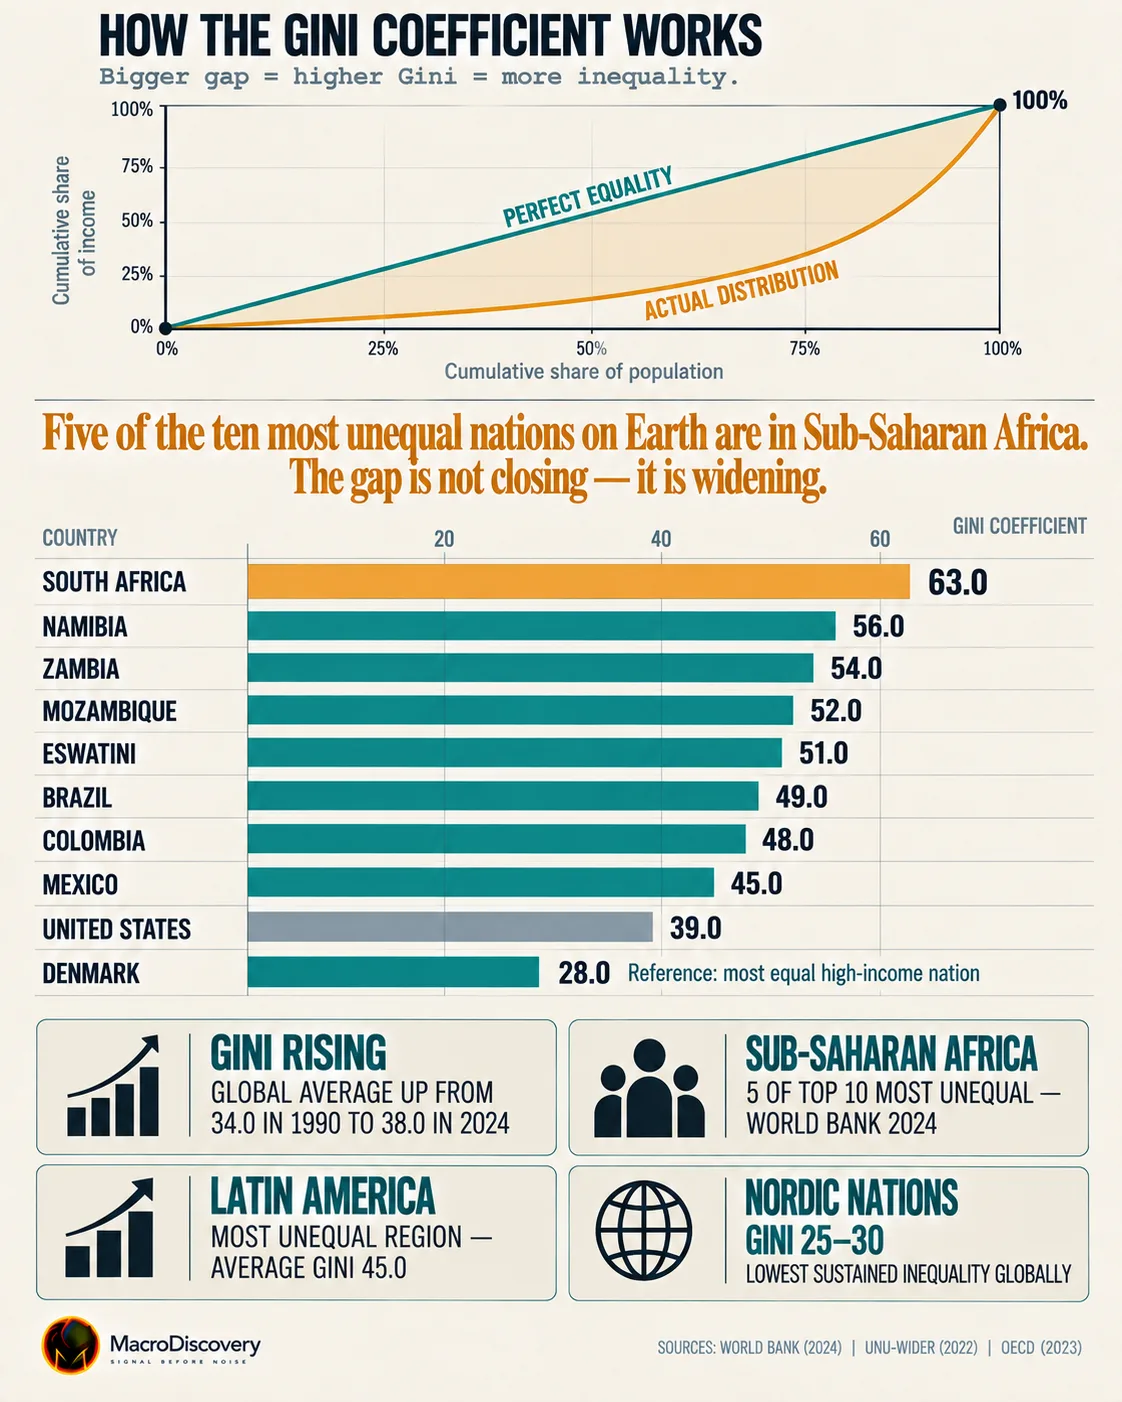
On the latest World Bank survey for each country, Namibia is highest at 59.1. That survey is from 2015. Botswana is 54.9 (2015) and Eswatini is 54.6 (2016). Among surveys from the 2020s, Colombia is 54.4 in 2024, South Africa is 54.1 in 2022, and Brazil is 50.3 in 2024. Slovakia is among the lowest, at 23.8 in 2023. A score of 0 means equal incomes. A score of 100 means one person has all income.
| Country | Gini | Survey year |
|---|---|---|
| Namibia | 59.1 | 2015 |
| Botswana | 54.9 | 2015 |
| Eswatini | 54.6 | 2016 |
| Colombia | 54.4 | 2024 |
| South Africa | 54.1 | 2022 |
| Zambia | 51.5 | 2022 |
| Brazil | 50.3 | 2024 |
World Bank Gini index, 0 to 100. Higher means a wider income gap. Survey years differ.
How it was measured
The Gini comes from a household survey of income or consumption. The World Bank lines those surveys up in the Poverty and Inequality Platform. A country is not surveyed every year. Namibia’s 59.1 and Botswana’s 54.9 are a decade old. Colombia and Brazil have 2024 surveys.
The index does not say who is poor in dollars. A poor country and a rich country can share a Gini. It also misses income hidden from surveys. Wealth inequality, which counts assets, is a different series and is usually higher.
What it means
It is settled that southern Africa and parts of Latin America have the widest measured income gaps, and that the world Gini fell after 1990. It is not settled that every country’s Gini is still rising. Rank countries only with the survey year beside the score.
Common misreadings
- This figure is not a 2024 census for every country. Namibia’s top rank uses a 2015 survey.
- This does not mean the world Gini keeps rising. It fell from about 70 to about 62 between 1990 and 2019.
- A high Gini is not the same as a low average income. South Africa is a middle-income country with a wide gap.
Where the numbers come from
How we built this
- Dataset: World Bank Gini index, latest survey per country, plus the Bank’s 1990–2019 global series.
- Scope: Income or consumption inequality inside countries. Wealth Gini excluded.
- Figures: Scores and survey years used as published. No attempt to update old surveys.






