Compared: The Economics
of Healthcare
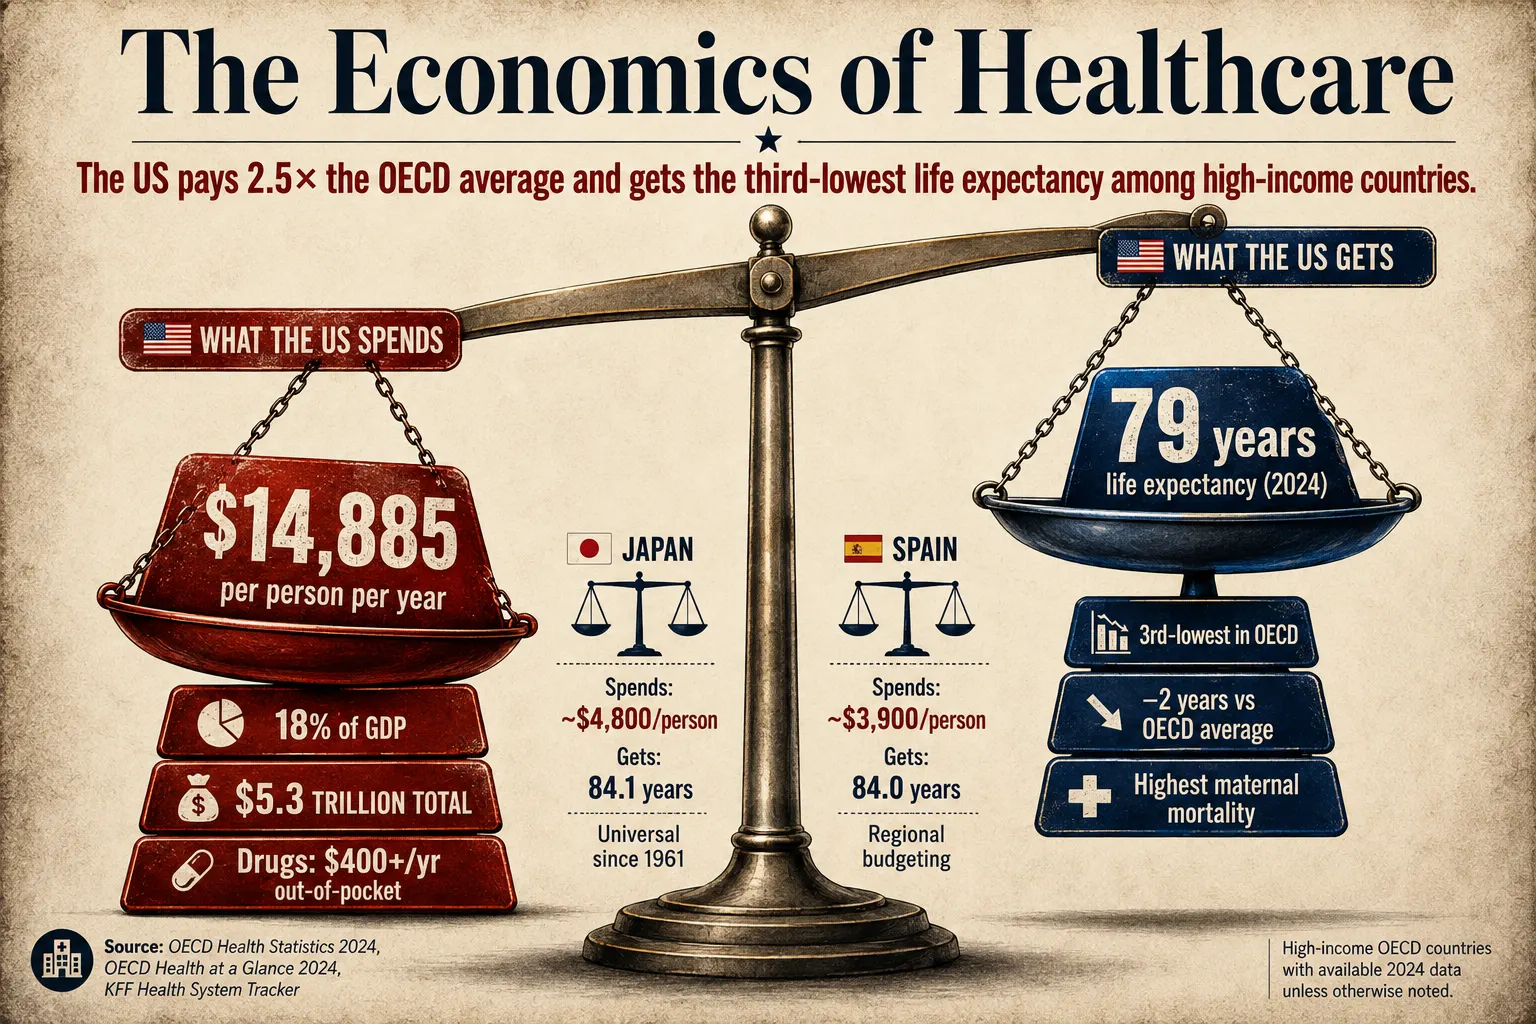
The United States spends 18% of GDP on healthcare — nearly twice the OECD average. Yet Americans have the third-lowest life expectancy among high-income countries at 79 years, two years below average. Americans pay more than $400 out-of-pocket annually on prescription drugs; the French pay under $100. One hundred million Americans lack a regular primary care provider. This is what the money buys — and what it doesn’t.
Healthcare spending per capita (OECD PPP-adjusted, 2024), share of GDP, life expectancy at birth, and universal coverage status. The US leads on spending by a large margin and trails on outcomes among high-income peers. Sources: OECD — Health at a Glance 2025 (PRIMARY · oecd.org · November 13, 2025) for spending; Commonwealth Fund 2026 (PRIMARY · directly fetched · May 28, 2026) for life expectancy and coverage. Peer country spending figures are from OECD 2025 (approx. for those not explicitly named in primary fetch).
| Country | Per capita spend | % of GDP | Life expectancy | Coverage |
|---|---|---|---|---|
|
🇺🇸 United States
Highest spender · third-lowest life expectancy among OECD high-income nations
Partial coverage · ~8% uninsured
|
$14,885
|
18% |
79.0 yrs–2 yrs vs OECD avg |
Partial |
|
🇨🇭 Switzerland
2nd highest spender · highest life expectancy of all OECD · universal coverage achieved
Universal coverage
|
~$9,900
|
~12% |
84.3 yrs+5.3 above US |
Universal |
|
🇩🇪 Germany
Multi-payer statutory insurance · universal coverage since 1883 · Bismarck model
Universal coverage
|
~$7,400
|
~12% |
~81 yrs+2 above US |
Universal |
|
🇫🇷 France
Social insurance model · drug prices below $100/yr OOP vs $400+ in US · universal since 1945
Universal coverage
|
~$5,800
|
~12% |
~82 yrs+3 above US |
Universal |
|
🇯🇵 Japan
84.1 yrs life expectancy — joint highest in OECD · universal since 1961 · dominant primary care model
Universal coverage
|
~$4,800
|
~11% |
84.1 yrs+5.1 above US |
Universal |
|
🇬🇧 United Kingdom
NHS: single-payer, free at point of use since 1948 · universal · under funding pressure
Universal coverage
|
~$5,500
|
~11% |
~81 yrs+2 above US |
Universal |
|
🇪🇸 Spain
84.0 yrs — joint top 3 in OECD · spends far less than US · regional budgeting drives efficiency
Universal coverage
|
~$3,900
|
~10% |
84.0 yrs+5 above US |
Universal |
|
📊 OECD Average
38-country average · OECD Health at a Glance 2025 (primary) · most members have universal coverage
OECD Benchmark
|
$5,967
|
9.3% |
~81 yrsUS is –2 vs avg |
Mostly universal |
|
🇲🇽 Mexico
Announces Universal Health Service by 2027 · with US = only two non-universal in analysis · lowest spend
Partial → reforming
|
~$1,500
|
~6% |
75.5 yrs–3.5 vs US |
Reforming |
The US healthcare paradox is not ancient history. In 1980, US life expectancy was comparable to other wealthy nations. The gap opened over four decades of diverging policy, prices, and coverage. Sources: Commonwealth Fund 2026 (PRIMARY · directly fetched · May 28, 2026) · OECD Health at a Glance 2025 (PRIMARY · November 2025) · KFF / Peterson Health System Tracker (citing CMS NHE 2024 + OECD 2025) · CMS Health Affairs (PRIMARY · January 14, 2026).
The United States healthcare system is the most expensive in the world by a large margin. It is also one of the worst performing among high-income countries on the metrics that matter most: how long people live, how many die from preventable causes, how many cannot access care, and how fairly those outcomes are distributed. The paradox is real, documented, and has been widening for four decades.
“Americans pay more for health care, get less in return, and remain far more exposed to illness, debt, and insecurity than their peers.”
— Commonwealth Fund, “U.S. Health Care from a Global Perspective, 2026 Expanded Edition” (PRIMARY · directly fetched · May 28, 2026 · Conclusion section)Why It Costs So Much — Drug Prices, Medical School Debt, and the Specialist Trap
Three structural features drive US healthcare costs above every peer. First: drug prices. The Commonwealth Fund 2026 (directly fetched) confirms Americans pay more than $400 per year out-of-pocket on prescription drugs; the French pay under $100. Unlike every other wealthy country, the US government historically lacked the authority to negotiate drug prices — meaning pharmaceutical companies set prices unilaterally in the world’s largest market. Second: the medical education system. The US has the highest medical school tuition fees of any country analysed by the Commonwealth Fund — producing only 8.6 graduates per 100,000 people, against an OECD average of 15. High debt pushes new doctors toward high-paying specialities and away from primary care. Third: a system built on services rendered, not outcomes achieved — one that rewards procedures over prevention and specialist care over primary care.
What Actually Works — Spain Spends a Quarter of the US Total and Lives Five Years Longer
Spain is the most important comparison in the Commonwealth Fund 2026 analysis. It spends approximately $3,900 per capita — roughly 26% of US spending per person — and achieves a life expectancy of 84.0 years, five years higher than the US. Spain uses regional health budgets that allocate funding based on local needs, preventing overuse of high-cost interventions while ensuring universal access. Japan, with the world’s second-longest life expectancy (84.1 years), built its system on a dominant primary care model with strong social cohesion, low rates of obesity, and universal coverage since 1961. Switzerland — the only country the Commonwealth Fund classifies as spending more than half of what the US spends — achieves 84.3 years life expectancy with universal coverage, tight price regulation, and standardised benefit packages. The pattern across all high-performing systems is consistent: universal access, negotiated drug prices, strong primary care, and regional cost controls. None of the top-performing systems cost anywhere near what the US spends.