AI Tech Gaming Future Automobile Top 10 Space Innovation Trending How To Reviews Discover

---Advertisement---

Visualized: Where a $100M Athlete’s Money Goes

Macro Discovery
On: June 25, 2026 4:17 PM
Follow Us:
---Advertisement---
Visualized: Where a $100M Athlete's Money Goes
Visualized: Where a $100M Athlete’s Money Goes
Where a $100M Athlete’s Money Goes — MacroDiscovery
MacroDiscovery
Wealth & Sports · 4 min read · Current Data
NOW — Athlete Finance · Wealth · Consumer Behavior · 2024
Wealth & Sports Business

Where a $100M
Athlete’s Money Goes

A $100 million career. 37% to taxes before anything else is touched. 15% to agents, managers, and lawyers. What remains — and why most athletes are broke within years of retirement — is a data story about financial systems, not personal failure.

By MacroDiscovery
Sources: NFLPA · Sports Illustrated · Financial Planning Association
Updated: 2024
$37M
To taxes — first cut
78%
NFL players broke within 2 yrs
15%
To agents & management
$23M
Lifestyle spending over career
$12M
Avg actual net worth retained
Visualization 01 — Money Flow Diagram
Where $100 Million Goes — From Contract to Net Worth

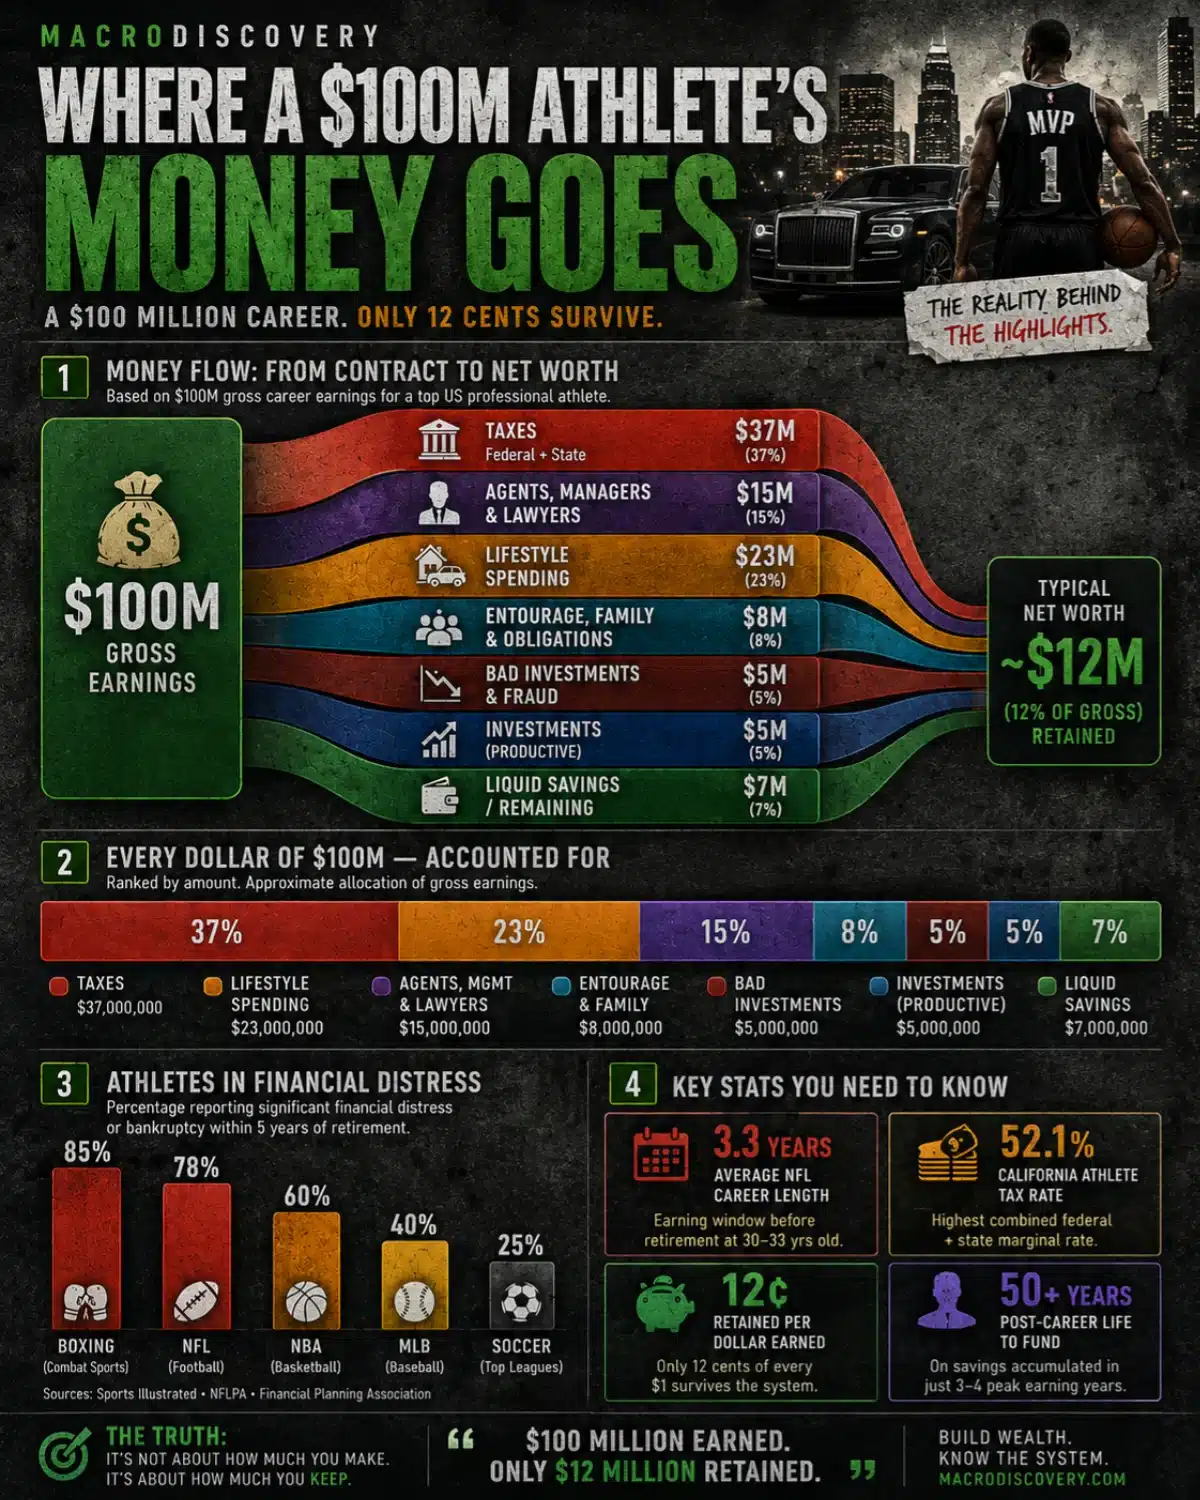
Approximate flow of $100M gross career earnings for a top US professional athlete. Based on US federal + state tax rates, standard agent structures, and reported spending patterns.

$100M GROSS EARNINGS FEDERAL + STATE TAX $37M 37% of gross · gone first AGENTS + MGMT $15M 15% · agent, lawyer, manager LIFESTYLE SPENDING $23M homes, cars, travel, clothes ENTOURAGE + FAMILY $8M BAD INVESTMENTS $5M INVESTED $5M LIQUID $7M TYPICAL NET WORTH ~$12M of $100M earned · 12 cents on the dollar $100M Career Earnings 37% 15% 23% 8% 5% 12% Sources: NFLPA · Financial Planning Association · Sports Illustrated · NBPA
Visualization 02 — Complete Cost Breakdown
Every Dollar of $100M — Accounted For

Ranked by amount. Based on average US professional athlete earning $100M gross over an 8–12 year career.

Tax 37%
Lifestyle 23%
Agents 15%
Entourage 8%
Invest 5%
Bad 5%
Liquid 7%
Federal + State Tax Top federal rate 37% + state. California athletes pay up to 52.1% combined. Tax is the single largest deduction before any choice is made.
$37,000,000 37% of gross
Lifestyle Spending Homes, cars, private travel, clothing, jewelry, restaurants, hotels. Driven by peer comparison and sudden wealth syndrome.
$23,000,000 23% of gross
Agents, Managers & Lawyers Agent commission typically 3–10%. Add sports lawyer (1–2%), financial advisor (1%), business manager (5%). Total: 10–18% of gross.
$15,000,000 15% of gross
Entourage, Family & Obligations Supporting extended family, childhood friends, security, personal chef, trainers, stylists, and social obligations that scale with income.
$8,000,000 8% of gross
Liquid Savings (cash held) Cash in accounts, real estate equity. Often overconcentrated in real estate. Most athletes hold insufficient liquid reserves relative to lifestyle burn rate.
$7,000,000 7% of gross
Investments (productive) Stocks, index funds, business equity. Athletes who retain strong financial advisors achieve this. Most do not — only 35% of professional athletes invest consistently.
$5,000,000 5% of gross
Failed Investments & Fraud Bad business deals, scams, opportunistic “friends” pitching ventures. Athletes are disproportionately targeted — and disproportionately trusting of people they know.
$5,000,000 5% of gross
Typical Net Worth at Retirement 12 cents retained per dollar earned. Most athletes retire in their early 30s with a 50+ year post-career life to fund on this balance.
~$12,000,000 12% of gross
Visualization 03 — Financial Distress by Sport
Athletes in Financial Distress After Retirement

Percentage reporting significant financial distress or bankruptcy within 5 years of retirement. Source: Sports Illustrated, NFLPA, Financial Planning Association.

NFL · American Football
78%
In financial distress within 2 years of leaving the league
Shortest average career (3.3 years), highest lifestyle inflation, worst financial education infrastructure among major sports.
NBA · Basketball
60%
Broke within 5 years of retirement
Higher average salaries than NFL but longer career peak spending window. Divorce settlements and child support are leading drivers.
Boxing · Combat Sports
85%
End career in financial difficulty
Highest promoter and management fee structures. Earnings concentrated in a handful of fights. Mike Tyson earned $400M — filed for bankruptcy in 2003.
MLB · Baseball
40%
Significant financial trouble within 5 years
Longer careers and better union pension infrastructure reduce risk. Still — 40% is a structural failure, not a personal one.
NFL Avg Career Length
3.3 yrs
Average NFL career — earning window before retirement
A player must fund 50+ post-career years on 3.3 years of earnings, after taxes, agents, and lifestyle costs take their share first.
Visualization 04 — Where the Lifestyle $23M Goes
Inside the Lifestyle Spending Category

Typical allocation of the $23M lifestyle spend for a major US professional athlete earning $100M career gross.

🏠 Real Estate
$8.5M
of $100M career gross
Primary home, vacation home, family properties. Real estate is often the largest single asset — and the most illiquid one. Many athletes are house-rich and cash-poor at retirement.
🚗 Vehicles & Jewelry
$4.2M
of $100M career gross
Car collections averaging 12–20 vehicles among high earners. Jewelry and watches. Pure depreciating consumption — zero investment value.
✈️ Travel & Experiences
$3.8M
of $100M career gross
Private jets (charter or ownership), 5-star hotels, international travel, VIP events. Private jet charter averages $10,000–$15,000 per flight hour.
🎉 Entertainment & Social
$3.5M
of $100M career gross
Clubs, events, picking up tabs for large groups, charitable appearances. Social status maintenance that scales with earnings and is nearly impossible to reduce.
⚖️ Legal & Divorce
$3.0M
of $100M career gross
Divorce settlements, child support, paternity cases, legal disputes. Athletes have above-average divorce rates. Settlements are calculated on peak earnings — not post-retirement income.

The most counterintuitive data point in professional sports finance is this: **78% of NFL players** are in financial distress within two years of retirement, according to a landmark investigation by **Sports Illustrated**. Not 78% of undrafted players. Not 78% of minimum-salary earners. 78% of players — including many who earned tens of millions of dollars.

The reason is structural. A **$100 million career** in the United States begins with an immediate 37% reduction to federal and state taxes — before any lifestyle decision is made. California athletes (Lakers, 49ers, Rams) face a combined marginal rate of **up to 52.1%**. Then come agents, typically charging **3–5% of contracts**, plus lawyers, financial advisors, and business managers collectively taking another 5–10%. The athlete has not spent a dollar on themselves, and they are already down to **$48 million**.

“Mike Tyson earned an estimated $400 million in career earnings. He filed for bankruptcy in 2003. The money didn’t disappear. It was systematically extracted — by taxes, promoters, managers, spending, and fraud — faster than it arrived.”

What compounds the problem is the **earning window vs. spending window mismatch**. The average NFL career lasts **3.3 years**. The athlete must fund 50+ years of post-career life on earnings concentrated in that window — after taxes and agents have already taken more than half. The lifestyle established during peak earning years — the houses, the entourage, the travel — does not compress when the contracts stop. According to **CNBC’s analysis of NFLPA data**, the average NFL player’s spending actually increases in the first two years after retirement as they process the identity shift away from professional sport.

The **entourage economy** is a separate and underreported drain. Most high-earning athletes support extended networks of family members, childhood friends, and social circles who depend on the athlete’s income. Research by the **Financial Planning Association** found that the average professional athlete financially supports **5–10 additional people** beyond their immediate household. When income stops, these obligations do not — creating immediate cash flow crises even for athletes who retained modest savings.

Macro Takeaway — 5 to 10 Year Outlook

The systemic nature of athlete financial distress is increasingly recognized as a structural problem, not a personal failure. The **NBPA and NFLPA** have both expanded mandatory financial education requirements in recent collective bargaining agreements. Several states have passed legislation capping agent commissions. Fintech platforms specifically targeting athlete financial management — including **Greenlight, Cantaloup, and Athlean Invest** — have raised over $200 million collectively since 2020 targeting this demographic.

The underlying economics, however, are not easily changed. Short careers, complex tax structures, peer spending pressure, and predatory financial advisors are structural features of professional sport — not bugs. Until the earning window is longer, the tax structure is more favorable to career averaging, and financial literacy is embedded earlier in athletic development pipelines, the **12-cents-on-the-dollar retention rate** will remain the defining statistic of professional athlete wealth.

Forecast Cards — Key Data Points
Sports Wealth · NFL
78%
NFL players in financial distress within 2 years of retirement — despite earning millions during their careers.
Sports Illustrated · NFLPA Financial Study
Sports Wealth · Retention
12¢
Average cents retained per dollar earned by a professional athlete after taxes, agents, lifestyle, and failed investments.
Financial Planning Association · NBPA 2024
Sports Wealth · Agents
15%
Average share of gross earnings paid to agents, managers, lawyers, and financial advisors across a professional athlete’s career.
Sports Business Journal · NFLPA CBA 2024
Sports Wealth · Tax
52.1%
Combined federal and California state marginal tax rate for athletes playing in California — the highest effective rate among major sports markets.
IRS · California FTB · Tax Foundation 2024
Sources & Methodology
  • Sports Illustrated — “How (and Why) Athletes Go Broke” (landmark investigation)
  • NFLPA — Player Financial Education Program Data 2024
  • NBPA — Financial Wellness Survey 2023
  • Financial Planning Association — “Financial Planning for Professional Athletes” 2024
  • Tax Foundation — State and Federal Marginal Tax Rates by State 2024
  • CNBC — “Why So Many Pro Athletes Go Broke” (2024)
  • Sports Business Journal — Agent Commission and Management Fee Structures 2024
  • IRS — Publication 525 (Taxable and Nontaxable Income) 2024

Macro Discovery

Sukh Dhaliwal

Sukh Dhaliwal is the founder of Macro Discovery, an independent digital publication covering AI, technology, science, future trends, and global innovation through visual storytelling and data-driven analysis.

Join WhatsApp

Join Now

Join Facebook

Follow us

Leave a Comment