AI Tech Gaming Future Automobile Top 10 Space Innovation Trending How To Reviews Discover

---Advertisement---

Visualized: The World’s Wealth Visualized as 100 People

Macro Discovery
On: June 26, 2026 9:43 AM
Follow Us:
---Advertisement---
Visualized: The World's Wealth Visualized as 100 People
Visualized: The World’s Wealth Visualized as 100 People
The World’s Wealth Visualized as 100 People · MacroDiscovery
MacroDiscovery
Wealth & Society · 4 min read · 2024 Data
NOW — Global Wealth Distribution · Inequality · 2024
Wealth & Society

The World’s Wealth
Visualized as
100 People

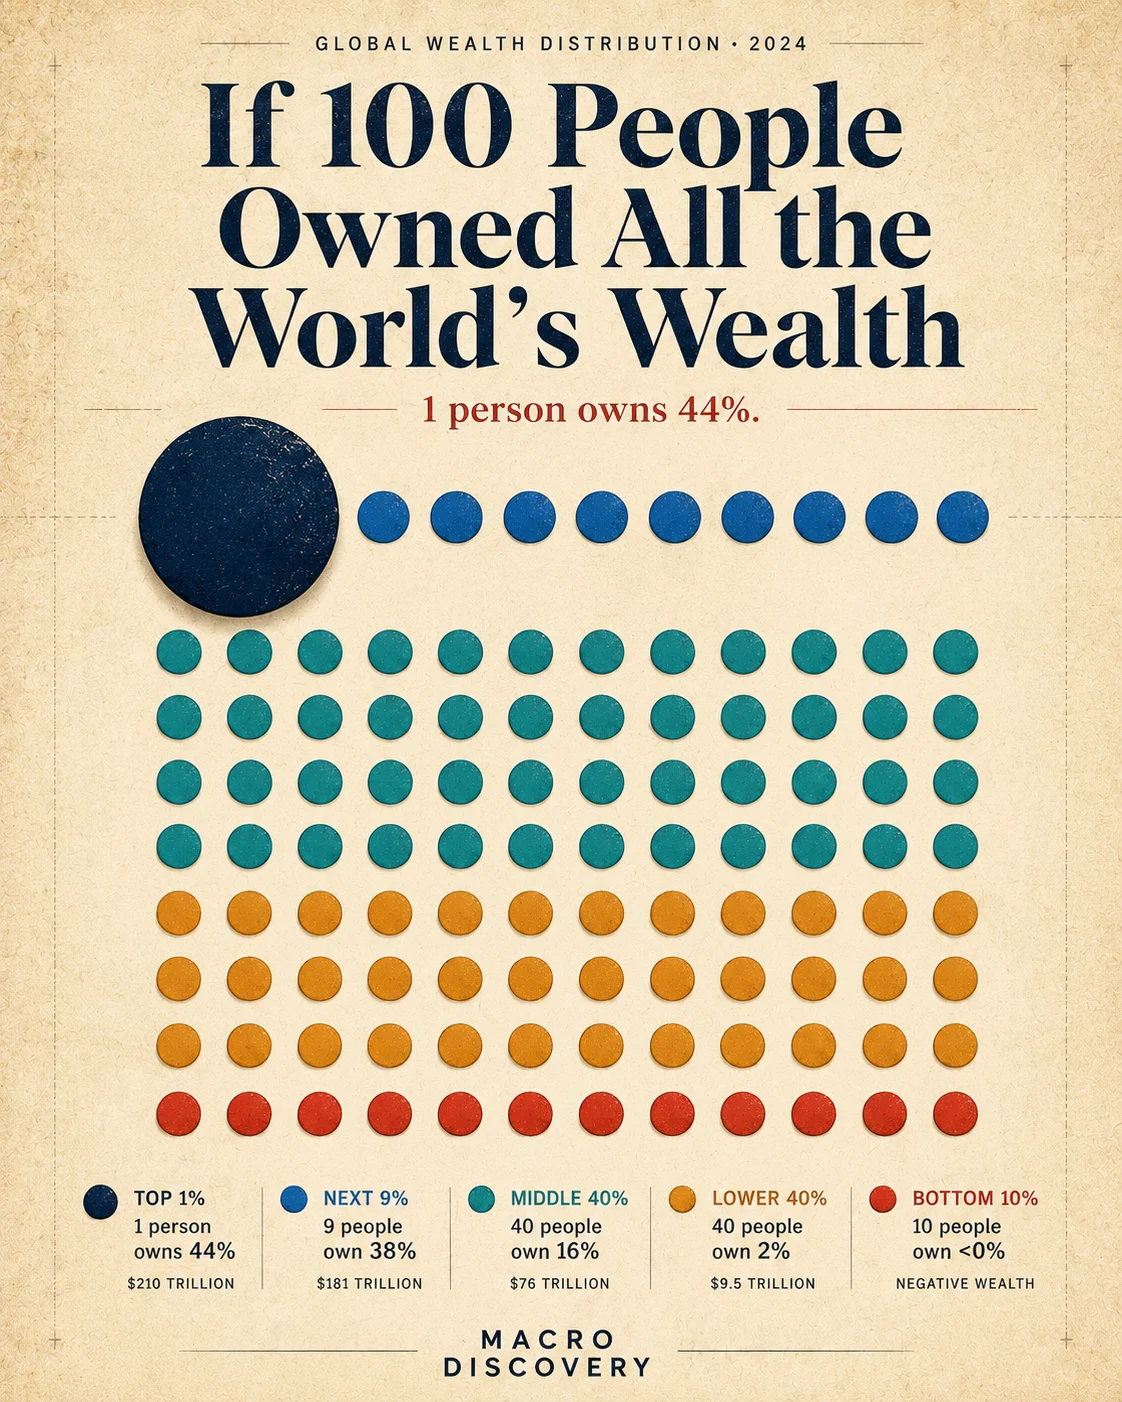
If all of humanity’s $477 trillion in wealth were split among just 100 people representing the world: 1 person owns 44%. The bottom 50 share 2%. This is the most extreme wealth concentration since records began — and it is still accelerating.

By MacroDiscovery
Sources: Credit Suisse · UBS · Oxfam · World Bank
Updated: 2024
44%
Owned by top 1% globally
$477T
Total global household wealth 2024
2%
Owned by bottom 50% of humanity
8
Billionaires own as much as bottom 50%
$4,200
Median global wealth per adult
Visualization 01 — 100 People, All the World’s Wealth
If 100 People Represented All of Global Wealth

Each dot = 1% of the global population. Color = their share of total global wealth. Based on Credit Suisse Global Wealth Report 2024 and UBS Wealth Report 2024. Total global household wealth: $477 trillion.

Top 1% — own 44% of all wealth
Next 9% — own 38%
Middle 40% — own 16%
Lower 40% — own 2%
Bottom 10% — negative wealth
1
Visualization 02 — What Each Tier Actually Owns
The Five Wealth Tiers — Shares of $477 Trillion

Global household wealth by percentile group. Bar width = share of total global wealth. Source: Credit Suisse Global Wealth Report 2024, UBS Wealth Report 2024.

Top 1%
~80M people globally
44% of all global wealth — $210 trillion
44% $210 trillion
Next 9%
~720M people
38% · $181 trillion
38% $181 trillion
Middle 40%
~3.2B people · median $22K
16% · $76 trillion
16% $76 trillion
Lower 40%
~3.2B people · median $700
2% · $9.5T
2% $9.5 trillion
Bottom 10%
~800M people · negative net worth
Negative
<0 Net debt
Visualization 03 — Where the 100 People Live
Regional Distribution of Wealth Holders

If 100 people represented the top wealth holders — who holds the most, and where they live. Source: Credit Suisse Global Wealth Report 2024, World Bank 2024.

North America
30 people
5% of population
33% of wealth
Europe
25 people
10% of population
26% of wealth
Asia-Pacific
28 people
56% of population
29% of wealth
Latin America
7 people
8% of population
7% of wealth
Africa
3 people
18% of population
3% of wealth
Middle East
7 people
3% of population
7% of wealth
← Middle East (7)
THE POPULATION PARADOX
Africa has 18% of the world’s population but holds only 3% of wealth. North America has 5% of the world’s population but holds 33% of wealth. Asia has 56% of the population but only 29% of wealth — held mainly in China, Japan, and Australia.
Visualization 04 — What Each Tier’s Wealth Actually Means
The Same Number — Completely Different Realities

What a representative amount of wealth means in practice at each tier. Based on median wealth per adult within each percentile group. Source: Credit Suisse 2024.

Top 1%
Median wealth in this group
$2.6M+
Their wealth generates more annual passive income (~$130K at 5%) than the median global worker earns in a lifetime of labor. They do not need to work — their capital works for them. Most of this group do not appear on any billionaire list.
Next 9%
Median wealth in this group
~$250K
A comfortable upper-middle-class position in a wealthy nation — typically home equity + retirement savings. Financially secure but not wealthy enough to stop working. Represents most professional-class adults in the US, Europe, and Australia.
Middle 40%
Median wealth in this group
~$22,000
The global middle class. In a wealthy nation this feels modest. In most developing nations, $22,000 in net assets represents generational security. Includes most workers in Eastern Europe, Brazil, China, and Mexico who own their home with little debt.
Lower 40%
Median wealth in this group
~$700
$700 in total net assets. No savings buffer against illness, job loss, or natural disaster. Includes the majority of adults in Sub-Saharan Africa, South Asia, and Southeast Asia. A single emergency wipes out all accumulated wealth.
Bottom 10%
Net wealth position
Negative
Debt exceeds assets. Includes many Americans and Europeans with student loans, medical debt, or credit card balances that exceed any savings or property equity. Negative net worth is not confined to developing nations — it is structural in high-debt consumer economies.
Billionaire Class
~3,000 people globally
$14T+
3,000 people — 0.000038% of humanity — hold more wealth than the bottom 5 billion people combined. Their wealth grew by $3.3 trillion in 2024 alone. At this scale, individual spending is irrelevant — only investment and political influence matter.

Why Wealth Concentration Keeps Accelerating

The mechanism is mathematical, not moral — and it compounds automatically.

Wealth generates returns. Returns reinvested generate more returns. At the scale of the top 1%, passive capital income routinely outpaces economic growth itself — meaning the wealthy accumulate faster than the economy expands, making their share structurally larger each decade.

  • r > g: Thomas Piketty’s central finding — the return on capital (r) consistently exceeds economic growth (g), automatically concentrating wealth at the top.
  • Asset inflation: Post-2008 monetary policy inflated asset prices (housing, equities) — owned primarily by those already wealthy. Those without assets saw no benefit.
  • COVID acceleration: Global wealth grew by $28.7 trillion in 2021 — but virtually all gains accrued to existing asset holders while workers faced inflation.
Key Insight
The top 1% share of global wealth has risen from 38% in 1995 to 44% in 2024. At the current trajectory, the top 1% will control over 50% of global wealth before 2030 — a threshold no modern economy has ever reached.

Wealth concentration is not a flaw in the system — at this point, it is the output the system was designed to produce.

The Median vs. The Mean — Why Averages Lie

Global average wealth per adult looks comfortable. Median wealth reveals the reality.

Global average wealth per adult is approximately $87,000. Median global wealth per adult is $4,200 — 95% lower. The difference is the mathematical signature of extreme inequality: a small number of very large values pull the average far above what most people experience.

Why It Matters
When governments or institutions cite average wealth figures, they are describing the world of the top 10%, not the experience of the typical person. Policy designed around averages consistently fails to address the conditions of the median — the person in the middle of the actual distribution.

Mean wealth is a billionaire metric. Median wealth is a human one.

Macro Takeaway — 5 to 10 Year Outlook

The 50% Threshold Is Coming

The top 1% are on track to own more than half of all global wealth before 2030.

At current accumulation rates, Oxfam projects the first trillionaire within a decade. The concentration mechanism — capital returns exceeding growth — requires no acceleration; it simply continues compounding. The political response to that milestone will define the economic architecture of the 2030s.

Wealth Taxes Are Approaching the Policy Mainstream

What was fringe in 2015 is now being implemented or seriously debated in major economies.

Brazil’s G20 presidency (2024) proposed a 2% global minimum tax on billionaires — endorsed by France, Germany, and Spain. The EU is drafting a wealth tax directive. The US proposed a 25% minimum tax on unrealized gains for those with over $100M in assets. None has passed, but the direction is set.

AI Will Widen the Gap Before It Narrows It

The early gains from AI accrue to capital owners — the same group already at the top of the distribution.

AI productivity gains, in their first wave, flow to the companies that own the models, the compute, and the data. Workers who are displaced do not automatically receive a share of the productivity gain they enabled. Without structural redistribution mechanisms, AI represents the most powerful wealth concentration engine yet deployed — larger in potential effect than any previous technological revolution.
Sources & Methodology
  • Credit Suisse / UBS — Global Wealth Report 2024 (ubs.com/global-wealth-report)
  • Oxfam — “Inequality Inc.” Report 2024 (oxfam.org)
  • World Bank — Poverty and Inequality Platform 2024 (pip.worldbank.org)
  • Piketty, T. — Capital in the Twenty-First Century (Harvard University Press 2014)
  • World Inequality Lab — World Inequality Report 2024 (wid.world)
  • Forbes — The World’s Billionaires 2024 (forbes.com/billionaires)
  • Federal Reserve — Distribution of Household Wealth Q3 2024
Macro Discovery

Sukh Dhaliwal

Sukh Dhaliwal is the founder of Macro Discovery, an independent digital publication covering AI, technology, science, future trends, and global innovation through visual storytelling and data-driven analysis.

Join WhatsApp

Join Now

Join Facebook

Follow us

Leave a Comment