AI Tech Gaming Future Automobile Top 10 Space Innovation Trending How To Reviews Discover

---Advertisement---

Ranked: The Countries With the Most Natural Resources

Macro Discovery
On: June 26, 2026 9:54 AM
Follow Us:
---Advertisement---
Ranked: The Countries With the Most Natural Resources
The Countries With the Most Natural Resources · MacroDiscovery
MacroDiscovery
Trade & Economy · 4 min read · 2024 Data
NOW — Natural Resources · Geopolitics · Commodity Wealth · 2024
Trade & Economy

The Countries With
the Most Natural Resources

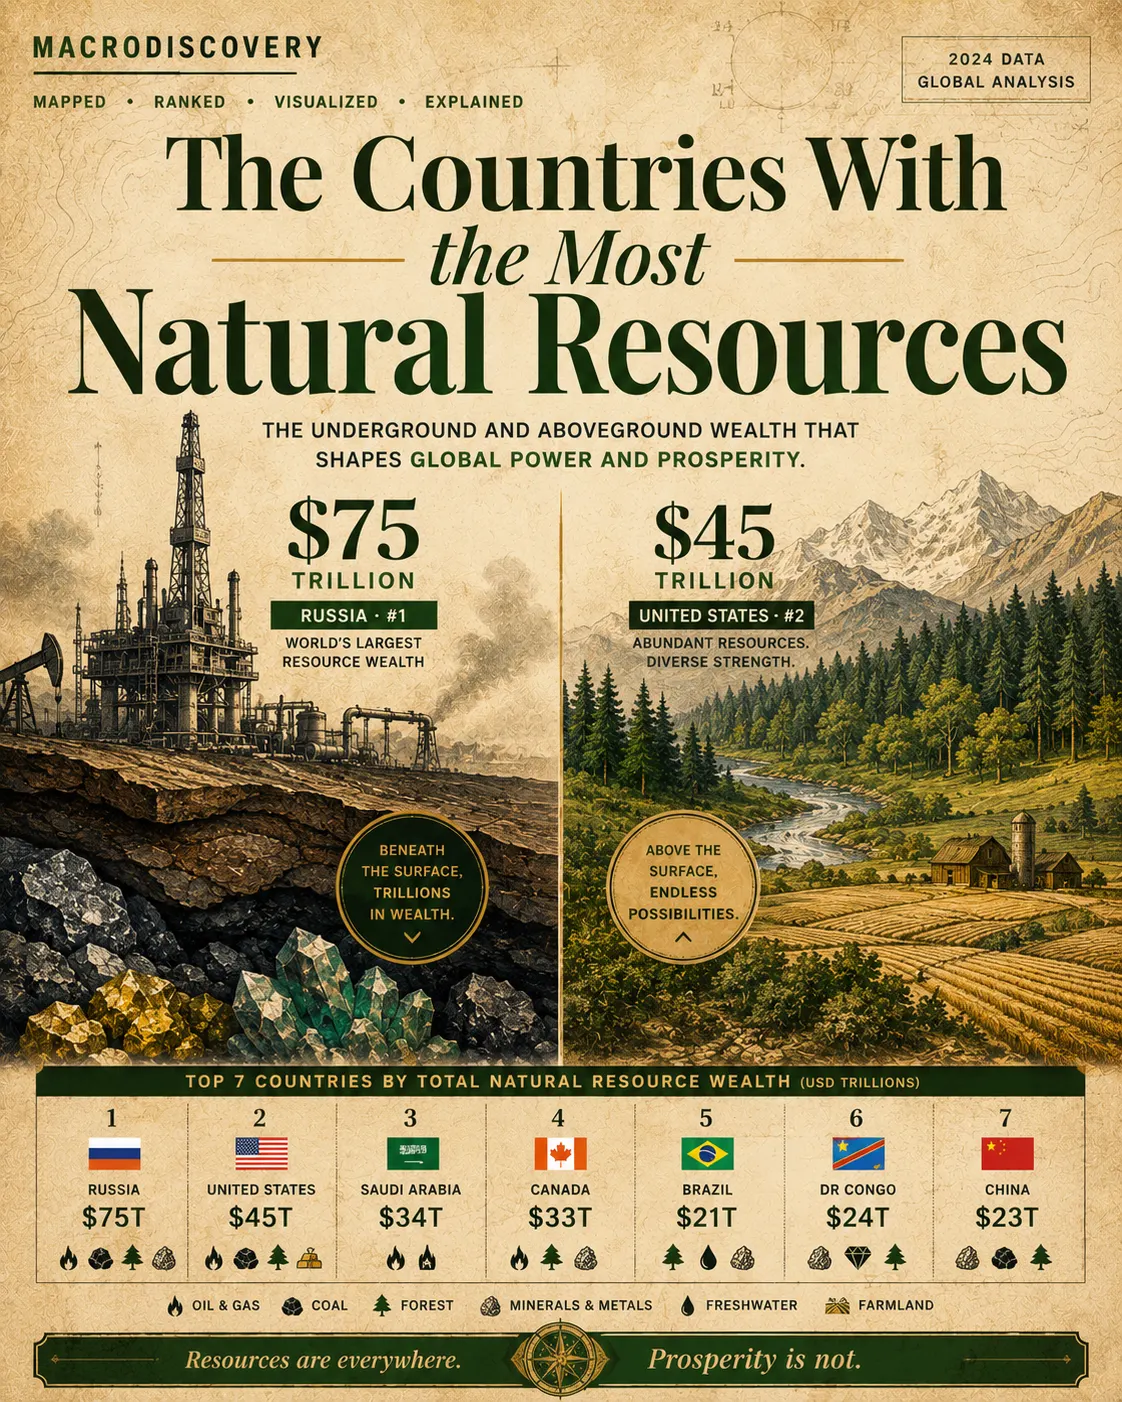
Russia holds $75 trillion in natural resources. The United States $45 trillion. Saudi Arabia $34 trillion. The geography of underground wealth is not where most people think it is — and having it does not guarantee prosperity.

By MacroDiscovery
Sources: World Bank · USGS · Visual Capitalist · IMF
Updated: 2024
$75T
Russia — world’s largest resource wealth
$1.5Q
Total global natural resource value
10
Countries hold 80% of all resource wealth
$0
Japan’s natural resource wealth per capita
40%
Global oil reserves in Middle East
Visualization 01 — Global Resource Wealth Map
Natural Resource Wealth by Country — Total Estimated Value

Color intensity = total estimated natural resource wealth (oil, gas, coal, minerals, forest, freshwater). Darker green = higher value. Source: World Bank Wealth of Nations 2024, USGS Mineral Resources, Visual Capitalist 2024.

RUSSIA · $75T USA · $45T CANADA · $33T KSA·$34T Mid East Iran·$27T AUSTRALIA · $19T CHINA · $23T BRAZIL · $21T INDIA·$14T DRC $24T Africa Europe NOR Central Asia Indonesia VEN $14T S. America RESOURCE WEALTH Low Medium High ($75T) Sources: World Bank Wealth of Nations 2024 · USGS · Visual Capitalist
Visualization 02 — Country Rankings
Top 15 Countries by Total Natural Resource Wealth

Estimated total value of oil, gas, coal, minerals, forests, and freshwater. USD trillions. Source: World Bank Wealth of Nations 2024, Visual Capitalist, USGS 2024.

01 🇷🇺Russia
$75T — oil, gas, coal, timber, metals
$75T
02 🇺🇸United States
$45T — coal, gas, oil, gold, copper
$45T
03 🇸🇦Saudi Arabia
$34T — oil dominates 90%+
$34T
04 🇨🇦Canada
$33T — oil sands, forests, potash
$33T
05 🇮🇷Iran
$27T — 4th largest oil, 2nd largest gas
$27T
06 🇨🇩DR Congo
$24T — cobalt, coltan, diamonds, gold
$24T
07 🇨🇳China
$23T — rare earths, coal, gold, land
$23T
08 🇧🇷Brazil
$21T — iron ore, oil, freshwater, timber
$21T
09 🇦🇺Australia
$19T — iron ore, gold, coal, lithium
$19T
10 🇮🇶Iraq
$16T — 5th largest oil reserves
$16T
11 🇻🇪Venezuela
$14T — largest proven oil reserves
$14T
12 🇮🇳India
$14T — coal, iron ore, land
$14T
13 🇰🇿Kazakhstan
$12T — oil, uranium, chromium
$12T
14 🇰🇼Kuwait
$9T — among world’s top 5 oil reserves
$9T
15 🇿🇦South Africa
$9T — gold, platinum, diamonds, chrome
$9T
Visualization 03 — What Each Nation Actually Holds
Resource Composition — Top 6 Nations Compared

Share of total resource wealth by type for each top nation. Concentration = vulnerability. Source: USGS, World Bank, BP Statistical Review 2024.

🇷🇺 Russia $75T total
Natural Gas
33%
🛢Oil
25%
Coal
21%
🌲Timber
12%
Metals
9%
🇺🇸 United States $45T total
Coal
30%
Natural Gas
26%
🛢Oil
22%
Gold/Copper
14%
🌾Farmland
8%
🇸🇦 Saudi Arabia $34T total
🛢Oil
90%
Natural Gas
8%
Phosphate/Min
2%
🇨🇩 DR Congo $24T total
Cobalt / Coltan
55%
💎Diamonds/Gold
22%
🌲Timber
15%
🛢Oil (offshore)
8%
🇧🇷 Brazil $21T total
💧Freshwater
28%
🌲Amazon Timber
25%
🛢Pre-Salt Oil
24%
Iron Ore
14%
🌾Farmland
9%
🇦🇺 Australia $19T total
Iron Ore
35%
Coal
22%
🔋Lithium
18%
🥇Gold
14%
LNG
11%
Visualization 04 — The Resource Curse
Rich in Resources — But Not in Outcomes

Countries with enormous resource wealth but poor human development outcomes — the “resource curse” paradox. Source: IMF, UNDP Human Development Index 2024.

⚠ Severe Resource Curse
🇨🇩 DR Congo
$24T resources · HDI rank: 179/193
The most extreme paradox on Earth. Holds $24 trillion in minerals — including 70%+ of global cobalt — yet ranks near the bottom of every human development index. Decades of conflict financed by mineral wealth.
⚠ Severe Resource Curse
🇻🇪 Venezuela
Largest proven oil reserves · Economy collapsed
Holds the world’s largest proven oil reserves — larger than Saudi Arabia. GDP per capita collapsed 80% between 2013–2021. Oil dependence without institutional diversification is the textbook resource curse.
◆ Moderate Resource Curse
🇳🇬 Nigeria
Africa’s largest oil producer · 70% in poverty
Earns $50B+/yr from oil exports yet 70% of its population lives below the poverty line. Revenue captured by elites and the federal center never reaches state level. Classic Dutch Disease — oil strengthened the currency, killed other industries.
◆ Moderate Resource Curse
🇷🇺 Russia
$75T resources · GDP per capita: $15K
The world’s richest nation in raw resources has a GDP per capita of $15,000 — similar to Malaysia. Resource rents captured by oligarchs post-1991 created wealth concentration without broad economic development.
✓ Escaped the Curse
🇳🇴 Norway
$1T+ Sovereign Wealth Fund from oil revenue
Discovered North Sea oil in 1969. Instead of spending revenues, established the Government Pension Fund Global — now the world’s largest sovereign wealth fund at $1.7 trillion. The anti-resource-curse blueprint.
✓ Escaped the Curse
🇦🇺 Australia
$19T resources · HDI rank: 5/193
World’s largest exporter of iron ore, lithium, and LNG — yet ranks 5th on the Human Development Index. Strong institutions, rule of law, and resource revenue reinvestment in education and infrastructure are the differentiators.

Why Having It Doesn’t Mean Keeping It

Resource wealth and economic prosperity have an inconsistent relationship — institutions determine which way it goes.

  • The Dutch Disease effect: Resource export revenues strengthen national currencies, making manufactured goods uncompetitive and hollowing out non-resource industries.
  • Elite capture: In countries with weak institutions, resource rents concentrate in the hands of small political and business elites — never reaching population-level wealth.
  • Conflict financing: In fragile states, mineral wealth funds armed groups. The DRC’s cobalt, Angola’s diamonds, and Sierra Leone’s blood diamonds all financed devastating civil wars.
Key Insight
Norway and Australia prove that resource wealth can generate broad prosperity — but only when combined with strong rule of law, transparent institutions, and sovereign wealth structures that reinvest revenues across generations.

Resources are a lottery ticket — institutions determine whether you cash it.

The Transition Reshuffles the Deck

The energy transition is changing which resources matter — and which countries win.

Saudi Arabia’s $34 trillion is 90% oil. As EV adoption accelerates, that asset base becomes structurally less valuable. Meanwhile, the DRC’s cobalt, Australia’s lithium, and South Africa’s platinum group metals — previously secondary resources — are becoming critical transition minerals.

Why It Matters
The next resource map will be drawn in lithium, cobalt, copper, and rare earths — not oil. Countries currently low on the fossil fuel ranking but rich in transition minerals are gaining structural economic leverage for the first time.

The energy transition is not just a climate story — it is the biggest geopolitical resource reshuffle since the oil era began.

The Invisible Resource: Freshwater

Water is the most undervalued resource on every ranking — and the one most threatened by climate change.

Brazil holds 12% of all global freshwater. Canada holds another 9%. As climate change tightens water availability across the Middle East, North Africa, and South Asia, freshwater will be reclassified from infrastructure to strategic resource — with profound implications for food security and geopolitics.

The countries with the most water today hold the most agricultural and economic leverage of 2050.

Macro Takeaway — 5 to 10 Year Outlook

Russia’s Resource Wealth Is Becoming a Liability

$75T in the ground means little if sanctions block access to capital and technology.

Russia’s resource wealth requires Western technology to extract and Western financial systems to monetize. Sanctions have structurally reduced the convertible value of that $75T. Resource wealth without institutional access is stranded wealth.

The DRC Is the Most Important Country Nobody Watches

$24T in transition minerals — right as demand for those minerals goes vertical.

Cobalt demand is projected to increase 19× by 2040. The DRC holds most of it. Chinese firms already control 15 of the DRC’s top 19 cobalt mines. Who controls DRC’s mineral extraction will shape who leads the clean energy transition.

The New Wealth Map Is Being Drawn Now

Transition minerals, freshwater, and arable land are the 21st century’s oil.

By 2035, lithium, cobalt, copper, nickel, and rare earths will rank alongside oil in geopolitical significance. The countries that diversify away from fossil-fuel wealth while securing transition mineral supply chains — Australia, Canada, Norway — are the best-positioned resource economies of the next generation.
Sources & Methodology
  • World Bank — The Changing Wealth of Nations 2024 (worldbank.org)
  • USGS — Mineral Resources Program: Global Reserves Data 2024 (usgs.gov)
  • Visual Capitalist — “Countries by Natural Resource Value” 2024
  • IMF — World Economic Outlook 2024 · Resource Revenue Analysis
  • UNDP — Human Development Index 2024 (hdr.undp.org)
  • BP — Statistical Review of World Energy 2024
  • IEA — Critical Minerals Market Review 2024
  • Global Witness — DRC Cobalt Mining Report 2024
Macro Discovery

Sukh Dhaliwal

Sukh Dhaliwal is the founder of Macro Discovery, an independent digital publication covering AI, technology, science, future trends, and global innovation through visual storytelling and data-driven analysis.

Join WhatsApp

Join Now

Join Facebook

Follow us

Leave a Comment