AI Tech Gaming Future Automobile Top 10 Space Innovation Trending How To Reviews Discover

---Advertisement---

Mapped: The Countries That Control the World’s Fresh Water

Macro Discovery
On: June 26, 2026 9:49 AM
Follow Us:
---Advertisement---
Mapped: The Countries That Control the World's Fresh Water
Mapped: The Countries That Control the World’s Fresh Water
The Countries That Control the World’s Fresh Water · MacroDiscovery
MacroDiscovery
Energy & Climate · 4 min read · 2024 Data
NOW → 2050 — Freshwater · Water Security · Geopolitics · Climate
Energy & Climate

The Countries That Control
the World’s Fresh Water

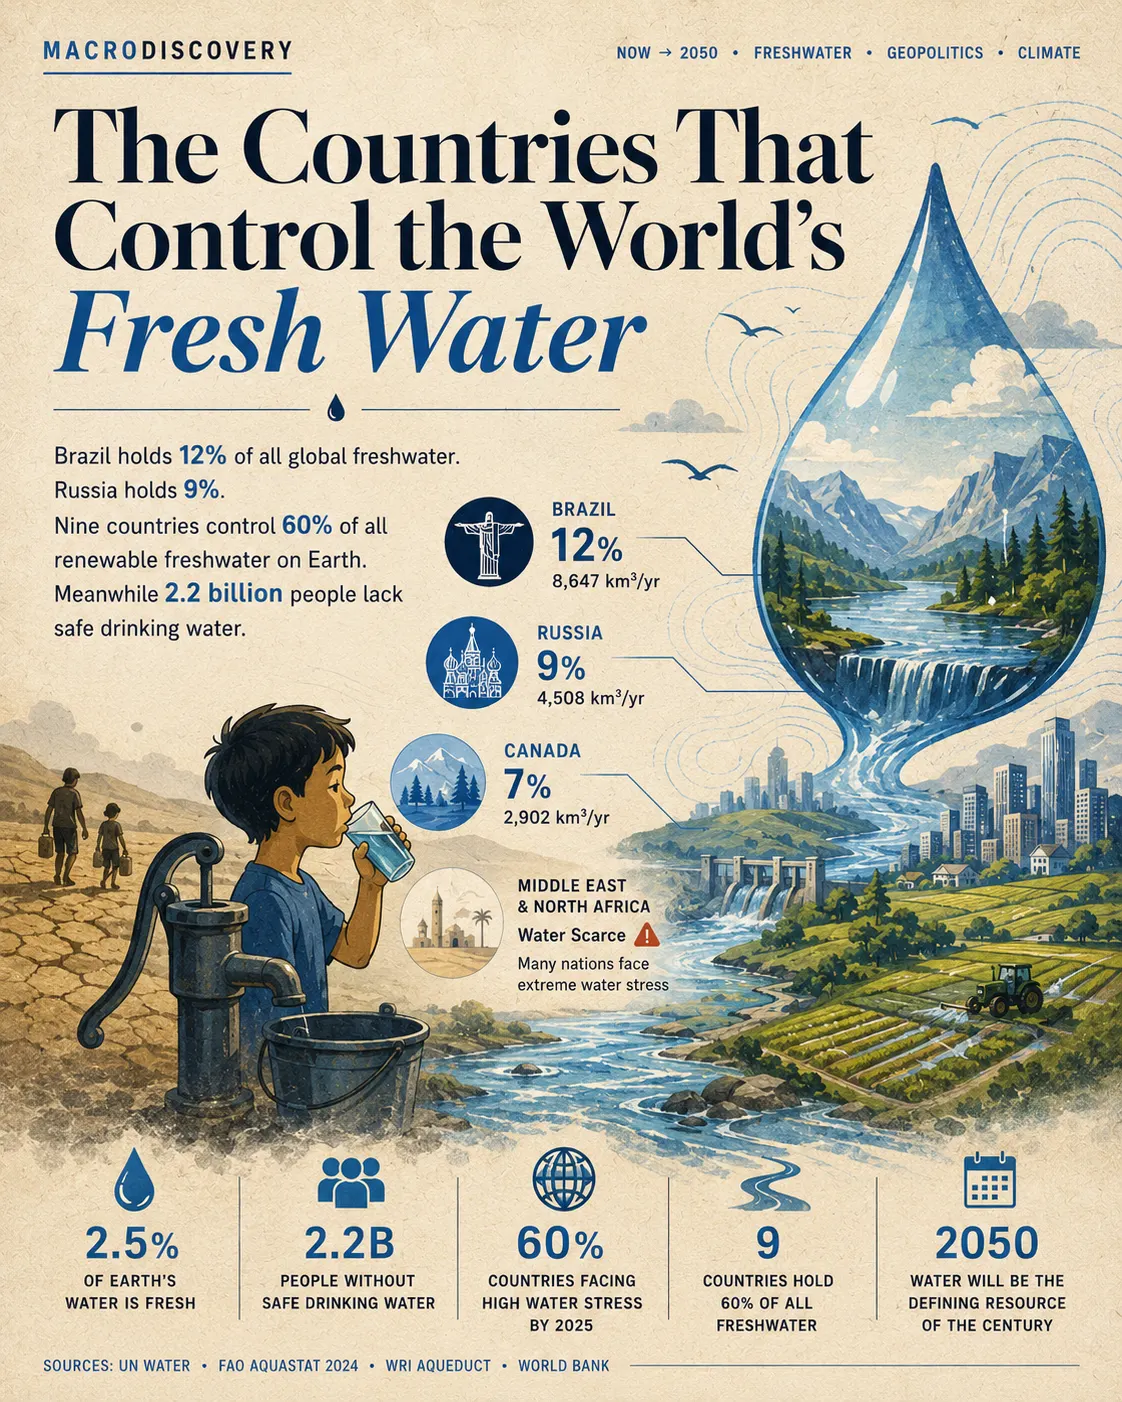
Brazil holds 12% of all global freshwater. Russia holds 9%. Nine countries control 60% of all renewable freshwater on Earth. Meanwhile 2.2 billion people lack safe drinking water — not because there isn’t enough, but because it is in the wrong places.

By MacroDiscovery
Sources: UN Water · FAO AQUASTAT · WRI Aqueduct · World Bank
Updated: 2024
2.5%
Of Earth’s water is fresh
12%
Brazil’s share of global freshwater
2.2B
People without safe drinking water
60%
Countries facing high water stress by 2025
9
Countries hold 60% of all freshwater
Visualization 01 — Global Freshwater Map
Renewable Internal Freshwater Resources by Country

Total renewable internal freshwater resources (rivers, lakes, groundwater). Darker blue = more freshwater. Near-white = water-scarce. Source: World Bank / FAO AQUASTAT 2024.

BRAZIL 12% · 8,647 km³ RUSSIA · 9% · 4,508 km³ CANADA · 7% 2,850 km³ USA · 5.6% CHINA · 5.4% COL PERU INDIA 4% · stressed Indonesia DRC Congo R. S.Africa N.AFRICA · arid Middle East · scarce Europe AUSTRALIA · arid interior ⚠ Extreme water stress Saudi, UAE, Qatar, Kuwait FRESHWATER RESOURCES Scarce Moderate Abundant (12%) Sources: FAO AQUASTAT · World Bank · UN Water 2024
Visualization 02 — Country Rankings
Top 15 Countries by Total Renewable Freshwater

Annual renewable internal freshwater resources in km³/year. Includes rivers, lakes, and groundwater recharge. Source: FAO AQUASTAT 2024, World Bank 2024.

01 🇧🇷Brazil
Amazon + major river systems
8,647 km³
per year
02 🇷🇺Russia
Yenisei, Lena, Ob river systems
4,508 km³
per year
03 🇨🇦Canada
Great Lakes, Mackenzie, St. Lawrence
2,902 km³
per year
04 🇺🇸United States
Mississippi, Colorado, Columbia
2,818 km³
per year
05 🇮🇩Indonesia
Tropical island hydrology
2,018 km³
per year
06 🇨🇳China
Yangtze, Yellow, Pearl — highly stressed
2,813 km³
per year
07 🇨🇴Colombia
Magdalena, Orinoco, Amazon tributaries
2,132 km³
per year
08 🇵🇪Peru
Amazon headwaters, Andes glaciers
1,913 km³
per year
09 🇮🇳India
Ganges, Brahmaputra — 1.4B people dependent
1,911 km³
per year
10 🇨🇩DR Congo
Congo River — 2nd largest by volume
1,283 km³
per year
11 🇻🇪Venezuela
Orinoco River basin
1,233 km³
per year
12 🇧🇩Bangladesh
Ganges-Brahmaputra delta
1,227 km³
per year
13 🇲🇲Myanmar
Irrawaddy, Salween rivers
1,168 km³
per year
14 🇦🇷Argentina
Paraná, Uruguay River systems
814 km³
per year
15 🇧🇴Bolivia
Amazon headwaters, Lake Titicaca
622 km³
per year
Visualization 03 — The Stress Divide
Water-Rich Nations vs. Water-Stressed Nations

Water stress = % of available renewable water withdrawn annually. Above 40% = high stress. Above 80% = extreme stress. Source: WRI Aqueduct 2024, FAO 2024.

⚠ High & Extreme Water Stress
🇰🇼 Kuwait
2,300%
🇦🇪 UAE
1,874%
🇸🇦 Saudi Arabia
943%
🇱🇾 Libya
728%
🇶🇦 Qatar
635%
🇮🇱 Israel
475%
🇮🇳 India
68%
🇨🇳 China
44%
🇺🇸 USA
32%

* % above 100 = withdrawals exceed renewable supply — sustained by fossil water or desalination

✓ Water Abundant — Low Stress
🇧🇷 Brazil
1.2%
🇨🇦 Canada
1.6%
🇳🇿 New Zealand
1.4%
🇷🇺 Russia
2.0%
🇳🇴 Norway
1.8%
🇨🇴 Colombia
0.9%
🇵🇪 Peru
1.5%
🇮🇩 Indonesia
4.2%
🇨🇩 DR Congo
0.02%

Low withdrawal % = most renewable water flows unused to the sea — abundance relative to consumption

Visualization 04 — River Basin Control
Who Controls the World’s Major River Systems

River systems cross borders — giving upstream nations leverage over downstream populations. These are the most geopolitically significant basins. Source: UN Water, Oregon State University Transboundary Freshwater Dispute Database 2024.

Amazon Basin
South America · 7 countries
7,000 km³
annual discharge · world’s largest
Brazil controls the outlet. Peru, Colombia, Ecuador, Bolivia, Venezuela, and Guyana share the headwaters. The Amazon discharges 20% of all freshwater entering the world’s oceans. Its deforestation directly reduces regional rainfall across South America.
⬇ Tension level: Low — Bolivia/Peru benefit from Brazil’s Amazon preservation
Mekong River
Southeast Asia · 6 countries
475 km³
annual discharge
China controls the headwaters in Tibet and has built 11 large dams, dramatically reducing downstream flow to Thailand, Laos, Cambodia, and Vietnam. Over 60 million people depend on the Mekong for fish protein and irrigation. China’s dams are the most contested water infrastructure on Earth.
⬆ Tension level: Extreme — China vs. lower-basin nations
Nile River
Northeast Africa · 11 countries
84 km³
annual discharge
Ethiopia controls the source. The Grand Ethiopian Renaissance Dam (GERD) — Africa’s largest dam — has fundamentally shifted power from Egypt, which has depended on Nile water for 5,000 years. Egypt has threatened military action over reduced flow. 104 million Egyptians depend on a river that starts in another country.
⬆ Tension level: Critical — Ethiopia vs. Egypt/Sudan
Indus River
South Asia · India, Pakistan
207 km³
annual discharge
India controls upper tributaries. The 1960 Indus Waters Treaty — one of the world’s most successful transboundary water agreements — allocates rivers between India and Pakistan. But climate change is melting Himalayan glaciers that feed the system, threatening the treaty’s assumptions about water availability.
◆ Tension level: High — treaty under climate stress
Tigris & Euphrates
Middle East · Turkey, Syria, Iraq
77 km³
annual discharge (declining)
Turkey controls the headwaters via the GAP dam system — 22 dams reducing flow by 80% to Syria and Iraq. Iraq’s Mesopotamia — the “cradle of civilisation” — is experiencing its worst water crisis in recorded history. The Tigris and Euphrates are both in terminal decline from upstream extraction and climate change.
⬆ Tension level: Critical — Iraq existential crisis
Colorado River
North America · USA, Mexico
20 km³
annual discharge (historical)
The Colorado no longer reaches the sea. 100% of the river is withdrawn before it crosses into Mexico — a 1944 treaty violation in practice. Lake Mead and Lake Powell dropped to record lows in 2022. The American West’s water crisis is a preview of what freshwater scarcity looks like in wealthy nations.
⬆ Tension level: High — US internal + US-Mexico dispute

The Abundance Paradox

Earth has plenty of freshwater — it is just catastrophically unevenly distributed.

Only 2.5% of Earth’s water is fresh. Of that, 69% is locked in glaciers and ice caps. Another 30% is groundwater — much of it non-renewable fossil water pumped from ancient aquifers. Just 0.3% of all freshwater is accessible in rivers and lakes.

  • Brazil alone holds more renewable freshwater than the entire Middle East and North Africa combined.
  • Kuwait and UAE withdraw more water than nature replenishes — sustained entirely by desalination and fossil aquifer depletion.
  • The DRC holds vast freshwater wealth but lacks the infrastructure to deliver safe water to its population.
Key Insight
The global water crisis is not a supply problem — it is a distribution, infrastructure, and governance problem. The countries with the least water are not the poorest; they are often the richest. Saudi Arabia runs on desalinated seawater and ancient fossil aquifers it cannot refill.

Water scarcity and water poverty are different problems requiring different solutions.

Upstream Power — The New Geopolitics

Who controls the source of a river controls the downstream nation’s food supply, economy, and political leverage.

The Nile, Mekong, Tigris-Euphrates, and Indus are all cases where upstream dam construction has become an act of geopolitical power. China’s Mekong dams reduced downstream flow enough to trigger crop failures in Vietnam and Thailand. Ethiopia’s GERD dam has put Egypt’s 104 million people on permanent water security alert.

Why It Matters
Of the world’s 310 international river basins, only 60 have cooperative management agreements. The other 250 are governed by power dynamics alone — meaning upstream nations can, and increasingly do, use water as silent economic coercion without firing a shot.

Water is already a weapon — it just hasn’t been formally declared one yet.

Climate Change Is Reshuffling the Map

Glaciers that feed major rivers are melting — turning water-secure nations into water-stressed ones within decades.

  • Himalayan glaciers supply freshwater to 1.9 billion people in South and East Asia. They are projected to lose 65% of their mass by 2100 under high-emission scenarios.
  • Andean glaciers supply drinking water to Lima (10 million people) and La Paz. Both cities face existential water supply crises by 2050.
  • The US Southwest is entering a megadrought — the worst in 1,200 years — driven by reduced snowpack and rising evaporation.

Countries currently water-secure due to glacier melt are borrowing time — not enjoying permanence.

Macro Takeaway — 5 to 10 Year Outlook

Water Will Price Into Global Markets

California already trades water futures. The rest of the world is five to ten years behind.

In 2020, the Chicago Mercantile Exchange launched water futures contracts for California water rights. As scarcity intensifies, water will be valued as a commodity — with all the speculation, hoarding, and geopolitical leverage that implies for food-importing nations.

Brazil Becomes a Water Superpower

The Amazon is to the 21st century what the Persian Gulf was to the 20th.

Brazil’s position — holding 12% of global freshwater, 60% of the Amazon, and the world’s largest arable land expansion potential — gives it structural leverage that will compound as water stress intensifies globally. The strategic value of Amazon preservation is not yet priced into geopolitical calculations.

The Nile and Mekong Will Define Regional Orders

Two river systems — and who controls them — will shape geopolitics across Africa and Southeast Asia.

Ethiopia’s GERD dam and China’s Mekong dams are the first cases of freshwater used as systematic geopolitical leverage in the 21st century. Neither dispute has a legal resolution mechanism with enforcement power. By 2030, both will have escalated further — making water the defining conflict variable in two of the world’s most populous regions.
Sources & Methodology
  • FAO AQUASTAT — Global Freshwater Resources Database 2024 (fao.org/aquastat)
  • World Resources Institute — Aqueduct Water Risk Atlas 2024 (wri.org/aqueduct)
  • UN Water — World Water Development Report 2024 (unwater.org)
  • World Bank — Water Scarcity Data 2024 (worldbank.org)
  • Oregon State University — Transboundary Freshwater Dispute Database 2024
  • IPCC — Sixth Assessment Report: Water Chapter 2023
  • Nature — “Himalayan glacier mass loss accelerating” 2023
  • US Drought Monitor / NOAA — Western US Megadrought Data 2024
Macro Discovery

Sukh Dhaliwal

Sukh Dhaliwal is the founder of Macro Discovery, an independent digital publication covering AI, technology, science, future trends, and global innovation through visual storytelling and data-driven analysis.

Join WhatsApp

Join Now

Join Facebook

Follow us

Leave a Comment