
the Most Renewable Energy
The 20 Countries Generating
the Most Renewable Energy
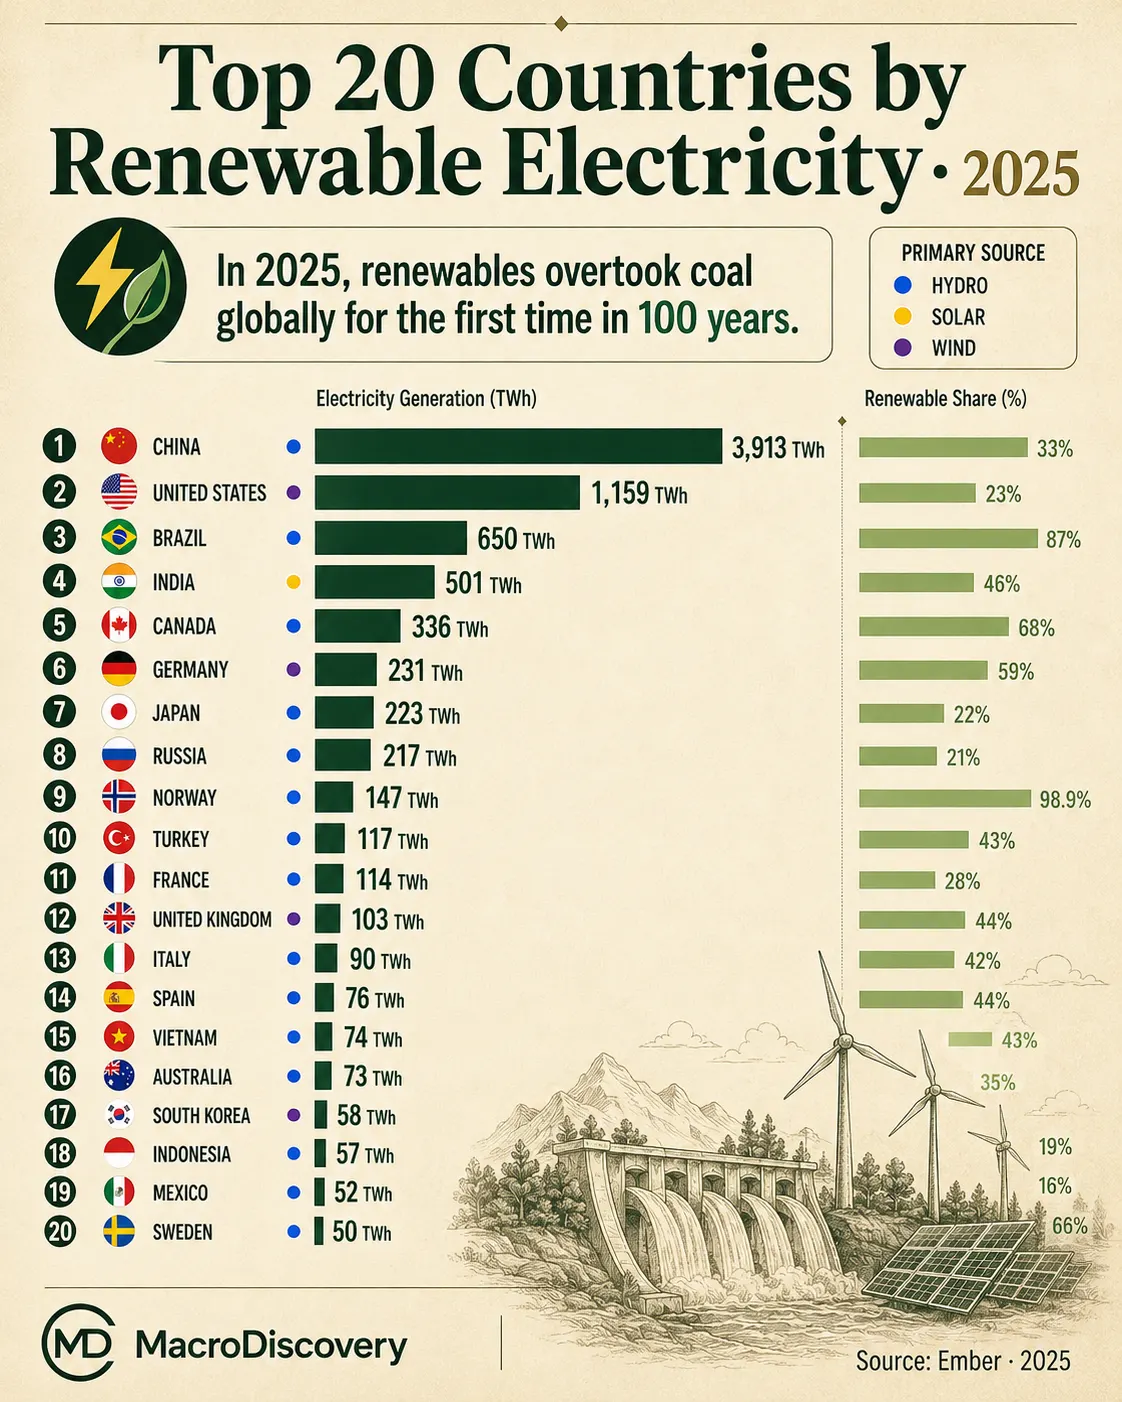
China generates more renewable electricity than the next four countries combined. Norway runs on 98.9% renewables — but ranks 10th by volume. Brazil is the cleanest large grid on earth. And in 2025, for the first time in 100 years, renewables overtook coal in the global electricity mix.
For the first time since the early 20th century, more electricity on earth comes from renewable sources than from coal. That milestone was crossed in 2025 — driven almost entirely by an explosion in solar power and a continued expansion of wind. But the distribution of where that clean electricity comes from is striking, concentrated, and deeply shaped by geography, policy, and the availability of rivers.
- China generated 3,913 TWh of renewable electricity in 2025 — about 36.5% of all renewable electricity generated on earth. It leads the next four countries combined. Its wind and solar output alone (2,310 TWh) exceeds the US’s entire renewable total.
- Norway generates 98.9% of its electricity from renewables — almost all of it hydro — but ranks 10th globally by volume. This is the key distinction: share and volume tell very different stories.
- Brazil generates 86.6% of its electricity from renewables — the highest share of any G20 country, nearly triple the global average. Its carbon intensity (103 gCO₂/kWh) is one of the world’s lowest.
- Pakistan ranks 18th with 82.9 TWh — powered mostly by the Indus River hydro system — ahead of Australia. A country most people would not expect to see near the top of this list.
- Solar overtook wind globally in 2025 for the first time — generating 2,778 TWh against wind’s 2,711 TWh. Solar has doubled every three years since 2016 and shows no signs of slowing.
| # | Country | Total (TWh) | Renew. Share | Primary Source | Largest Single Source |
|---|---|---|---|---|---|
| 1 | 🇨🇳China |
3,912.7 | ⚡ Mixed | Hydro 1,396 · Solar 1,175 · Wind 1,135 TWh | |
| 2 | 🇺🇸United States |
1,158.8 | 💨 Wind | Wind 464 · Solar 389 · Hydro 242 TWh | |
| 3 | 🇧🇷Brazil |
650.0 | 💧 Hydro | Hydro 389 · Wind 118 · Solar 89 TWh | |
| 4 | 🇮🇳India |
501.0 | ☀️ Solar | Solar 196 · Hydro 178 · Wind 104 TWh | |
| 5 | 🇨🇦Canada |
416.8 | 💧 Hydro | Hydro 345 · Wind 51 · Solar 10 TWh | |
| 6 | 🇩🇪Germany |
295.7 | 💨 Wind | Wind 136 · Solar 90 · Bio 51 TWh | |
| 7 | 🇯🇵Japan |
242.7 | ☀️ Solar | Solar 101 · Hydro 74 · Bio 55 TWh | |
| 8 | 🇷🇺Russia |
207.0 | 💧 Hydro | Hydro 200 (97% of Russia’s renewables) | |
| 9 | 🇪🇸Spain |
160.8 | ⚡ Mixed | Wind 59 · Solar 63 · Hydro 33 TWh | |
| 10 | 🇳🇴Norway |
159.2 | 💧 Hydro | Hydro 145 · Wind 14 TWh | |
| 11 | 🇹🇷Turkey |
153.1 | ⚡ Mixed | Hydro 57 · Wind 39 · Solar 37 TWh | |
| 12 | 🇬🇧United Kingdom |
151.9 | 💨 Wind | Wind 86 · Bio 41 · Solar 19 TWh | |
| 13 | 🇫🇷France |
148.8 | ⚡ Mixed | Hydro 59 · Wind 46 · Solar 32 TWh | |
| 14 | 🇻🇳Vietnam |
140.8 | 💧 Hydro | Hydro 102 · Solar 23 · Wind 14 TWh | |
| 15 | 🇮🇹Italy |
129.1 | ☀️ Solar | Solar 45 · Hydro 42 · Wind 21 TWh | |
| 16 | 🇸🇪Sweden |
121.5 | 💧 Hydro | Hydro 68 · Wind 39 · Bio 10 TWh | |
| 17 | 🇦🇺Australia |
110.6 | ☀️ Solar | Solar 56 · Wind 39 · Hydro 12 TWh | |
| 18 | 🇵🇰Pakistan |
82.9 | 💧 Hydro | Hydro 41 · Solar 37 · Wind 4 TWh | |
| 19 | 🇲🇽Mexico |
82.4 | ⚡ Mixed | Hydro 29 · Solar 26 · Wind 21 TWh | |
| 20 | 🇻🇪Venezuela |
73.0 | 💧 Hydro | Hydro 73 (virtually 100% of renewables) |
Source: Ember Yearly Electricity Data (2025) via Wikipedia “List of countries by renewable electricity production” (retrieved June 2026). Data year: 2025 for all countries except Venezuela (2024, latest available). Click column headers to sort. Renewable share = share of total national electricity generation from renewable sources.
Renewable electricity only — excludes renewable heat (solar thermal, geothermal heat) and biofuel for transport. “TWh” = terawatt-hours. Share column shows what fraction of each country’s total electricity comes from renewables, regardless of volume.
China Is in a Category of Its Own
China generated 3,913 TWh of renewable electricity in 2025 — more than the United States, Brazil, India, and Canada combined. Its wind and solar output alone, at 2,310 TWh, exceeds the entire renewable total of the second-ranked US. This is not just scale — it is the rate of change. In 2024, 53% of all new solar generation globally came from China. Its clean electricity growth met 81% of its own demand increase in 2024. China’s hydropower capacity of 340 GW is the largest in the world. Its wind capacity of 342 GW is the largest in the world. Its solar capacity crossed 2 terawatts globally in 2024 — doubling in just two years — with China accounting for the majority of that build.
And yet China’s renewable share is only 37%. It generates so much electricity in total — over 10,000 TWh — that even its enormous renewable output does not dominate its grid. Coal still powers about 58% of Chinese electricity, though that share is falling. The transition is happening at a scale that simply has no historical comparison.
Brazil: The World’s Cleanest Large Grid
Brazil generated 650 TWh of renewable electricity in 2025 with an 86.6% renewable share — the highest of any G20 country and nearly triple the global average of 33.8%. Its carbon intensity of 103 gCO₂/kWh is the second-lowest in the G20, after France. Brazil burns fossil fuels for barely 10% of its electricity — compared to a global average of 59%.
The foundation is the Amazon basin’s vast hydroelectric infrastructure, which still supplies about 60% of the country’s electricity. But the growth story is wind and solar. In 2016, wind and solar contributed just 5.8% of Brazilian electricity. By 2025, that share had reached 24% — one of the fastest expansions of variable renewables in any large economy. The northeast of Brazil — dry, flat, windy, and sunny — has become one of the most attractive renewable energy regions on earth. Brazil is proof that a continent-sized economy can run almost entirely on clean electricity. Its challenge is that its clean power depends heavily on rainfall. The drought of 2024 caused hydro output to fall 3.2%, forcing more gas into the mix — a reminder of the vulnerability of hydro-dependent grids to a changing climate.
Norway, Pakistan, and Venezuela: The Hydro Outliers
Three countries in this list illustrate something that volume rankings hide: hydropower is geographically locked. Norway, with 98.9% renewable electricity and 160 TWh, built its grid almost entirely on the steep rivers of its fjords over a century ago. It has barely needed to build anything since. Its challenge now is exporting surplus power to neighbours and managing a grid increasingly dependent on weather-sensitive reservoirs.
Pakistan at #18 is the genuine surprise. With 82.9 TWh and a 46.8% renewable share — powered mostly by the Indus River system — Pakistan generates more renewable electricity than Colombia, Indonesia, or South Korea. A country facing severe power sector challenges and frequent blackouts nonetheless runs a grid that is nearly half renewable, almost entirely because its major rivers predate any energy policy discussion.
Venezuela at #20 tells the saddest version of this story. Its Guri Dam and the Orinoco basin supply essentially all 73 TWh of its renewable electricity — 91.1% of the national grid. But years of economic collapse and neglect have left the system fragile. Venezuela sits near the top of the renewable share ranking not because of clean energy policy, but because its oil-fired alternatives have deteriorated faster than its dams.
India’s Solar Revolution — and the Race to Come
India ranks fourth with 501 TWh, and for the first time in 2025, solar overtook hydro as India’s largest renewable source — generating 196 TWh against hydro’s 178 TWh. India installed more new solar capacity than the United States in 2025, according to Ember’s Global Electricity Review 2026. The IEA forecasts India’s annual renewable capacity additions will more than quadruple from 15 GW in 2023 to over 62 GW by 2030.
India’s renewable share is still only 24% — the country burns coal for 75% of its electricity, driven by surging industrial demand and a population adding the equivalent of a mid-sized European country to its urban workforce every decade. But the direction is clear. India added more clean electricity in 2024 and 2025 than its demand growth required — meaning fossil generation fell even as the economy grew. That is the threshold that matters: the moment renewables grow faster than demand, the fossil share starts shrinking automatically, without anyone being asked to use less energy.
Solar Overtook Wind — and Will Overtake Nuclear Next
In 2025, solar generated 2,778 TWh globally — more than wind’s 2,711 TWh — for the first time in history. Solar has doubled approximately every three years since 2016. Global solar capacity crossed 1 terawatt in 2022. It reached 2 terawatts in 2024 — in just two years. The IEA forecasts nuclear will be surpassed by both solar and wind before 2026 ends.
The technology driving this is photovoltaic panels whose cost has fallen more than 90% since 2010. A solar panel that cost $76 per watt in 1977 now costs less than $0.20 per watt. Battery storage costs fell 20% in 2024 and a further 45% in 2025, according to Ember, with deployment growing 46%. The economics of clean electricity are no longer a policy question. They are an engineering and logistics question. The remaining challenge is not whether to build solar and wind — it is how fast grids can be upgraded to absorb the power those sources generate.
- Wikipedia — “List of countries by renewable electricity production” (citing Ember Yearly Electricity Data · 2025 · directly fetched and verified)
- Ember — Global Electricity Review 2025 (data year 2024 · renewable additions record 858 TWh · solar +29%)
- Ember — Global Electricity Review 2026 (data year 2025 · renewables overtook coal 33.8% vs 33.0% · solar overtook wind)
- IEA — Renewables 2025: Renewable Electricity chapter (9,900 TWh in 2024 · forecast 16,200 TWh by 2030)
- Ember — Global Electricity Review 2025: Brazil country profile (87% renewable share · 86.6% confirmed · 103 gCO₂/kWh)
- IEA — Renewables 2024: Electricity (India capacity to quadruple 2023–2030 · US additions double · global capacity data)
- IRENA — Renewable Energy Statistics 2024 (capacity data · hydropower, solar, wind by country)
- StatRanker — “Top 100 Countries by Share of Renewable Energy” (Norway 98.9%, Iceland ~100%, share rankings)













From the very first click, I knew this platform would treat me like a valued guest rather than just another username. The promotions roll in like good surprises and the gameplay never drags. My daily dose of entertainment and genuine chill vibes. bda71com