
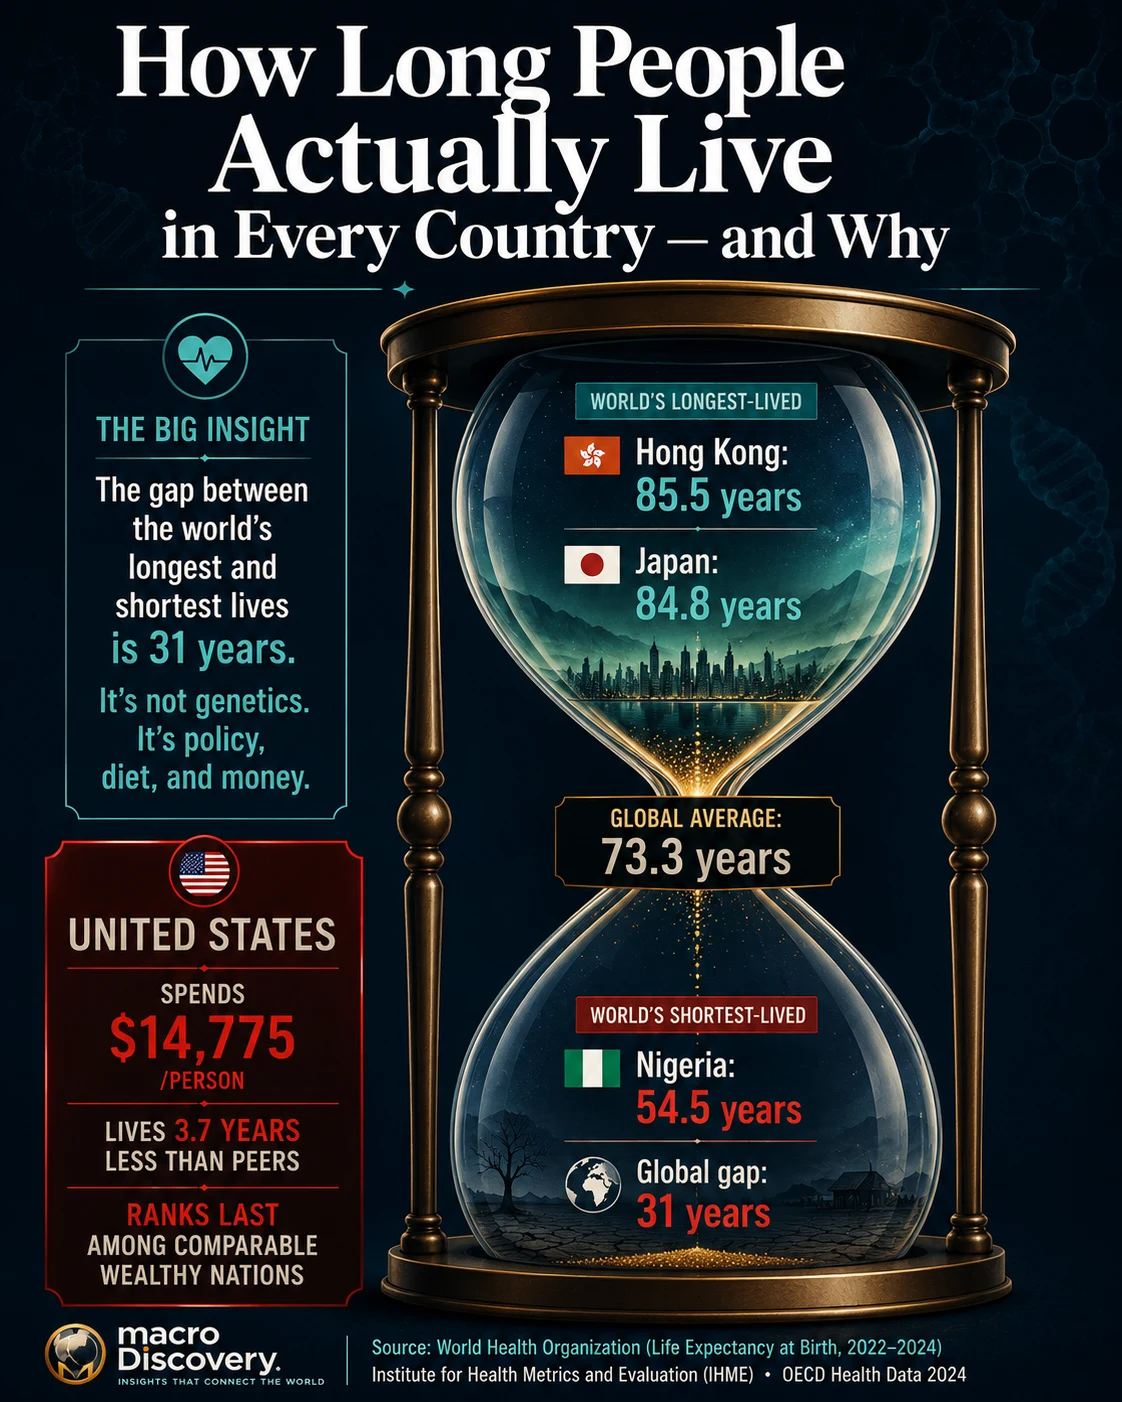
How Long People Actually Live
in Every Country — and Why
Hong Kong has the world’s highest life expectancy at 85.5 years. Nigeria has the lowest at 54.5. That is a 31-year gap between two people born on the same day in different countries. The United States spends $14,775 per person on healthcare — nearly twice the average of comparable wealthy nations — yet lives 3.7 years less. And in 1900, no country on earth had an average life expectancy above 50. The data behind how long we live is the data behind everything that matters.
- A 31-year gap separates the world’s longest- and shortest-lived populations. Hong Kong SAR’s average life expectancy of 85.5 years sits 31 years above Nigeria’s 54.5. That gap is not genetic — it is structural. Healthcare access, income, nutrition, conflict, and public health infrastructure determine whether you live into your 80s or are unlikely to reach 60.
- Japan was the first nation to reach an average life expectancy of 80 years, in 1996. By 2012, all comparable wealthy nations had crossed that threshold — except the United States, which stood at 78.5 that year. In 2024, US life expectancy reached a record high of 79.0 years. The average for comparable wealthy nations was 82.7 — a gap of 3.7 years. Every single US state has a life expectancy below the average of the comparable country group.
- The US spends $14,775 per person per year on healthcare — nearly $5,000 more than Switzerland, the next highest spender, and nearly twice the comparable country average. Despite this, the US ranks last in life expectancy among comparable wealthy OECD nations for both men and women. The causes of the gap are not clinical — they are structural: obesity, opioid overdoses, gun violence, traffic fatalities, and unequal access to preventive care.
- Hong Kong’s life expectancy lead is explained by a specific combination: government-subsidised hospital care that is essentially free, a diet low in fat and high in fish and vegetables, very low obesity rates, a walking-dominant urban environment, and high per-capita income. Its ~11,575 centenarians (2021) constitute one of the largest populations of people over 100 on earth. By 2050, Hong Kong is projected to reach an average of 89 years — the first territory to do so.
- Globally, women outlive men by an average of 5 years — 76 vs 71 years (2024). Rwanda’s life expectancy fell to approximately 33 years during the 1994 genocide and has since recovered to approximately 70 years — one of the most dramatic improvements in recorded human history. COVID-19 cut global average life expectancy from 73.1 years (2019) to 71.4 years (2021), reversing years of progress in two years. The 2024 figure of 73.3 years shows full numerical recovery, though the underlying health impacts of COVID persist.
Sources: UNDP Human Development Report 2025 statistical annex (primary · directly confirmed · data 2023) for Hong Kong, Switzerland, Australia, Norway, Sweden. UN World Population Prospects 2024 Revision (primary) via StatRanker, worldpopulationreview, and Wikipedia for all other rankings. US: CDC National Center for Health Statistics 2024 data via Peterson-KFF Health System Tracker (March 31, 2026 · directly confirmed). Monaco (86.5) and San Marino (85.8) have higher life expectancies than Hong Kong but are micro-states with populations under 40,000. South Korea and Singapore figures are approximate from multiple UN WPP 2024-based sources. Italy/Spain approximate. Bar lengths are proportional within the chart.
| # | Country / Territory | Life Expectancy | Women | Region | Category | Key factor |
|---|---|---|---|---|---|---|
| 1 | 🇭🇰Hong Kong SAR | 85.5 | ~88 | East Asia | World Leader | Free hospital care, low obesity, fish-heavy diet, walking culture. ~11,575 centenarians (2021). |
| 2 | 🇯🇵Japan | 84.8 | ~88 | East Asia | World Leader | First nation to reach avg 80 yrs (1996). Low red meat, high fish, green tea, low obesity, universal healthcare. |
| 3 | 🇨🇭Switzerland | 84.0 | ~86 | Western Europe | World Leader | High income, universal healthcare (insurance-based), Alpine active lifestyle, clean environment. |
| 4 | 🇦🇺Australia | 83.9 | ~86 | Oceania | World Leader | Universal healthcare (Medicare), outdoor lifestyle, low infectious disease burden. |
| 5 | 🇸🇬Singapore | ~83–84 | ~86 | Southeast Asia | World Leader | Medisave system, preventive care emphasis, low obesity, dense walkable city. Strong chronic disease management. |
| 6 | 🇳🇴Norway | 83.3 | ~85 | Northern Europe | Very High | Universal healthcare, high income, compressed inequality, active outdoor culture. |
| 7 | 🇸🇪Sweden | 83.3 | ~85 | Northern Europe | Very High | Universal healthcare, strong preventive care. Sweden’s PHDI improves when ecological sustainability factored in. |
| 8 | 🇮🇹Italy | ~83 | ~86 | Southern Europe | Very High | Mediterranean diet (olive oil, fish, vegetables, legumes), strong family social bonds, universal healthcare. |
| 9 | 🇪🇸Spain | ~83 | ~86 | Southern Europe | Very High | Mediterranean diet, afternoon rest culture (siesta), strong social connections, universal healthcare. |
| ~18 | 🇺🇸United States | 79.0 | 81.4 | North America | Last among peers | Record high 2024 · Ranks last among comparable wealthy OECD nations · Spends $14,775/person on healthcare. Gap driven by overdoses, obesity, guns, chronic disease, unequal access. |
| ~ | 🌍Global Average | 73.3 | 76 | All regions | Global avg 2024 | UN WPP 2024. Up from 71.4 (2021 COVID dip). Projected 73.5 in 2025. |
| ~last | 🇨🇫Cent. African Rep. | 57.7 | ~60 | Sub-Saharan Africa | Critical | Persistent conflict, extreme poverty, limited healthcare. Still improving from lower baselines. |
| ~last | 🇹🇩Chad | 55.2 | ~56 | Sub-Saharan Africa | Critical | High child mortality, malnutrition, conflict. Landlocked with limited health infrastructure. |
| Last | 🇳🇬Nigeria | 54.5 | ~56 | Sub-Saharan Africa | Lowest sovereign | World’s lowest for a sovereign nation. High infectious disease, malnutrition, insecurity, very limited healthcare access across 220M+ population. |
Sources: UNDP Human Development Report 2025 statistical annex (primary · directly confirmed · data year 2023) for Hong Kong, Switzerland, Australia, Norway, Sweden. UN World Population Prospects 2024 Revision (primary) for all other countries. US: CDC NCHS via Peterson-KFF Health System Tracker (March 31, 2026 · primary directly confirmed · data year 2024). Women’s figures are approximate from UN WPP 2024 (female life expectancy typically runs 4-6 years above total). South Korea and Singapore approximate. Ranks are approximate as multiple countries cluster closely. Click headers to sort.
Why Does Hong Kong Have the World’s Highest Life Expectancy?
Hong Kong SAR recorded a life expectancy of 85.5 years in the UNDP Human Development Report 2025 — the highest figure of any major territory in the world’s most authoritative human development dataset. Among its female population, the figure reaches approximately 88 years. The territory had approximately 11,575 centenarians in 2021 — an extraordinary concentration of people over 100 for a population of 7.5 million.
A 2025 peer-reviewed study in PMC identifying the determinants of Hong Kong’s longevity pointed to a specific combination of factors. The public hospital system is modelled on the UK’s National Health Service and provides essentially free or heavily subsidised hospital care — ensuring that serious illness does not go untreated due to financial barriers. The diet is traditionally low in saturated fat and high in fish, vegetables, and plant proteins. Obesity rates are very low. The dense, walkable urban environment means that most residents walk substantially more per day than populations in car-dependent cities. And per-capita income is high, providing the material foundations — clean water, safe food, stable shelter — that underpin longevity.
The PMC study noted a striking finding: Japan, South Korea, and Singapore — all of which have insurance-based rather than NHS-style healthcare — have higher life expectancies than the UK. The United States also has an insurance-based system, but much lower life expectancy than the Asian peers. This suggests that the type of healthcare system matters less than its actual coverage of the population, the quality of preventive care, and the social determinants of health — diet, activity, inequality — that surround it.
Why Did Japan Lead the World in Longevity for So Long — and What Can Other Countries Learn?
Japan was the first nation in history to record an average life expectancy of 80 years, achieving this milestone in 1996. By 2012, all comparable wealthy nations had also crossed the 80-year threshold — with one notable exception: the United States, which stood at 78.5 years that year. Japan’s lead reflects decades of improvement in specific causes of death that other nations have not matched as completely.
A peer-reviewed paper in NIH’s PMC — “Why has Japan become the world’s most long-lived country: insights from a food and nutrition perspective” — identified the dietary transition as central. Japan’s very low rates of ischemic heart disease and cancer correlate with low obesity, low red meat consumption, low saturated fat intake, high fish consumption (providing omega-3 polyunsaturated fatty acids), and high intake of plant foods including soybeans. The dramatic reduction in salt intake over recent decades reduced blood pressure across the population, driving down cerebrovascular disease and stomach cancer simultaneously. Japan demonstrates that population-level dietary shifts — achieved through culture, food policy, and education — can produce measurable longevity gains across an entire nation.
Italy and Spain occupy similar positions in European longevity rankings for related reasons. Both countries maintain Mediterranean dietary patterns — high in olive oil, fish, vegetables, whole grains, and legumes — with lower saturated fat and processed food consumption than Northern European or North American peers. Spain’s projected life expectancy for 2050-2055 is 87.6 years, nearly identical to Japan’s 88.5 — suggesting that diet-driven longevity gains are not uniquely Asian but reflect shared dietary principles present in both traditions.
Why Does the United States Spend More on Healthcare Than Any Other Country Yet Live Shorter Lives?
The US healthcare paradox is one of the most studied and most consequential anomalies in global public health. In 2024, the United States spent approximately $14,775 per person on healthcare — nearly $5,000 more than Switzerland, the next highest spender, and nearly twice the average of comparable wealthy nations. Despite this, US life expectancy reached only 79.0 years — 3.7 years below the comparable country average of 82.7 years. Every single US state has a life expectancy below that average, according to Peterson-KFF’s 2026 analysis. The US ranks last in life expectancy among comparable wealthy OECD nations for both men and women.
In 1980, the US had similar life expectancy and similar relative healthcare spending to its peer group. The divergence grew steadily over 40 years and was accelerated by COVID-19, which hit the US harder and for longer than most peer countries. The causes of the gap are now well-documented: higher chronic disease burden (diabetes, kidney disease, liver disease), higher rates of drug overdose deaths, higher gun violence and homicide rates, higher traffic fatality rates, obesity, racial and geographic health disparities, and the absence of universal healthcare coverage that leaves preventive care inaccessible for many Americans.
The critical insight from Our World in Data’s analysis is that the gap is primarily about prevention, not treatment. The US excels at advanced clinical care — its cancer treatment outcomes, cardiac interventions, and surgical capabilities are among the world’s best. What it fails at is preventing people from needing those treatments in the first place. Smoking rates are now lower in the US than in many peers, but obesity, overdose mortality, and gun deaths are substantially higher. These are not primarily healthcare failures — they are public health, social policy, and economic inequality failures that manifest as shorter lives.
Next highest spending: Switzerland — approximately $9,800 per capita.
Comparable country average: approximately $7,775 per capita.
US life expectancy 2024: 79.0 years — its all-time record high, up from 78.4 in 2023.
Comparable country average: 82.7 years — gap of 3.7 years.
Japan’s life expectancy: 84.8 years — achieved at roughly $4,800 per capita spending.
All 50 US states have life expectancy below the comparable country average as of the latest data.
In 1980: US had similar life expectancy AND similar relative spending to peers. The gap opened over 40 years.
Primary causes: drug overdoses, obesity, gun violence, chronic disease, unequal healthcare access.
Source: Peterson-KFF Health System Tracker (primary · March 31, 2026 · directly confirmed).
Why Is Life Expectancy So Low Across Sub-Saharan Africa — and Is It Improving?
Sub-Saharan Africa has the world’s lowest average life expectancy of any region. Nigeria at 54.5 years, Chad at 55.2, and the Central African Republic at 57.7 anchor the bottom of global rankings. The causes are structural and interacting: very high rates of communicable diseases — HIV/AIDS, malaria, tuberculosis — that still kill large numbers of people before old age; high child and infant mortality that suppresses the average even when adult survival rates are improving; persistent conflict that disrupts healthcare systems and forces population displacement; and poverty that limits access to clean water, nutrition, and medical care.
But the trend direction matters: most of sub-Saharan Africa is improving, not declining. The HIV/AIDS treatment rollout from the mid-2000s onward — funded in part by PEPFAR and the Global Fund — reversed what had been a catastrophic decline in life expectancy in Southern and Eastern Africa. Countries including Botswana, Zimbabwe, and Zambia lost more than a decade of life expectancy to HIV/AIDS in the 1990s and have partially recovered as antiretroviral therapy became accessible. Rwanda’s recovery from the genocide of 1994 is the most dramatic longevity improvement in recorded human history. Life expectancy fell to approximately 33 years during the genocide as mass killing erased a significant proportion of the adult population. By 2024, Rwanda’s life expectancy had recovered to approximately 70 years — reflecting both demographic recovery and substantial investments in healthcare and public health infrastructure over 30 years.
The structural challenge in sub-Saharan Africa is that improvements in child survival — which push average life expectancy upward rapidly — must eventually be paired with improvements in adult chronic disease management as populations age. The transition from infectious to non-communicable disease as the primary cause of premature death is already beginning in middle-income African nations, and it requires a fundamentally different healthcare infrastructure.
How Much of a Lifetime Is Spent in Good Health — and What Is Healthy Life Expectancy?
Life expectancy at birth measures how long people live. Healthy Life Expectancy (HALE) measures how long they live in good health — without significant disability, chronic pain, or debilitating illness. The global HALE in 2025 is estimated at 63.7 years, according to WHO data, against a total life expectancy of approximately 73.5 years. That means the average person worldwide spends roughly 10 years of their life in poor health at the end — a decade in which they are alive but not fully well.
The HALE gap varies dramatically by country. In high-income nations with strong preventive care systems, the gap between total life expectancy and healthy life expectancy can be as small as 8-10 years. In countries with high chronic disease burdens or poorly managed non-communicable diseases, it can exceed 15 years. Japan has worked to extend not just life but healthy life, with a national policy focus on reducing the period of dependency at the end of life. This has become increasingly important as Japan’s population ages dramatically — by 2030, Japan will be the world’s oldest society, and the economic and social cost of those final years of poor health is a central policy challenge.
By 2050, the UN projects that the global population aged 65 or older will reach 17% — up from 10% in 2022. Hong Kong is projected to reach an average life expectancy of 89.2 years, Japan 88.5, Switzerland 87.8, and Singapore 87.6 by 2050-2055. These figures assume continued healthcare improvement and assume that the diseases of aging — dementia, cardiovascular disease, cancer — continue to be pushed back by medical progress. Whether HALE keeps pace with total life expectancy will be one of the defining questions of the next generation of global health policy.
- Peterson-KFF Health System Tracker — “How does U.S. life expectancy compare to other countries?” (March 31, 2026 · primary · directly fetched · US 79.0 yrs 2024 · peer avg 82.7 · US $14,775/capita · gap 3.7 yrs · all 50 states below peer avg · causes)
- UNDP — HDR 2025 Statistical Annex: HDI Table (primary · directly confirmed · Hong Kong 85.5 yrs · Switzerland 84.0 · Australia 83.9 · Norway 83.3 · Sweden 83.3 · data year 2023)
- StatRanker — “Top 100 Countries by Life Expectancy 2025 · UN WPP 2024 estimates” (April 2026 · complete ranking · global average 73.3 yrs · COVID trajectory · health spending scatter)
- WorldPopulationReview — “Life Expectancy by Country 2026” (UN/World Bank data · Monaco 86.5 · San Marino 85.8 · HK 85.6 · Nigeria 54.6 · global 73.8 · 2026 updated)
- PMC — “Non-Communicable Diseases, Longevity, and Health Span: A Hong Kong Perspective” (March 2025 · Hong Kong free hospital care · 11,575 centenarians 2021 · comparison with UK/Japan/Singapore/US systems)
- PMC / NIH — “Why has Japan become the world’s most long-lived country: insights from a food and nutrition perspective” (2021 · Japan diet factors · low red meat · high fish · green tea · salt reduction → cerebrovascular gains)
- KFF — “International Comparison of Health Systems” (October 2025 · Japan 1996 first to 80 · all peers crossed 80 by 2012 · US 78.5 in 2012 · preventive spend data)
- Our World in Data — “Why is life expectancy in the US lower than in other rich countries?” (citing OECD data · prevention vs treatment · obesity · overdoses · gun violence · primary causes)
- Visual Capitalist — “Life Expectancy vs Healthcare Spending 1970–2023” (Peterson-KFF data · US $12,023 in 2023 vs ~$3,986 peer avg · US outlier chart)
- media.market.us — “Life Expectancy Statistics and Facts 2026” (UN WPP projections 2050-2055 · HK 89.22 · Japan 88.53 · Switzerland 87.76 · Singapore 87.63 · aging population data)












