The Economics of Big Tech
Five listed firms were worth about $21 trillion. NVIDIA alone cleared Germany’s entire 2026 GDP. That sentence is a comparison of unlike things — and it is still the right sentence to sit with.
Market cap is a price. GDP is a year’s output. Do not add them. Do not call a company a country. Then look at the numbers anyway.
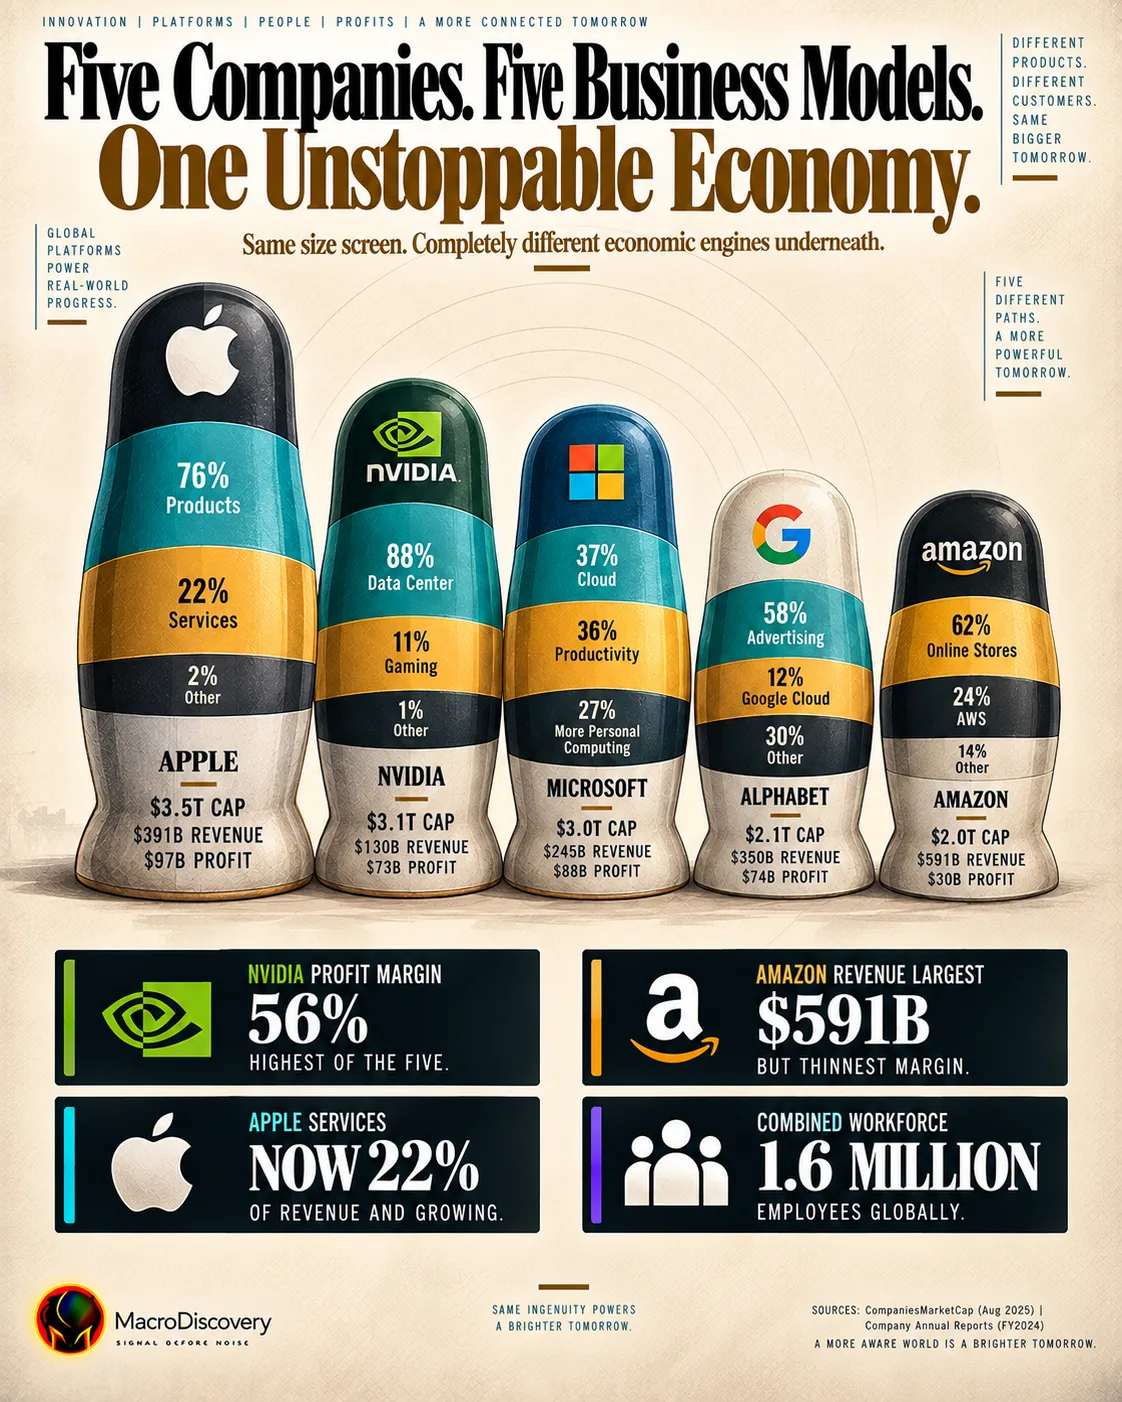
On the 22 September 2026 close, the five largest U.S.-listed consumer-and-chip platforms lined up like this: NVIDIA $5.54 trillion, Apple $4.99 trillion, Alphabet $4.21 trillion, Microsoft $3.70 trillion, Amazon $2.74 trillion. Add the five and you get about $21.2 trillion.
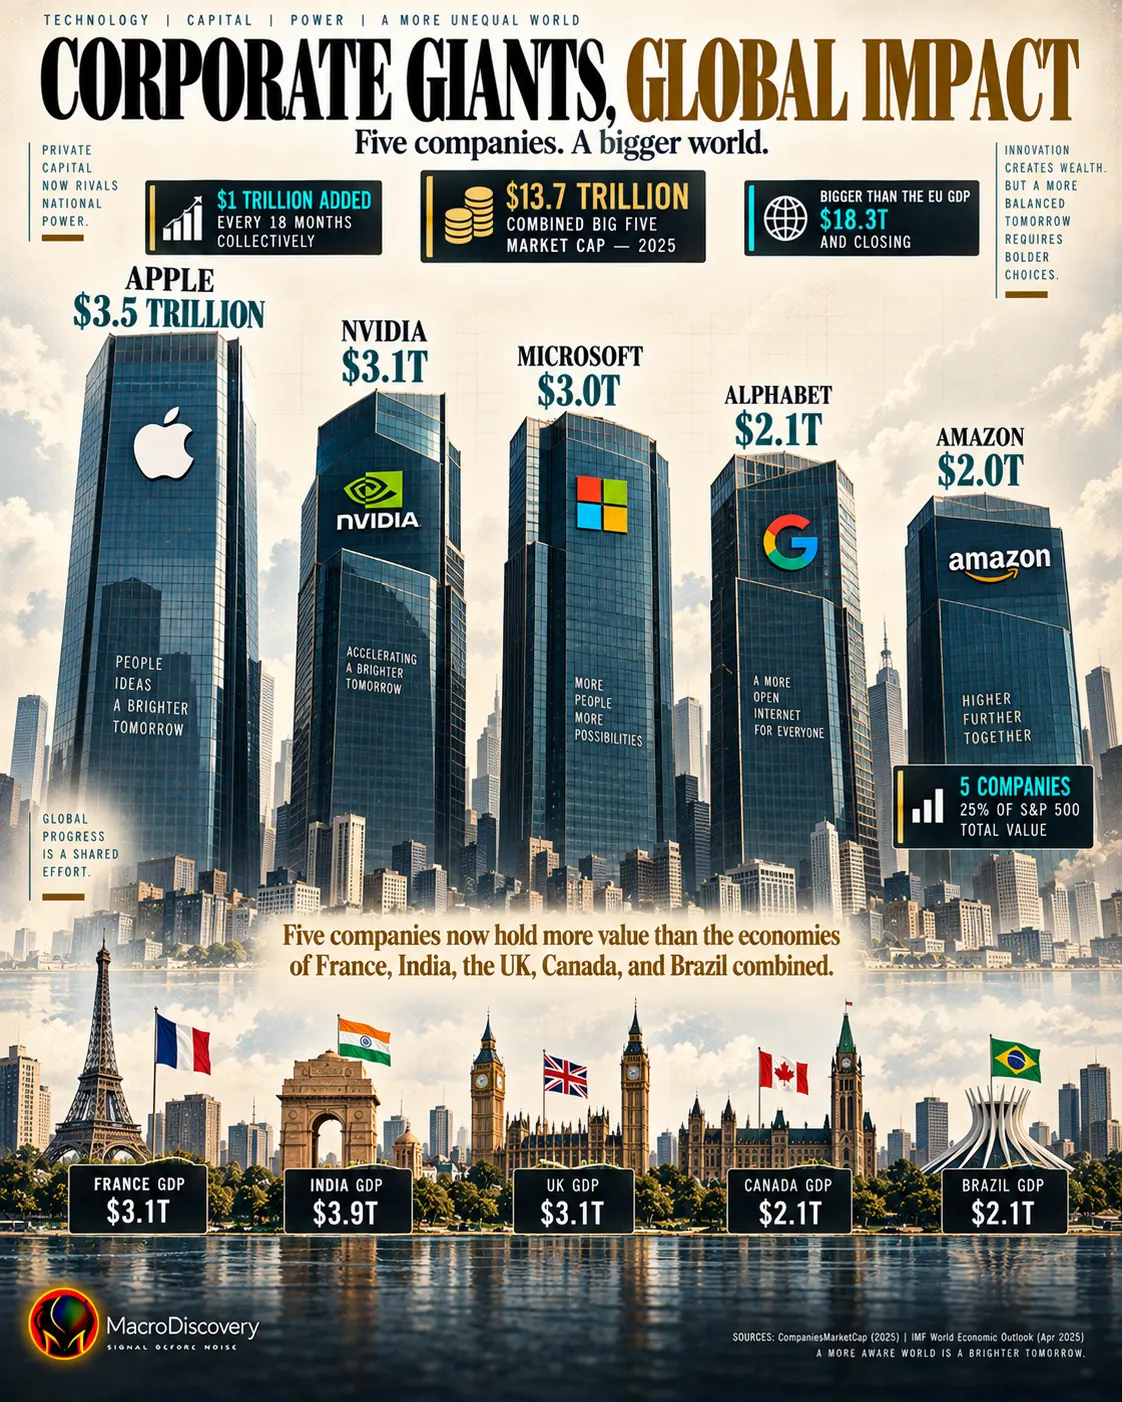
The IMF’s April 2026 World Economic Outlook puts 2026 nominal GDP at about $32.4 trillion for the United States, $20.9 trillion for China, and $5.45 trillion for Germany — the world’s third-largest economy. NVIDIA’s market cap that Tuesday sat just above Germany’s entire year’s output. Apple sat above Japan, the United Kingdom and India. Microsoft sat above France. Amazon sat even with Italy.
That is the secondary title, unpacked. Five companies are each worth more than most of the world’s economies — if “worth” means the stock market’s last print, and “economies” means everyone except the two giants and a short list of G7/G20 names.
A price list from one Tuesday
- 1NVIDIA$5.54T
- 2Apple$4.99T
- 3Alphabet$4.21T
- 4Microsoft$3.70T
- 5Amazon$2.74T
- —Five added~$21.2T
Meta (~$1.87T) and TSMC (~$2.34T) sit next door. SpaceX’s listed print, where it exists, is a different animal. This article’s “five” are NVDA, AAPL, GOOG, MSFT, AMZN.
Same dollars. Different machines.
IMF 2026 nominal GDP, current dollars: Germany $5.45T, Japan $4.38T, United Kingdom $4.26T, India $4.15T, France $3.60T, Italy $2.74T. World output in that vintage is about $126 trillion. The five firms are roughly one-sixth of that world total — as a stock of equity value, not as a sixth of what the planet produces this year.
> Germany $5.45T GDP
One chip designer vs the third-largest national output.
> Japan, UK, India
A consumer-and-services stack vs three G20 outputs.
≈ China $20.9T GDP
A rhyme, not an identity. China’s GDP is a flow.
IMF WEO April vintage
The five are a price. This is a year’s work.
A company can be “bigger than a country” only if you agree that a share price and a year’s paychecks are the same unit. They are not. The chart is still the story of this decade.Macro Discovery · market cap vs IMF nominal GDP
$21 trillion is concentration. It is not sovereignty.
Add Germany, Japan, the UK, India and France and you get about $21.8 trillion of 2026 output — almost the same pile as these five tickers. That rhyme is why the headline works. It is also why it misleads. Those five countries employ hundreds of millions and collect taxes. The five firms employ a rounding error of that and collect a different kind of rent: chips, search, cloud, phones, carts.
The economic fact underneath the meme is narrower and sharper: listed U.S. tech has become a second sovereign-wealth-scale balance sheet that foreign pensions and domestic 401(k)s both own. When the five sneeze, world household wealth moves. That is the “economics of Big Tech” that survives a 20% drawdown. The GDP comparison does not.
Editorial reading of 22 Sept 2026 closes and IMF WEO April 2026 nominal GDP. Those publishers did not write this box. Caps move daily.If you remember two things
Five names ≈ $21.2 trillion
NVDA 5.54 · AAPL 4.99 · GOOG 4.21 · MSFT 3.70 · AMZN 2.74. NVIDIA > Germany’s GDP that year.
Market cap is not GDP
One is a stock of equity value. One is a flow of output. The comparison is a spotlight, not an identity.
Short answers
One close. One WEO vintage.
- Caps: 22 September 2026 published closes — NVDA $5.54T, AAPL $4.99T, GOOG $4.21T, MSFT $3.70T, AMZN $2.74T. Sum ~$21.18T, rounded $21.2T.
- GDP: IMF WEO April 2026 nominal, current USD — US $32.38T, China $20.85T, Germany $5.45T, Japan $4.38T, UK $4.26T, India $4.15T, France $3.60T, Italy $2.74T, world ~$126T.
- Comparison: labeled as market cap vs annual output. Never added into one “world worth.”