The Cities That Don’t Survive
the Next 100 Years
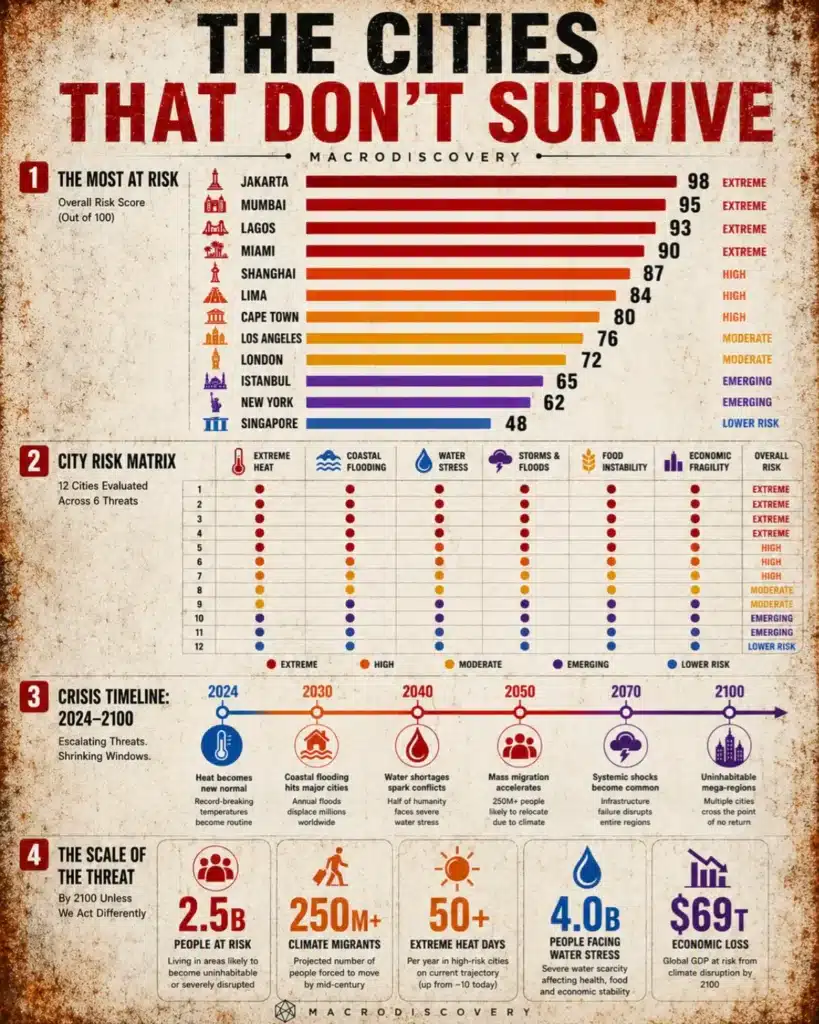
Sea level rise. Extreme heat. Sinking ground. Water collapse. Storm intensification. Some of the world’s most populated cities are on trajectories toward uninhabitability — not in the distant future, but within a century. Here is the data behind each threat.
Major cities plotted by primary threat category. Dot size indicates population at risk. Multiple overlapping threats indicate compound risk.
Each city scored 0–5 across five threat categories. Overall score = compound risk rating. Based on IPCC AR6, NASA, and World Bank projections.
| City | 🌊 Flood | 🔥 Heat | ↓ Sinking | 💧 Water | 🌀 Storms | Overall |
|---|---|---|---|---|---|---|
|
🇮🇩
Jakarta
Indonesia
|
5 |
4 |
5 |
4 |
3 |
23/25 |
|
🇧🇩
Dhaka
Bangladesh
|
5 |
4 |
3 |
4 |
5 |
21/25 |
|
🇮🇶
Basra
Iraq
|
4 |
5 |
2 |
5 |
3 |
19/25 |
|
🇹🇭
Bangkok
Thailand
|
5 |
4 |
4 |
3 |
3 |
19/25 |
|
🇵🇰
Karachi
Pakistan
|
3 |
5 |
2 |
5 |
3 |
18/25 |
|
🇺🇸
Miami
United States
|
5 |
3 |
4 |
2 |
5 |
19/25 |
|
🇻🇳
Ho Chi Minh City
Vietnam
|
5 |
3 |
4 |
3 |
3 |
18/25 |
|
🇨🇳
Shanghai
China
|
4 |
3 |
4 |
2 |
4 |
17/25 |
|
🇪🇬
Alexandria
Egypt
|
5 |
4 |
3 |
4 |
2 |
18/25 |
|
🇮🇹
Venice
Italy
|
5 |
2 |
4 |
1 |
3 |
15/25 |
|
🇮🇳
Mumbai
India
|
4 |
4 |
2 |
3 |
3 |
16/25 |
|
🇳🇱
Amsterdam
Netherlands
|
4 |
2 |
3 |
1 |
2 |
12/25 |
The cities where compound threats are most acute — and where the data already shows measurable deterioration.
Key threshold crossing points based on IPCC AR6 central projections. Confidence: scenario-based.
2024
–2040
–2060
–2100
The word “uninhabitable” is doing significant work in this article — and it requires definition. No major city simply disappears overnight. What happens instead is a cascade: property values decline, insurance withdraws, infrastructure investment stops, businesses relocate, residents follow — until the city effectively empties itself without any dramatic singular event. This process is already visible in parts of Miami Beach, in North Jakarta, and in the Ganges-Brahmaputra delta.
The question is not whether cities like Jakarta or Dhaka will face this cascade. The data on subsidence, sea level rise, and extreme heat is clear enough that researchers at institutions including NASA, the World Bank, and the IPCC are now writing about these outcomes not as scenarios but as trajectories. The question is whether intervention — in the form of sea walls, managed retreat, emissions reductions, and economic adaptation — can change the trajectory fast enough.
“Jakarta is the world’s most dramatic case study in what happens when a city of 10 million people sinks faster than the sea is rising. The Indonesian government’s decision to build a new capital is not an act of environmental caution — it is an act of strategic necessity.”
The Five Threats
The Cities That Will Survive
The data on at-risk cities does not imply that all coastal or hot cities are doomed. Several factors significantly reduce risk: wealthy economies can invest in infrastructure adaptation at a scale poor ones cannot. Countries at higher latitudes gain agricultural land and livability as warming proceeds. Cities built on bedrock rather than alluvial plains do not subside. Cities with diversified water supplies are less vulnerable to drought.
The cities best positioned for the next century include Amsterdam — which has the engineering infrastructure and economic capacity to manage its flood risk, and has been doing so successfully for decades. Singapore — which has invested heavily in water recycling and desalination, reducing its freshwater dependence. And most northern cities, which benefit from climate warming in terms of longer growing seasons and reduced heating costs, at least in the near term.
The trajectory is clear. Several of the world’s largest cities are on paths toward uninhabitability within the next 100 years — not from a single catastrophic event, but from the accumulation of compounding pressures that erode habitability incrementally until the economic and social case for remaining collapses.
The word “survive” in the title requires one qualification: cities can survive in altered form. Jakarta’s government may move its center of power to Nusantara while millions continue to live in a diminished, flood-managed Jakarta. Venice may survive as a protected cultural monument while ceasing to function as a living city. Miami may build a network of elevated infrastructure above a partially inundated streetscape. Survival, in this context, means transformation rather than continuation.
The critical variable is the emissions trajectory of the next 30 years. The difference between 1.5°C and 3°C of warming is the difference between managed adaptation and structural crisis for dozens of cities simultaneously. The window for the lower outcome is closing — not closed. The data makes both trajectories visible. Which one materializes is a policy choice, not a physical inevitability.
Confidence level: ○ STRUCTURAL PROJECTION — based on IPCC AR6 central scenarios. Outcomes vary significantly by emissions pathway. This is not a single-point prediction.