AI Tech Gaming Future Automobile Top 10 Space Innovation Trending How To Reviews Discover

---Advertisement---

Ranked: The True Cost of Owning a Car Over a Lifetime

Macro Discovery
On: June 25, 2026 4:18 PM
Follow Us:
---Advertisement---
Ranked: The True Cost of Owning a Car Over a Lifetime
The True Cost of Owning a Car Over a Lifetime — MacroDiscovery
MacroDiscovery
Wealth & Consumer · 8 min read · Current Data
NOW — Personal Finance · Consumer Spending · 2024
Wealth & Consumer Behavior

The True Cost of Owning
a Car Over a Lifetime

Most people know what they paid for their car. Almost nobody knows what it actually costs them — across fuel, insurance, depreciation, financing, maintenance, parking, and the investment returns they never earned. The real number is much larger than the sticker price.

By MacroDiscovery
Sources: AAA · IRS · BLS · NHTSA
Updated: 2024
$700K+
True lifetime car cost (US avg)
$12,182
Annual cost — new car US 2024
47%
Value lost in first 3 years
$1.4M
If invested instead (8% return)
$0.72
True cost per mile — US average
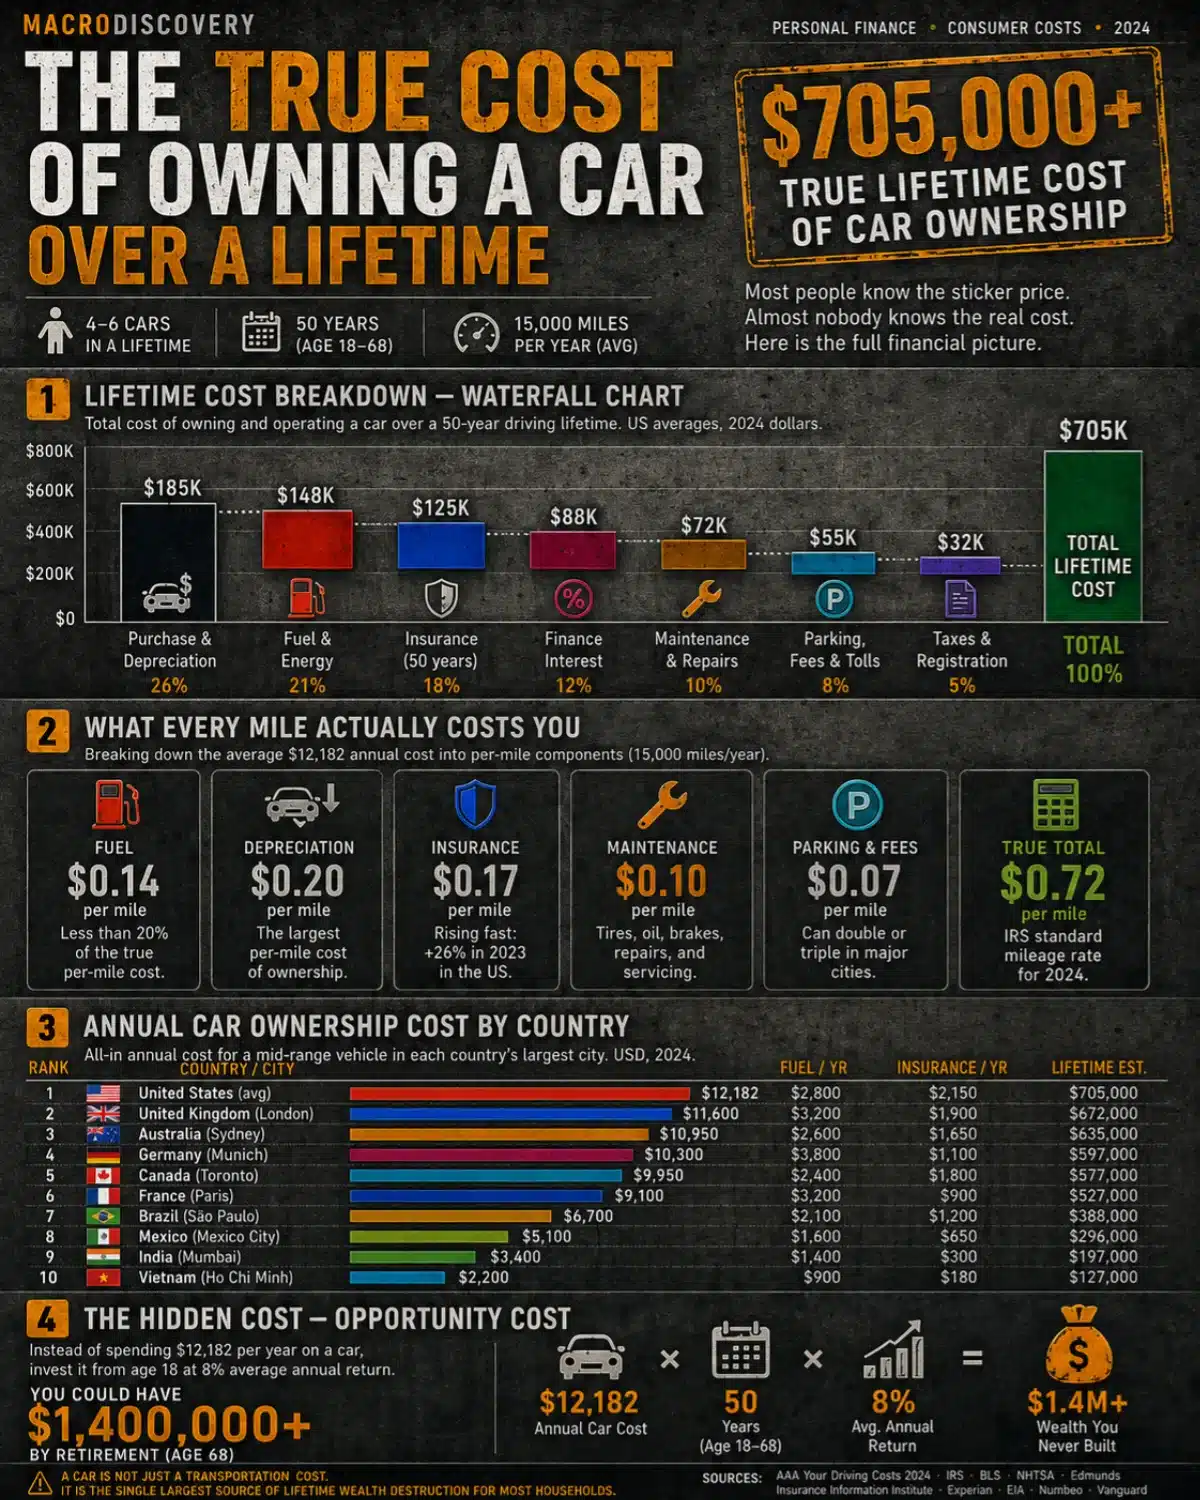
Visualization 01 — Lifetime Cost Waterfall
Every Dollar a Car Takes from You — Over a Lifetime

Based on owning 4–6 cars across a 50-year driving lifetime (age 18–68). US averages, 2024. Inflation-adjusted to today’s dollars.

$800K $600K $400K $200K $100K $0 $185K Purchase / Depreciation $148K Fuel & Energy $125K Insurance (50 years) $88K Finance Interest $72K Maintenance & Repairs $55K Parking / Fees / Tolls $32K Taxes / Registration $705K TOTAL Lifetime Total Sources: AAA Your Driving Costs 2024 · IRS Mileage Rate · BLS Consumer Expenditure Survey 2024
Vehicle Purchase & Depreciation 4–6 cars over 50 years, resale values included
$185,00026% of total
Fuel & Energy ~15,000 miles/year at avg US fuel efficiency & prices
$148,00021% of total
Insurance Full coverage, 50 years. Rising rapidly in recent years
$125,00018% of total
Financing & Interest Auto loans on each vehicle purchased. Avg US auto loan rate
$88,00012% of total
Maintenance & Repairs Oil changes, tires, brakes, unexpected repairs, servicing
$72,00010% of total
Parking, Tolls & Fees Daily parking, toll roads, city permits, fines
$55,0008% of total
Taxes & Registration Annual registration, vehicle property tax, sales tax
$32,0005% of total
LIFETIME TOTAL 50 years of car ownership, 4–6 vehicles
$705,000in 2024 dollars
Visualization 02 — True Cost Per Mile
What Every Mile Actually Costs You

Breaking the annual cost of $12,182 (AAA 2024 average for a new vehicle) into its per-mile components at 15,000 miles per year.

Fuel
$0.14
per mile
Most people think this is the only cost. It is less than 20% of the total per-mile cost.
📉
Depreciation
$0.20
per mile
The single largest per-mile cost. A new car loses ~$3,000 in value the moment it leaves the dealership.
🛡️
Insurance
$0.17
per mile
US average auto insurance rose 26% in 2023 alone — its fastest increase in 50 years.
🔧
Maintenance
$0.10
per mile
Tires, oil, brakes, filters, and unexpected repairs. EVs reduce but don’t eliminate this cost.
🅿️
Parking & Fees
$0.07
per mile
In major cities this can double or triple. NYC average monthly parking: $600–$800/month.
🧮
TRUE TOTAL
$0.72
per mile
The IRS standard mileage rate for 2024. Every mile you drive costs 72 cents in total ownership costs.
Visualization 03 — Global Cost Comparison
Annual Car Ownership Cost by Country

Annual all-in cost for a mid-range vehicle in each country’s largest city. Purchasing power adjusted to USD. Source: Numbeo, KPMG, local auto associations 2024.

Country / City Annual Cost (USD) Fuel Cost/yr Insurance/yr Lifetime Est.
🇺🇸 United States (avg)
$12,182
$2,800 $2,150 $705,000
🇬🇧 United Kingdom (London)
$11,600
$3,200 $1,900 $672,000
🇦🇺 Australia (Sydney)
$10,950
$2,600 $1,650 $635,000
🇩🇪 Germany (Munich)
$10,300
$3,800 $1,100 $597,000
🇨🇦 Canada (Toronto)
$9,950
$2,400 $1,800 $577,000
🇫🇷 France (Paris)
$9,100
$3,200 $900 $527,000
🇧🇷 Brazil (São Paulo)
$6,700
$2,100 $1,200 $388,000
🇲🇽 Mexico (Mexico City)
$5,100
$1,600 $650 $296,000
🇮🇳 India (Mumbai)
$3,400
$1,400 $300 $197,000
🇻🇳 Vietnam (Ho Chi Minh)
$2,200
$900 $180 $127,000
The Hidden Cost Nobody Calculates · Opportunity Cost
$1,400,000
If the average American invested their lifetime car spending instead of spending it on cars, at 8% average annual return, they would have $1.4 million by retirement.
This is the number that reframes the entire calculation. The $705,000 direct cost of car ownership is substantial. But money spent on a depreciating asset is money not compounding. $12,182 per year invested from age 18 at 8% annual return (US stock market historical average) produces approximately $1.4 million by age 68. The car does not just cost what you paid — it costs the wealth you would have built instead. This is the opportunity cost most financial analyses of car ownership omit entirely.

When people think about the cost of their car, they think about the monthly payment. Sometimes they think about insurance and fuel too. Almost nobody calculates the full picture — and the full picture, when you actually run the numbers, is one of the most striking data points in personal finance.

The average American spends approximately $12,182 per year on their vehicle according to AAA’s 2024 Driving Costs Study. Over a 50-year driving lifetime — from age 18 to 68, owning four to six vehicles — that compounds to approximately $705,000 in direct costs. This does not include the investment returns foregone by spending that money on a depreciating asset rather than investing it.

“A new car loses approximately 20% of its value in the first year of ownership. It loses roughly 47% of its value in the first three years. The moment you drive it off the lot, you have already paid the most expensive mile you will ever drive.”

The Depreciation Problem

Depreciation · The Invisible Cost
$185,000
Depreciation is the largest single cost of car ownership — and the one most people never consciously pay because it happens silently as the car ages.
A new car that cost $35,000 is worth approximately $28,000 after one year, $21,000 after two years, and $18,500 after three years — before a single repair bill arrives. This $16,500 loss in three years is real money that simply evaporates. The depreciation cost per mile on a new vehicle driven 15,000 miles per year works out to approximately $0.20 per mile — more than the fuel cost. The practical implication: buying a 2–3 year old vehicle that has already absorbed the steepest depreciation curve is one of the highest-return decisions in personal finance. The car is functionally nearly identical; the price is substantially lower.
Source: Edmunds — True Cost to Own Data 2024 · AAA Your Driving Costs 2024 · Carfax Vehicle Depreciation Study
Fuel · The Cost That Compounds with Distance
$148,000
Fuel costs are the second-largest lifetime expense — and the only one that scales directly with how much you drive.
At 15,000 miles per year, an average US fuel efficiency of 28 mpg, and an average gasoline price of $3.50 per gallon, fuel costs approximately $1,875 per year for the engine alone. Add in the energy cost equivalent for EVs (which are cheaper per mile but not free), and the 50-year total reaches approximately $148,000 in today’s dollars. This is the most visible cost — you feel it at the pump every week. It is also the one that fluctuates most — fuel price spikes in 2022 added approximately $800 to the average American’s annual fuel bill in a single year.
Source: US Energy Information Administration 2024 · BLS Consumer Expenditure Survey 2024 · AAA Gas Prices
Insurance · The Cost That Never Stops Rising
+26%
US auto insurance costs rose 26% in 2023 — the fastest annual increase in 50 years — adding approximately $440 to the average American’s annual insurance bill in a single year.
Auto insurance is not optional in most US states — it is legally mandated. Yet its costs are largely invisible to most drivers until renewal. The 2023 surge was driven by a combination of factors: inflation in repair costs (up 20%+ as parts and labor costs rose), increased claims severity from more distracted driving, and the higher repair costs of modern vehicles packed with sensors and advanced systems. A minor fender bender that cost $800 to repair in 2015 may cost $2,500+ in 2024 because the bumper now contains parking sensors, cameras, and radar units that all need replacing. The cost of vehicle complexity flows directly into insurance premiums.
Source: Insurance Information Institute 2024 · S&P Global — US Auto Insurance Market Report 2024 · J.D. Power Insurance Study
Financing · The Premium on Impatience
$88,000
The average American who finances every vehicle purchase over their lifetime pays approximately $88,000 in interest alone — for the privilege of driving cars they haven’t saved for.
The average new car loan in the US in 2024 carries an interest rate of approximately 7.1% for a 72-month term. On a $35,000 vehicle, that means paying approximately $7,900 in interest — before the car has lost a dollar of value to depreciation or consumed a gallon of fuel. Across four to six vehicle purchases over a lifetime, the cumulative interest paid reaches approximately $88,000. This is money paid for the financial structure of car ownership, not for the car itself. Paying cash for vehicles — even modestly priced used vehicles — eliminates this cost entirely and is one of the highest guaranteed returns available in personal finance.
Source: Experian State of the Auto Finance Market Q3 2024 · Federal Reserve Consumer Credit Data
Opportunity Cost · The Biggest Number Nobody Sees
$1.4M
The $12,182 spent annually on a car, invested instead from age 18 at 8% average annual return, would produce approximately $1.4 million by age 68.
This is the calculation that reframes car ownership as a financial decision rather than just a transportation decision. Every dollar spent on a depreciating asset is a dollar not compounding. The S&P 500 has returned approximately 10% annually before inflation (8% in real terms) over the past 50 years. $12,182 per year at 8% for 50 years produces $1,417,000. The car costs not just what you paid — it costs the wealth you would have built with that money. For most American households, the car is the single largest source of lifetime wealth destruction — larger than any other consumer spending category.
Source: S&P 500 historical returns — Vanguard 2024 · Compound interest calculation based on AAA 2024 annual cost

The Electric Vehicle Calculation

Electric vehicles change several components of this calculation — but do not eliminate the problem. EVs have substantially lower fuel costs (electricity is cheaper per mile than gasoline), significantly lower maintenance costs (no oil changes, fewer brake jobs due to regenerative braking, fewer moving parts), and often lower insurance costs for base models.

What EVs do not change: depreciation (which is currently worse for EVs than for comparable ICE vehicles in many segments), financing costs (EVs carry higher sticker prices), and the fundamental opportunity cost calculation. A $55,000 EV still costs $55,000 — which still compounds to well over $1 million over a lifetime if invested instead.

The AAA estimates that EV ownership currently costs approximately $10,700 per year — roughly $1,500 less than the average ICE vehicle. Over a lifetime, this represents approximately $75,000 in savings versus the ICE alternative — meaningful, but not transformative at the scale of the full lifetime cost calculation.

MacroDiscovery Take

The car is the most expensive consumer product most people will ever own — and most of them have no accurate idea what it costs. The gap between perceived cost (the monthly payment) and actual cost ($0.72 per mile across all categories) is one of the largest systematic miscalculations in personal finance.

The data does not argue that cars are irrational purchases. In most of the United States, car ownership is not a luxury — it is a prerequisite for employment, healthcare access, and participation in civic life. The built environment of the US was designed around the automobile, and for most Americans there is no practical alternative. The question is not whether to own a car but whether to own the car you own — or a less expensive one.

The calculation that most changes behavior is the opportunity cost one: every upgrade from a $25,000 used car to a $45,000 new car costs not $20,000 but approximately $200,000 in compounded lifetime wealth — the $20,000 price difference plus 50 years of compound returns on that difference. This is the number that personal finance textbooks discuss and most car advertisements are designed to make you forget.

Forecast Cards — Key Data Points
Wealth · Car Ownership
$705K
True lifetime cost of car ownership for the average American — across all cost categories over 50 years of driving.
AAA Your Driving Costs 2024 · BLS
Wealth · Depreciation
47%
Value lost on a new car in the first 3 years of ownership — before the most expensive repairs begin.
Edmunds True Cost to Own 2024
Wealth · Insurance
+26%
US auto insurance cost increase in 2023 — the fastest annual rise in 50 years, driven by repair cost inflation.
Insurance Information Institute, 2024
Wealth · Opportunity Cost
$1.4M
What the average annual car spend, invested instead at 8% return from age 18, would produce by retirement age.
S&P 500 historical returns · Vanguard 2024
Sources & Methodology
  • AAA — Your Driving Costs: How Much Are You Really Paying to Drive? (2024 Edition)
  • Edmunds — True Cost to Own (TCO) Methodology & Data, 2024
  • US Bureau of Labor Statistics — Consumer Expenditure Survey 2023
  • Insurance Information Institute — Auto Insurance Trends Report 2024
  • Experian — State of the Auto Finance Market Q3 2024
  • US Energy Information Administration — Gasoline and Diesel Prices 2024
  • IRS — Standard Mileage Rate 2024 (67 cents/mile = $0.67)
  • Numbeo — Cost of Living and Car Ownership by City 2024
  • Vanguard — How America Invests 2024 · S&P 500 Historical Returns
Macro Discovery

Sukh Dhaliwal

Sukh Dhaliwal is the founder of Macro Discovery, an independent digital publication covering AI, technology, science, future trends, and global innovation through visual storytelling and data-driven analysis.

Join WhatsApp

Join Now

Join Facebook

Follow us

Leave a Comment