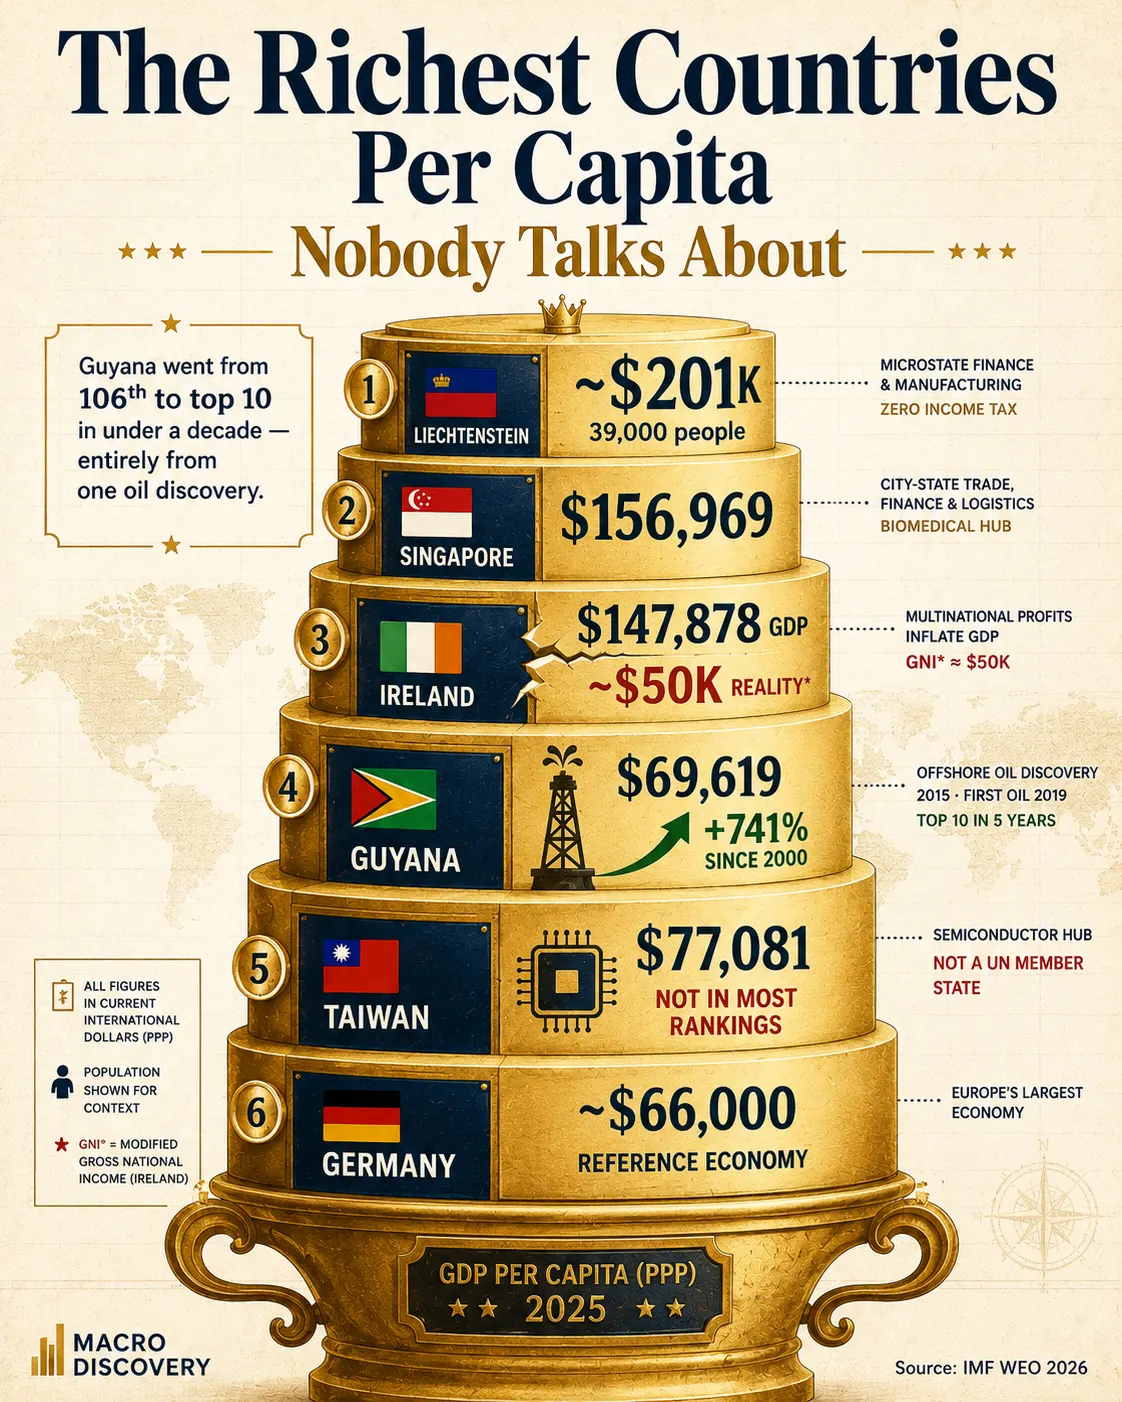
The Richest Countries Per Capita
Nobody Talks About
Luxembourg and Singapore top every wealth table. But so does a tiny mountain state with 39,000 people. And a South American country that barely had oil five years ago. And a nation that doesn’t officially exist in most rankings. The numbers at the top are stranger than you think.
Most lists of the world’s richest countries show the same names — the US, Norway, Switzerland, Germany. But the real top of the table looks very different. It is dominated by microstates, city-states, oil kingdoms, and one country that most ranking systems quietly leave out. Here is what the IMF data actually shows — and what the numbers don’t tell you.
- Singapore earns $156,969 per person (PPP, 2025) — more than twice the US figure — making it the richest large city-state in the world by this measure.
- Guyana went from 106th to top-10 in global per-capita wealth in under a decade — entirely because of an offshore oil discovery in 2015 and first production in 2019.
- Taiwan is wealthier per capita than Germany ($77,081 vs ~$66,000 PPP) but is excluded from most global rankings because it is not a UN member state.
| Country / Economy | GDP/Capita PPP 2025 | How They Got There | Population | Caveat |
|---|---|---|---|---|
🇱🇮Liechtenstein |
~$201,112 | Microstate finance, manufacturing, zero income tax, Swiss customs union | ~39,000 | ⚠ Not IMF member · approx figure |
🇸🇬Singapore |
$156,969 | City-state trade, finance, logistics, biomedical hub | ~5.9M | ℹ Multinational profit routing inflates GDP |
🇱🇺Luxembourg |
$152,394 | European banking, investment funds, steel legacy | ~680,000 | ℹ Tax haven effects inflate GDP vs real income |
🇮🇪Ireland |
$147,878 | US tech & pharma multinationals, low corporate tax | ~5.1M | ⚠ Real income (GNI*) ≈ $50K — GDP is “leprechaun economics” |
🇶🇦Qatar |
$122,283 | World’s largest LNG exporter, sovereign wealth fund | ~3M | ⚠ ~80% are migrant workers — wealth highly concentrated |
🇧🇳Brunei |
$94,472 | Oil and gas monarchy, no income tax for citizens | ~450,000 | ⚠ GDP down 20% since 2000 · oil depleting · inequality high |
🇹🇼Taiwan |
$77,081 | World’s semiconductor hub (TSMC), advanced manufacturing | ~23.5M | ⚠ Not a UN member · excluded from most official rankings |
🇬🇾Guyana |
$69,619 | Offshore oil discovery 2015 · first barrel Dec 2019 | ~840,000 | ⚠ Oil wealth not yet broadly distributed · high inequality |
🇲🇴Macao |
Top 5 globally | Casino gaming capital of the world (6× Las Vegas revenues) | ~680,000 | ⚠ SAR of China · GDP collapsed during COVID · extreme volatility |
🇺🇸United States |
~$76,875 | Reference: largest diversified economy | ~340M | ✓ Figure broadly reflects living standards |
🇩🇪Germany |
~$66,000 | Reference: Europe’s largest economy | ~84M | ✓ Figure broadly reflects living standards |
Source: IMF World Economic Outlook, April 2026 (2025 latest estimates, PPP current international dollars) via WorldAtlas, Worldometers, Statbase. Liechtenstein: approximate figure (not IMF member). Macao: no single verified 2025 PPP figure — described directionally. Germany: approximate 2024 figure.
PPP = Purchasing Power Parity. Figures adjust for cost of living differences. All are GDP per capita — average output per resident, not median household income. Click column headers to sort.
Ireland’s Secret — and Why Its Number Is Fake
Ireland appears to be the third-richest country in Europe with $147,878 per capita. But Ireland’s own statistical agency — the Central Statistics Office — created an entirely new economic measure in 2017 specifically to fix this problem. It is called Modified Gross National Income, or GNI*.
The reason: companies like Apple book hundreds of billions in profits through Ireland to reduce their global tax bills. This activity shows up in Ireland’s GDP but almost none of the money stays in the Irish economy. When you strip it out, Ireland’s real per-capita income falls to roughly €46,000 (~$50,000) — less than a third of the headline GDP figure. Paul Krugman called the original number “Leprechaun Economics.” By actual household consumption, Ireland ranks about 12th in the EU — not 2nd.
Guyana: From One of South America’s Poorest to Top 10 in Five Years
In 2015, Guyana ranked 106th in the world for per-capita income. Then ExxonMobil found one of the largest offshore oil deposits in history. On December 20, 2019, Guyana pumped its first barrel. By 2025, it was producing over 600,000 barrels a day and its GDP had grown by more than 741% in purchasing-power terms since 2000 — the largest increase of any country on earth over that period.
Its per-capita GDP now sits at $69,619 — well above Brazil, Mexico, or any of its South American neighbours. The IMF has praised Guyana for establishing a sovereign wealth fund and audit mechanisms. But with a population of only 840,000 and high inequality, most Guyanese have not yet seen the wealth arrive at their door. Venezuela — just next door — is a cautionary tale of how fast an oil boom can become a catastrophe.
Taiwan Is Richer Than Germany — but Barely Exists in Official Rankings
Taiwan’s GDP per capita of $77,081 puts it above the United States and well above Germany. Its economy is built around one of the most critical industries in the world — semiconductor manufacturing. Taiwan Semiconductor Manufacturing Company (TSMC) produces over 90% of the world’s most advanced chips. Without Taiwan, there are no iPhones, no AI servers, no modern cars.
And yet Taiwan appears in almost no official global rankings. It is not a UN member state. The IMF lists it as “Taiwan Province of China.” Most published league tables quietly exclude it. This means the world’s fourth-richest large economy by per-capita income is systematically invisible in the datasets that shape policy and public understanding. The reason is entirely political — not economic.
Qatar and Brunei: Rich on Paper, Complicated in Reality
Qatar’s per-capita GDP of $122,283 sounds extraordinary. But Qatar’s total population of around 3 million includes roughly 80% migrant workers — construction labourers, domestic staff, and service workers on low wages who are legally barred from most of the rights Qatari nationals enjoy. The figure is a mathematical average that mixes two very different economic realities in the same number.
Brunei tells a different story: declining. Its per-capita GDP has fallen more than 20% in real terms since 2000 as oil reserves deplete and diversification moves slowly. Despite a headline figure of $94,472, the sultan’s extreme personal wealth and government dependency programmes mask a population that is far from uniformly prosperous. The oil that made Brunei rich is running out.
- IMF — World Economic Outlook, April 2026 (2025 PPP GDP per capita estimates)
- WorldAtlas — “The Richest Countries in the World” (citing IMF WEO April 2026)
- Central Statistics Office Ireland — Modified GNI (GNI*) Methodology Explained
- Wikipedia — Modified Gross National Income · GDP per Capita by Country (PPP) · Taiwan (economy)
- Global Finance Magazine — “Richest Countries in the World 2024”
- Statbase — GDP per Capita (IMF data) 2025 · statbase.org/datasets/economics/gdp-per-capita-imf
- Worldometers — Guyana GDP (citing IMF WEO April 2026)
- IMF — World Economic Outlook April 2026 (PPPPC@WEO datamapper) · imf.org