AI Tech Gaming Future Automobile Top 10 Space Innovation Trending How To Reviews Discover

---Advertisement---

Ranked: The Cost of Solar Energy — A 20-Year Collapse

Macro Discovery
On: June 26, 2026 10:01 AM
Follow Us:
---Advertisement---
Ranked: The Cost of Solar Energy — A 20-Year Collapse
The Cost of Solar Energy — A 20-Year Collapse · MacroDiscovery
MacroDiscovery
Energy & Climate · 3 min read · 2024 Data
2004 → 2024 — Solar Energy · LCOE · Energy Transition
Energy & Climate

The Cost of Solar Energy —
A 20-Year Collapse

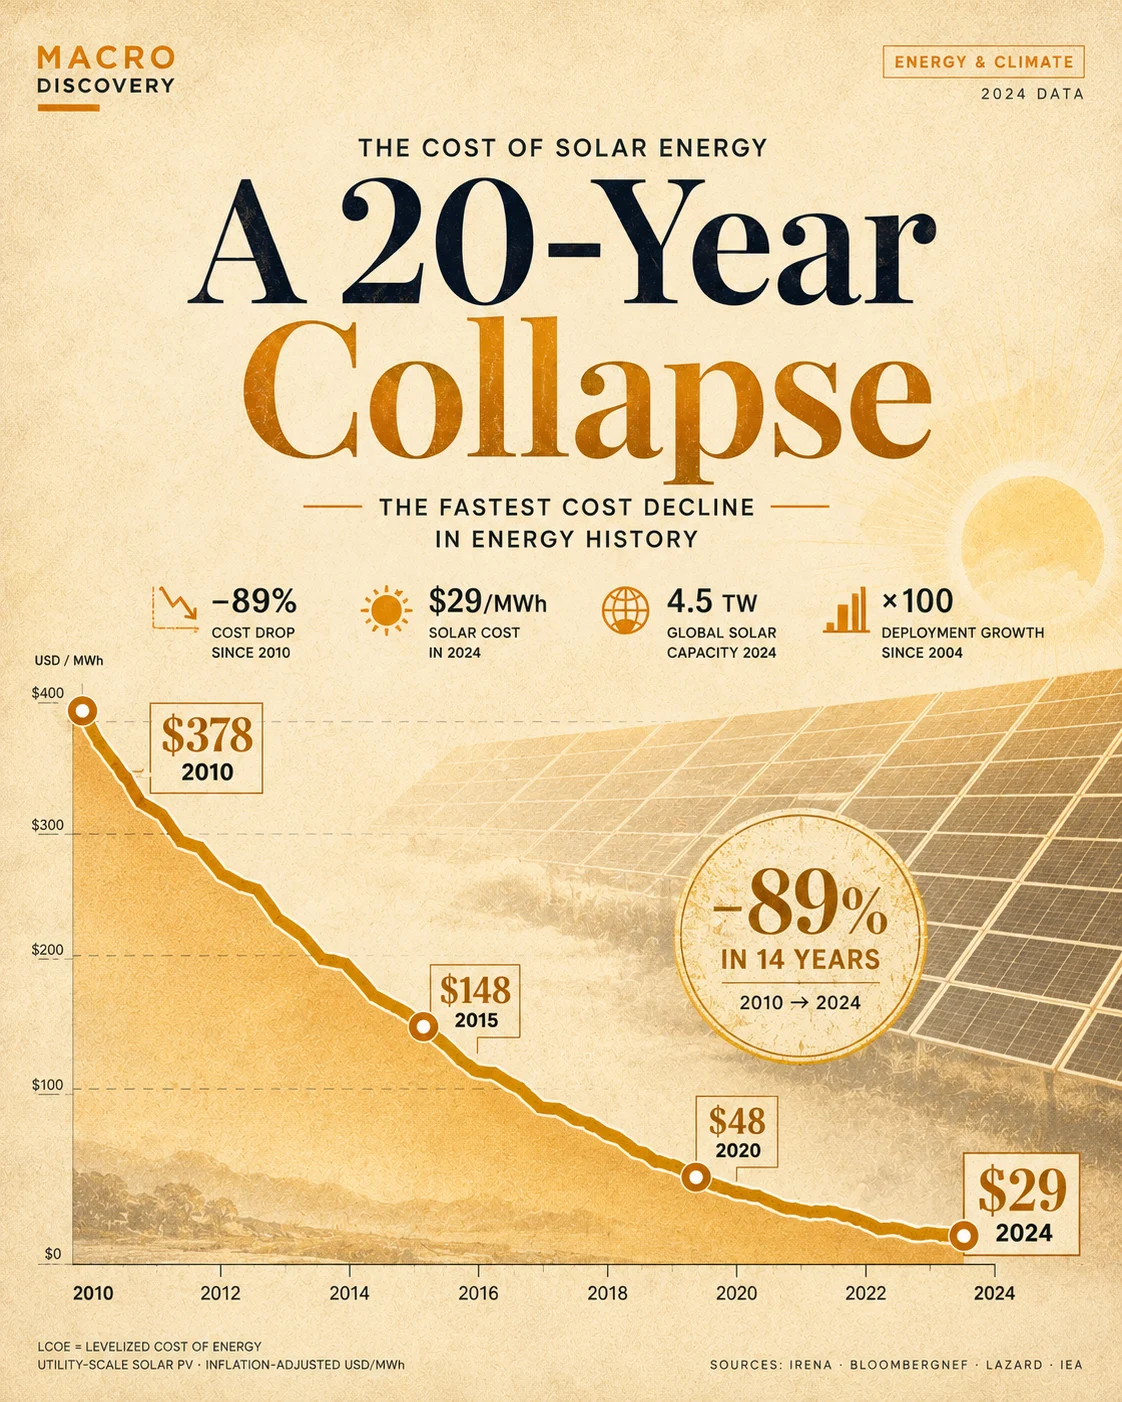
In 2004, a solar panel cost $76 per watt to produce. By 2024 that cost is $0.16. No energy technology in history has fallen in price this fast — or changed the global energy map this completely.

By MacroDiscovery
Sources: IRENA · BloombergNEF · LAZARD · IEA
Updated: 2024
−89%
Solar LCOE drop since 2010
$29/MWh
Utility solar cost today
4.5 TW
Global solar capacity 2024
×100
Deployment growth since 2004
$0.16/W
Solar panel cost today (vs $76 in 2004)
Visualization 01 — The Price Collapse
Solar LCOE 2010–2024 — The Fastest Cost Decline in Energy History

Levelized Cost of Energy (LCOE) in USD per megawatt-hour for utility-scale solar PV. Inflation-adjusted. Source: IRENA Renewable Power Generation Costs 2024, BloombergNEF LCOE Data.

$0 $100 $200 $300 $378 USD / MWh 2010 2013 2016 2019 2022 2024 Coal Gas Solar beats coal (2020) Solar: $48 · Coal: $109 $378/MWh · 2010 $29/MWh · 2024 −89% in 14 years Sources: IRENA Renewable Power Generation Costs 2024 · BloombergNEF LCOE 2024 LCOE = Levelized Cost of Energy · Utility-scale solar PV · Inflation-adjusted USD/MWh
Visualization 02 — Cost Comparison 2024
Solar vs. Every Other Energy Source Today

Levelized Cost of Energy (LCOE) in USD/MWh for new-build utility-scale generation. 2024 values. Source: Lazard LCOE Analysis v17.0 2024, IRENA 2024.

☀ Solar PV
$29/MWh — cheapest ever recorded
$29
💨 Onshore Wind
$33/MWh
$33
🌊 Hydro
$48/MWh (existing infrastructure)
$48
⛽ Natural Gas (CC)
$78/MWh — combined cycle
$78
🌊 Offshore Wind
$90/MWh — higher install costs
$90
🏭 Coal (new build)
$108/MWh — now 3.7× solar
$108
⚛ Nuclear (new build)
$150–$196/MWh — highest of all
$150–196
Visualization 03 — The Deployment Explosion
Global Solar Capacity 2004–2024 — From Nothing to 4.5 Terawatts

Cumulative installed solar PV capacity in gigawatts (GW). Each bar = one year. Source: IRENA, IEA World Energy Outlook 2024.

0 1,000 2,000 3,000 4,000 GW installed 04 05 06 07 08 09 10 11 12 13 14 15 16 17 18 19 20 21 22 23 2024: 4,500 GW total ×100 since 2004 (45 GW) Source: IRENA · IEA World Energy Outlook 2024
Visualization 04 — Country Leaders
Who Built the Most Solar — Top 8 Nations by Installed Capacity

Cumulative installed solar PV capacity in gigawatts (GW) as of 2024. Source: IRENA, IEA, BloombergNEF 2024.

🥇 Rank 01
China
780 GW
installed capacity
Installs more solar in one week than the US installs in a quarter. Manufactures 80% of the world’s solar panels.
🥈 Rank 02
USA
180 GW
installed capacity
IRA (2022) tripled the installation rate. Texas overtook California as the largest state solar market in 2023.
🥉 Rank 03
India
90 GW
installed capacity
Target of 500 GW by 2030. Solar now the cheapest electricity source in India — cheaper than new coal.
◆ Rank 04
Germany
82 GW
installed capacity
Solar covers 12% of national electricity. Energiewende policy drove early adoption — Germany was the world leader until 2015.
◆ Rank 05
Japan
80 GW
installed capacity
Post-Fukushima nuclear phase-down drove solar surge. Rooftop solar is now mandatory on all new residential buildings.
◆ Rank 06
Australia
38 GW
installed capacity
Highest rooftop solar per capita on Earth. 1 in 3 Australian homes have solar panels — highest rate globally.
◆ Rank 07
Brazil
35 GW
installed capacity
Fastest-growing market 2022–2024. Solar now cheaper than hydro in several northeastern states — the world’s solar irradiance sweet spot.
◆ Rank 08
Netherlands
24 GW
installed capacity
Remarkable for a country with limited sunshine. Solar covers 17% of Dutch electricity — proof that policy can override geography.

Why the Collapse Happened

Not luck — three compounding mechanisms drove the most dramatic cost decline in energy history.

  • Wright’s Law: Every doubling of cumulative production cut solar panel costs by ~20%. Production has doubled more than 10 times since 2004.
  • Chinese manufacturing scale: China now produces 80% of global solar panels, driving module prices from $76/W in 2004 to $0.16/W today.
  • Policy acceleration: German Energiewende, US ITC, and China’s Five-Year Plans created demand that funded scale that cut costs that created more demand.
Key Insight
Solar is the first energy technology where the cost curve has followed a learning rate — not a resource curve. Oil gets more expensive as easy reserves deplete. Solar gets cheaper the more you build.

The cost decline was structural, not cyclical — it will not reverse.

The Coal Crossover — When Solar Won

2020 was the year solar became cheaper than new coal — everywhere on Earth.

In 2020, utility-scale solar LCOE fell below new-build coal globally for the first time. By 2024, solar at $29/MWh is cheaper than the operating cost of existing coal plants in most markets — meaning it is now cheaper to build new solar than to keep running paid-off coal plants.

Why It Matters
This crossover is permanent and accelerating. No forecast credibly projects coal becoming cost-competitive with solar again. Every coal plant built today is a stranded asset within its own operating lifetime.

The economics of fossil fuel electricity generation are now structurally broken relative to solar.

The Nuclear Problem

While solar fell 89%, nuclear new-build costs rose — moving in the opposite direction.

New nuclear costs $150–$196/MWh — 5–6× the cost of solar. Hinkley Point C in the UK is now projected at £46 billion for 3.2 GW — that same investment would buy over 150 GW of solar.

  • Nuclear construction time: 14–20 years average for recent projects
  • Solar utility project construction: 6–18 months
  • Small Modular Reactors (SMRs) may change this — but none are commercially deployed yet

Nuclear’s value is grid stability and baseload — not cost competitiveness with solar.

Macro Takeaway — 5 to 10 Year Outlook

Solar Will Not Stop Getting Cheaper

Wright’s Law projects another 40–50% cost reduction by 2035 as production scales.

BloombergNEF projects solar LCOE falling to $15–$20/MWh by 2030. At that price, solar becomes the dominant source of new electricity generation on every continent.

The New Constraint: Storage

Cheap solar solves generation. It does not solve the 6 PM problem.

The next cost collapse race is in battery storage. Lithium-ion battery costs have fallen 97% since 2010 — tracking almost identically to solar’s learning curve. Grid-scale battery LCOE is now $100–$150/MWh and falling. Solar + storage is already the cheapest dispatchable electricity source in sun-rich markets.

The Geopolitical Risk

Energy independence — but a new dependency on China.

The West is trading oil dependence on OPEC for panel dependence on China. The US IRA and EU Solar Manufacturing Alliance are both attempts to build domestic manufacturing — but China’s 10-year head start in panel production and the critical mineral supply chain will not close quickly.


Sources & Methodology
  • IRENA — Renewable Power Generation Costs in 2024 (irena.org)
  • BloombergNEF — LCOE Data H2 2024 · Solar PV Technology Overview
  • Lazard — Levelized Cost of Energy Analysis v17.0 2024 (lazard.com)
  • IEA — World Energy Outlook 2024 · Renewables 2024 Report
  • Our World in Data — Solar PV Prices, Installed Capacity 2004–2024
  • Nature Energy — “Learning rates for solar PV” meta-analysis 2023
  • NREL — Annual Technology Baseline 2024 (nrel.gov)
Macro Discovery

Sukh Dhaliwal

Sukh Dhaliwal is the founder of Macro Discovery, an independent digital publication covering AI, technology, science, future trends, and global innovation through visual storytelling and data-driven analysis.

Join WhatsApp

Join Now

Join Facebook

Follow us

Leave a Comment