
The Countries Aging the Fastest —
and What Happens Next
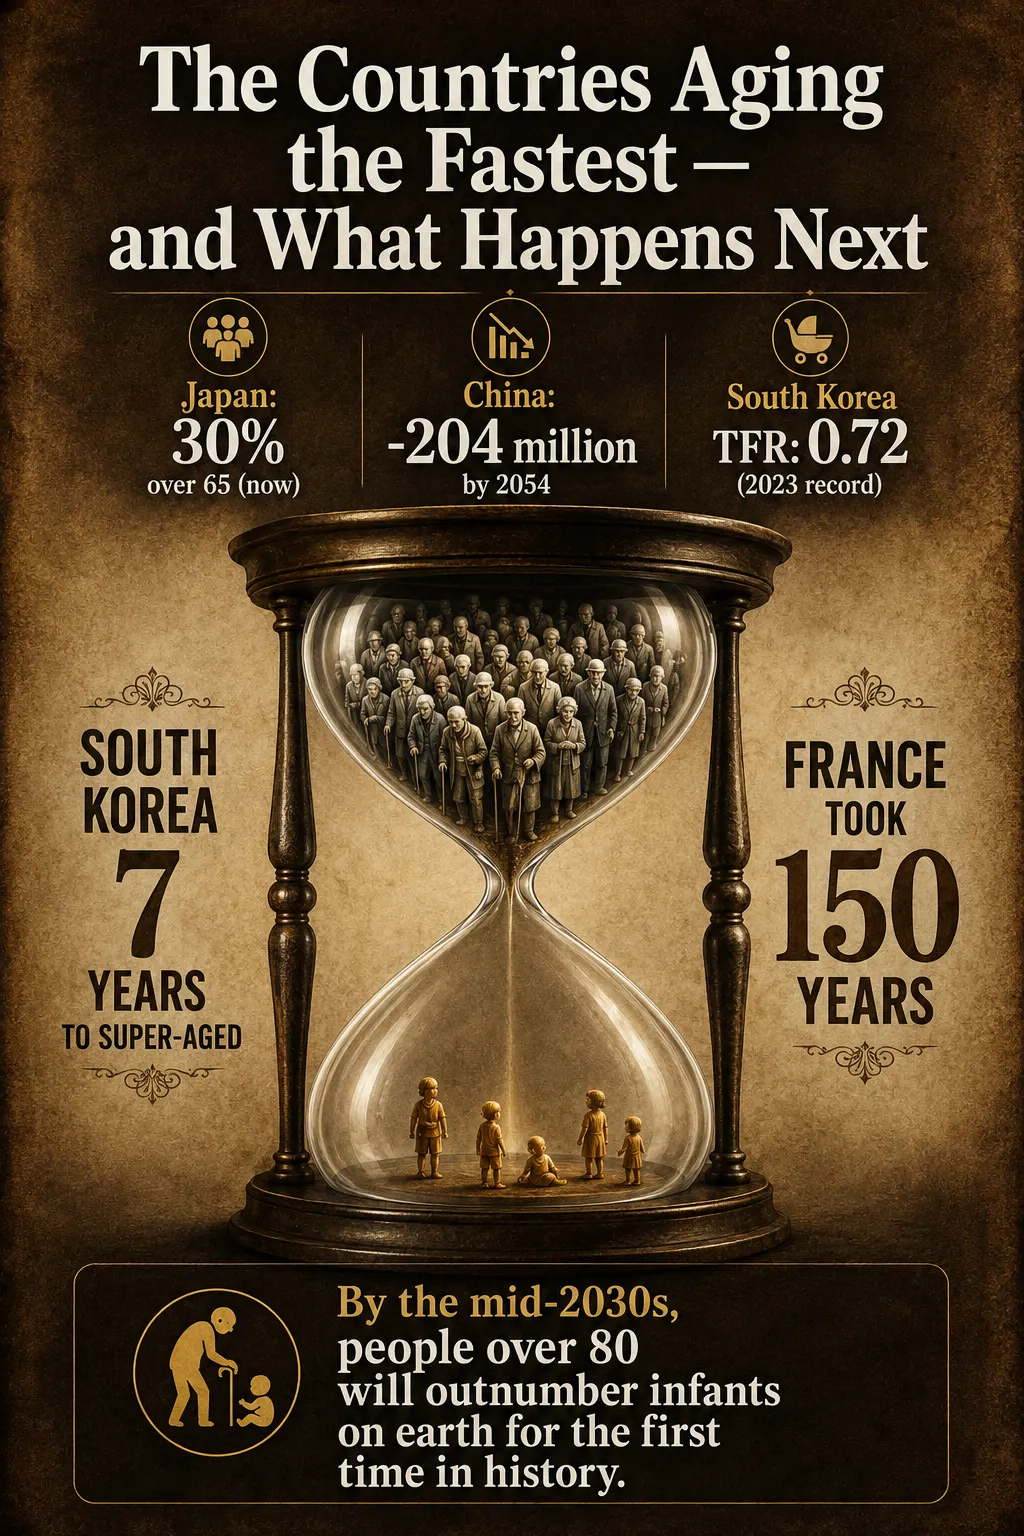
South Korea crossed into “super-aged” status — more than 21% of its population over 65 — by the end of 2024. That transition took France 150 years. South Korea did it in roughly 7. Japan already has 30% of its population over 65 and 10% over 80. China recorded its lowest birth count since records began in 1949 in 2025, while facing a projected loss of 204 million people by 2054. The OECD estimates that absent policy changes, aging pressures could add 180% of GDP to the debt burden of advanced economies. This is the most predictable crisis in human history — and most of the countries facing it have done very little to prepare.
- South Korea’s demographic transition is the fastest of any country in recorded history. It crossed the UN threshold for an “aged society” (14% of population over 65) in 2017, and became “super-aged” (21%+) by the end of 2024 — a compressed journey of approximately 7 years. France took over 150 years for the same transition; Japan took roughly 35. South Korea’s total fertility rate hit 0.72 in 2023, the lowest ever recorded for any country in modern history. By 2044, South Korea’s median age is projected to reach 56 years, and its workforce could halve within 40 years, according to Morgan Stanley. Sources: Morgan Stanley (primary · January 2025) · StatRanker/UN WPP 2024 · Korea Ministry of Data and Statistics.
- Japan is the world’s oldest large society and has been living with the consequences for two decades. Approximately 30% of Japan’s population is already over 65, and 10% are over 80 — making it the only large country where one in ten people is an octogenarian or older. In 2024, Japan recorded 686,061 births — the first time births fell below 700,000 since records began in 1899 — a drop of 5.7% in a single year. Japan’s population of approximately 124 million is projected to fall to 87 million by 2070 if current trends continue, at which point 40% of the population will be over 65. Sources: Japan Ministry of Health (2024 birth data) · UN WPP 2024 (primary) · Multiple 2025–2026 analyses.
- China faces the most consequential demographic crisis of any country in absolute scale. The UN World Population Prospects 2024 projects China will lose approximately 204 million people between 2024 and 2054 — the largest absolute population loss of any country in that period. China’s total fertility rate was 1.09 in 2024. Its 2025 birth count of approximately 7.92 million was the lowest since records began in 1949. The old-age dependency ratio is projected to rise from approximately 26% in 2022 to 96% by 2060. The critical vulnerability: China has no adequate social security or pension system for the mass of its population, and its contributor-to-retiree ratio has already fallen from 5:1 in 2000 to 2.8:1 in 2024. Sources: UN WPP 2024 (primary) · Pension Policy International (2026, citing China statistics).
- The economic consequences are already visible — and will become severe. The OECD estimated in its 2025 fiscal aging paper that absent policy changes, aging pressures could increase the public debt burden by an average of 180% of GDP across G20 advanced economies. The EBRD’s Transition Report 2025–26 (primary) found that declining working-age populations will reduce annual GDP per capita growth in Emerging Europe by an average of approximately 0.4 percentage points between 2024 and 2050. Italy’s pension system already consumes 16% of GDP. The Bank of Korea has warned that South Korea faces the risk of permanent recession by the 2040s without structural reforms. Sources: OECD fiscal aging paper (2025) · EBRD Transition Report 2025–26 (primary) · Multiple cited analyses.
- This crisis was entirely predictable — and the policy responses have mostly failed. South Korea spent over $200 billion on pronatal policies between 2006 and 2023 without reversing its fertility decline. Japan has pioneered robotics, automation, and policies to extend working lives, buying time but not solving the underlying dynamic. France is the one meaningful success story: its sustained pronatal policy since the 1920s has made it Europe’s highest-fertility country at approximately 1.8 children per woman, roughly 0.3 above the Western European average. Immigration — the most immediate lever — is politically contested in precisely the countries most demographically vulnerable. The UN projects that by 2054, immigration will drive population growth in 52 countries, including Australia, Canada, and the United States — but not in Japan, South Korea, or China. Sources: UN WPP 2024 (primary) · Works in Progress (December 2025) · StatRanker/UN WPP 2024.
Sources: UN World Population Prospects 2024 (primary) compiled by StatRanker (November 2025) and StatisticsTimes (September 2025). Japan ~30% from multiple sources citing UN WPP 2024 and Japanese government data (Zeihan / UPSC / multiple 2025–2026 analyses). Italy ~24% from multiple consistent sources. South Korea “super-aged (21%+) by end-2024” from Morgan Stanley (primary, January 2025). Germany ~23% from UPSC citing UN WPP 2024. China ~13% from UN WPP 2024 via multiple sources. Global average ~10% from UN WPP 2024 medium variant. India ~7% from UN WPP 2024. Niger/CAR under 3% from UN WPP 2024 via StatRanker. Bar lengths proportional to 65+ share; anchored at Japan.
| Country | TFR 2024–2025 | Median age | 65+ share | 2050 projection (65+) | Severity |
|---|---|---|---|---|---|
🇰🇷 South KoreaFastest transition in history |
0.80 (2025)* | ~44–45 | ~21% | ~40%+ — among world’s highest. Median age projected 56 by 2044. Workforce could halve in 40 years (Morgan Stanley). | ⚠ Historic crisis |
🇯🇵 JapanOldest large society |
1.2 (2025) | ~49–50 | ~30% | ~40%+. Population: 124M → projected 87M by 2070. 686,061 births in 2024 — lowest since 1899 records began. | ⚠ Severe · ongoing |
🇮🇹 ItalyOldest in Europe by 65+ share |
~1.24 | ~46–48 | ~24% | ~35%+. Pension spending already 16% of GDP. “Economic dark age” risk (Luiss University). Shrinking workforce + largest debt-to-GDP ratio in large EU economies. | Very High |
🇨🇳 ChinaScale is the defining factor |
1.09 (2024) | ~39–40 | ~13% | ~28%, possibly 46% by 2100. -204M population 2024–2054 (UN). Births 2025: 7.92M (lowest since 1949). Dependency ratio: 26% (2022) → 96% (2060). No adequate social security/pension system. | ⚠ Scale crisis |
🇩🇪 GermanyLargest European economy |
~1.4–1.5 | ~46–47 | ~23% | ~31%. Population peaked; immigration delaying decline. “Going from net payer to net taker in EU” as pension costs rise (Zeihan). East-West gap within Germany. | High |
🇹🇭 ThailandSoutheast Asia’s surprise |
~1.3–1.5 | ~40–41 | ~14% | ~30%+. Among fastest aging outside East Asia. Limited pension coverage, large informal sector. Middle-income trap worsened by demographic headwind. | High |
🇫🇷 FranceThe success story |
~1.8 | ~42–43 | ~21% | ~27–28%. Immigration + sustained pronatal policy since 1920s. Europe’s highest fertility. ~0.3 children above Western European average. Still aging but from better base. | Managed |
🇺🇸 United StatesImmigration buffer |
~1.6–1.7 | ~38–39 | ~17% | ~23%. Immigration drives population growth; projected to continue by 2054 (UN). Baby Boomer cohort now fully in retirement phase stressing Social Security. Better-positioned than East Asia/Europe. | Moderate |
🇮🇳 IndiaDemographic dividend window |
~1.9 | ~28–29 | ~7% | ~14%. Still in demographic dividend with large working-age population. TFR already below replacement nationally; Kerala and Goa already aging. Window closing over next 2–3 decades. | Young · Transitioning |
🇳🇬 Niger + Sub-Saharan AfricaWorld’s youngest |
5.0–7.0+ | ~15–18 | <3% | Will remain young for decades. Niger median age: 14.8 years (world’s lowest). Sub-Saharan Africa’s demographic dividend could be transformative if education and employment are scaled. | Young · Growing |
*South Korea TFR 2025: 0.80 (preliminary), up from 0.75 (2024) and 0.72 (2023 world record low) — Korea Ministry of Data and Statistics (May 2026, primary). Japan TFR 1.2 from Japan Times citing Japan government data (September 2025). China TFR 1.09 from multiple sources citing National Bureau of Statistics. Italy TFR ~1.24 from NCBI/WHO. Germany TFR from OECD. France TFR from Works in Progress (December 2025) citing INSEE. US TFR from CDC/NCHS. India TFR ~1.9 from UPSC citing UN. All 65+ shares and median ages from UN World Population Prospects 2024 (primary) via StatRanker (November 2025) and StatisticsTimes (September 2025). 2050 projections from UN WPP 2024 medium variant via Visual Capitalist (July 2025). Click column headers to sort.
Why Is South Korea’s Demographic Transition the Fastest in Recorded History?
South Korea’s demographic crisis is sui generis — a situation with no historical parallel in its speed. When demographers classify societies by their proportion of elderly residents, they use three thresholds: “ageing” (7%+ over 65), “aged” (14%+), and “super-aged” (21%+). France crossed the “ageing” threshold in 1864 and the “aged” threshold in 2000 — a journey of 136 years. Japan moved from “aged” to “super-aged” in roughly 35 years. South Korea became an “aged society” in 2017 and crossed into “super-aged” status by the end of 2024 — a transition of approximately 7 years, confirmed by Morgan Stanley in its January 2025 analysis (primary, directly fetched). The same report estimates that the Korean workforce could halve over the next 40 years.
The compression of this transition has multiple causes, all reinforcing each other. South Korea’s total fertility rate fell to 0.72 in 2023 — the lowest ever recorded for any country in modern demographic history. It has risen modestly since: 0.75 in 2024 and 0.80 in 2025 (preliminary), according to South Korea’s Ministry of Data and Statistics (May 2026). But even 0.80 is so far below replacement (2.1) that the structural direction remains unchanged. Simultaneously, life expectancy in South Korea is among the world’s highest at approximately 84 years. The combination — extremely few births and extremely long lives — creates a population pyramid that is inverting faster than demographers can update their models. By 2044, South Korea’s median age is projected to reach 56 years and its population shape to resemble what researchers have called a “cobra head” — large elderly cohorts atop a narrow younger base.
The structural root cause is specific to Korea’s social and economic model. The PMC-published research (2025) identifies key factors: extraordinarily high educational and housing costs; a culture of intensive competitive parenting that makes having children feel economically prohibitive; a marriage-birth link that is much stronger in Korea than in Western countries (only 3% of South Korean births occur outside marriage, compared to 40% in the US and 55% in Sweden); and rapid gains in women’s educational attainment and labour force participation that are not matched by equalisation of domestic labour. Single adults aged 25–34 have been increasing steadily — 65% of young Koreans in their 20s had no romantic partner as of 2018. When marriage collapses in a society where nearly all children are born to married couples, births collapse in almost direct proportion.
What Does Japan’s Experience Tell Us About Life at 30% Over 65?
Japan crossed 30% of its population over 65 around 2025, a milestone no large country had ever reached. Ten percent of its population is over 80 — meaning roughly one in ten Japanese people is an octogenarian or older. This is not a future projection. It is Japan’s present reality, and Japan has been managing the consequences for approximately two decades longer than any other large economy. In 2024, Japan recorded 686,061 births — the first time annual births fell below 700,000 since national records began in 1899, a drop of 5.7% from the year before. If current trends continue without policy change, Japan’s current population of approximately 124 million will fall to 87 million by 2070, by which point 40% of the population will be over 65.
Japan’s response to this challenge has been the world’s most extensive real-time experiment in managing demographic aging. It has extended working lives through policy and cultural norm-shifting, with many Japanese workers now continuing into their 70s. It has invested heavily in robotics and automation to compensate for labour shortages, leading to some of the world’s highest robot-per-worker ratios in manufacturing. It has incrementally reformed its pension system and raised the retirement age. It has encouraged female labour force participation, though progress on gender equity at home has been slower. And it has made limited but real openings in immigration policy — historically among the world’s most restrictive — through defined-term worker programmes.
The honest verdict on Japan’s management of demographic aging is: survival, not solution. GDP per capita has remained reasonable, unemployment has stayed low, and social stability has held. But economic growth has been structurally suppressed. The government debt-to-GDP ratio is the highest of any advanced economy in the world. Healthcare and pension obligations consume an ever-larger share of public spending. And no combination of robots, migrants, or policy changes has reversed the fundamental dynamic of far fewer people entering the workforce than leaving it. Japan demonstrates that a highly competent society can manage an aging crisis for decades without catastrophe. It does not demonstrate that the problem can be solved.
The UN World Population Prospects 2024 (primary) projects China will lose approximately 204 million people between 2024 and 2054 — the largest absolute population decline of any country in that period. China’s total fertility rate was 1.09 in 2024. In 2025, China recorded approximately 7.92 million births — the lowest since records began in 1949, down 17% from 9.54 million in 2024. The old-age dependency ratio is projected to rise from approximately 26% in 2022 to 96% by 2060. The contributor-to-retiree ratio has already fallen from 5:1 in 2000 to 2.8:1 in 2024 (China Pension Research Center data).
China’s One-Child Policy, enforced from approximately 1980 to 2015, is estimated to have reduced births by approximately 400 million over three decades — a demographic intervention without precedent in human history. It succeeded in its short-term goal of reducing population growth. Its long-term consequence is a demographic structure that looks, in the words of analyst Peter Zeihan, potentially “civilisation-crashing” — a vast elderly population, a shrinking workforce, an inadequate social security system, and a weak healthcare infrastructure, all hitting simultaneously.
Sources: UN WPP 2024 (primary) · Pension Policy International (2026, citing China statistics and China Pension Research Center) · Multiple 2025–2026 analyses.
What Are the Economic Consequences of Rapid Population Aging?
The economic consequences of demographic aging operate through several simultaneous channels. The most immediate is the labour force effect: fewer working-age people producing goods and services, which directly suppresses economic output. The EBRD’s Transition Report 2025–26 (primary, November 2025) found that declining working-age populations will reduce annual GDP per capita growth in Emerging Europe by an average of approximately 0.4 percentage points between 2024 and 2050. This sounds modest but compounds dramatically: 0.4 percentage points less growth per year over 25 years represents a cumulative GDP level approximately 10% lower than it would otherwise be.
The fiscal pressure is the second channel, and it is severe. As the proportion of retirees rises relative to workers, pension systems face a structural funding gap. Italy’s pension spending has already reached 16% of GDP — among the highest of any country in the world. The OECD estimated in its 2025 fiscal aging paper, drawing on UN WPP 2024 data, that absent policy changes, aging pressures could increase the public debt burden by an average of 180% of GDP across G20 advanced economies. The Bank of Korea has warned that South Korea faces the risk of permanent recession in the 2040s without structural reforms. Half of the world’s economies could face sovereign credit rating downgrades by 2050 due to aging-related fiscal pressures, according to Canada Horizons and McKinsey analyses — with Spain, France, Taiwan, China, and South Korea specifically identified as vulnerable.
The third channel, less discussed but equally important, is the geopolitical shift. Countries with large, young populations gain economic and military leverage over time. Countries whose populations are shrinking and aging face the opposite trajectory. China’s projected loss of 204 million people — more than the entire current population of Brazil — between 2024 and 2054 represents not just an economic challenge but a shift in the country’s long-term strategic position. The UN projects that China will experience “the largest absolute population loss” of any country in that 30-year window, followed by Japan (-21 million) and Russia (-10 million). The countries that will see the largest population growth in the same period are almost entirely in Sub-Saharan Africa — whose demographic trajectory runs directly counter to the aging crisis facing East Asia and Europe.
South Korea: Currently 3.9 working-age adults per person over 65. To maintain this ratio for 30 years, the fertility rate would need to rise to over 10 children per woman (Works in Progress, citing academic research). That is not going to happen. The ratio will fall sharply. The Bank of Korea warns of permanent recession by the 2040s.
China: Contributor-to-retiree ratio: 5:1 (2000) → 2.8:1 (2024) → declining. Pension deficits are already projected to triple by 2035 in high-aging provinces like Liaoning. Healthcare spending at 8.7% of GDP (2024) with a 30% increase in geriatric care hospital admissions over five years.
Italy: Pension spending at 16% of GDP. Already the highest in the OECD. One quarter of the population over 65. A shrinking working-age population paying for a growing retired one, within a currency union (the euro) that limits the option of inflation as fiscal relief.
OECD average: Old-age dependency ratio (65+ per 100 working-age people) has more than doubled between 1960 and 2022 (UN WPP 2024 data, OECD EcoScope November 2025). The trend is uniform across all OECD members — only the speed and starting point differ.
Sources: OECD EcoScope (November 2025) · EBRD Transition Report 2025–26 (primary) · Works in Progress (December 2025) · Pension Policy International (2026).
Can Pronatal Policies Actually Reverse the Decline — or Does Only Immigration Work?
South Korea spent what multiple analyses estimate at over $200 billion on pronatal policies between 2006 and 2023 — cash payments, childcare subsidies, parental leave extensions, housing support for families, tax incentives — without arresting the decline in its fertility rate until a small uptick in 2024–2025. The episode is the most expensive failed pronatal experiment in history. It did not fail because the policies were poorly designed. It failed because the structural reasons South Koreans are not having children — cost of housing, cost of intensive competitive education, the marriage-birth link, the gender division of domestic labour, extreme workplace hours culture — were not fundamentally addressed by transfer payments.
The counterexample is France. France launched an active pronatal campaign in the 1920s, following the catastrophic loss of young men in the First World War. Over a century of consistent policy — generous family-oriented tax breaks, strong child benefit payments, subsidised childcare, robust maternity employment protections, and a cultural normalisation of working motherhood — France has become Europe’s highest-fertility country at approximately 1.8 children per woman, roughly 0.3 above the Western European average. The Franco-Spanish border and the Franco-Italian border both show a clear fertility step-up on the French side. The lesson is not that pronatal policy cannot work. It is that it requires a century of sustained commitment to structural enablement, not a decade of cash transfers.
Immigration is the most immediate demographic lever for aging societies. The UN WPP 2024 (primary) projects that by 2054, immigration will drive population growth in 52 countries, including Australia, Canada, and the United States. In Europe, immigration has already postponed population peaks in Germany, Italy, and Russia that would otherwise have occurred earlier. But immigration cannot fully substitute for fertility in countries with very low rates: the working-age immigrants also age, their children’s fertility tends to converge toward host-country norms, and the scale of immigration needed to offset very low fertility would be politically and logistically unrealistic. Japan’s 2.3% immigrant share, South Korea’s 2.3%, and China’s near-zero immigrant share mean that the three countries with the most severe aging trajectories are also the three least open to the fastest demographic fix available.
France’s pronatal model (TFR ~1.8, Europe’s highest): Century-long programme combining generous child benefits, subsidised childcare, strong maternity employment protections, family-oriented tax breaks. The French-Spanish border and French-Italian border show visible fertility step-ups on the French side. Works in Progress (December 2025) notes South Tyrol (northeast Italy) has fertility higher than the rest of Italy, driven by functional childcare and €200/month payments for children under 3.
Japan’s work-extension model: Policies to keep workers in the labour force through their 60s and 70s, combined with robotics and automation to maintain productivity per worker. Manages the labour shortage without solving the demographic problem, but buys time.
Immigration (Australia, Canada, US model): The UN projects that by 2054, immigration will drive population growth in all three. Canada’s managed immigration system, targeting working-age professionals, has maintained its demographic balance better than most peer economies. Australia and New Zealand similarly.
Small-scale local successes: Nagi in rural Japan raised its TFR from 1.4 (2005) to above 2.0 through focused childcare investment and community support. Suggestive that local policy can work where national policy has not, but scaling remains unproven.
South Korea’s 2024–2025 uptick (TFR 0.75 → 0.80): Marriage rates rose 14.8% in 2024 and 8.1% in 2025. A post-pandemic cohort delay may be partially resolving. Government projects TFR crossing 1.0 by 2031. Whether this is the start of a structural reversal or a temporary fluctuation remains the key unanswered question in global demography.
Sources: Works in Progress (December 2025) · UN WPP 2024 (primary) · Korea Ministry of Data and Statistics (May 2026) · Japan Times (September 2025).
What Does the World Look Like in 2050 When Half the Global Population Is Over 35?
The UN World Population Prospects 2024 (primary) contains several milestones whose significance is easy to understate. By the mid-2030s, there will be more people aged 80 and older in the world than there are infants. By the late 2070s, the global population aged 65 and older (projected at 2.2 billion) will surpass the number of children under age 18. These are not projections from the far future. They are the demographic consequences of fertility decisions already made. The people who will be 80 in 2035 are already alive; they were born in the mid-1950s during the post-war baby boom. Their aging is a certainty, not a scenario.
The shape of the global population divide in 2050 will be radically different from today. South Korea, Japan, Taiwan, and Hong Kong are projected to have approximately 40% or more of their populations over 65 — a level of population aging without historical precedent for large, complex economies. China may have 28% over 65, with a trajectory toward 46% by 2100. Meanwhile, Sub-Saharan Africa will remain young, growing, and demographically distinct. Niger’s current median age of 14.8 years means the median Nigerian is not yet a teenager. The demographic dividend of Sub-Saharan Africa — a large and growing working-age population — is a potential engine of economic growth that could reshape the global economy, if education and employment infrastructure scale to meet it.
The deepest consequence of this divergence is geopolitical. Economic power tends to follow demographic power over long time horizons. A world in which Japan, South Korea, and Germany have 40%+ of their populations over 65 while Nigeria, Ethiopia, and the Democratic Republic of Congo have median ages under 20 is a fundamentally different geopolitical map from the one that produced the current global order. The institutions built in the post-war period — the IMF, World Bank, UN Security Council, G7 — reflect the demographic and economic realities of the mid-20th century. By 2050, those realities will have changed so fundamentally that the question is not whether the global order will change, but how orderly that change will be.
- United Nations — “Ageing” (primary · un.org · directly fetched · UN WPP 2024 basis · 60+ to 2.1B by 2050 · 65+ surpasses under-18 by late 2070s · 80+ outnumbers infants by mid-2030s · life expectancy 73.3→77.4 · 63 countries peaked · China -204M · Japan -21M · Russia -10M · immigration in 52 countries by 2054)
- Morgan Stanley — “Korea Faces Its Aging Crisis” (primary · January 14, 2025 · directly fetched · super-aged status end-2024 · UN 20%+ definition · 7 years vs 11 for others · workforce could halve in 40 years · world’s lowest fertility rate)
- Pension Policy International / International Banker — “The World Is Ageing — What Are the Macroeconomic Implications?” (March 2026 · China births 2025: 7.92M down 17% from 9.54M · old-age dependency 26%→96% by 2060 · EBRD Transition Report 2025–26 cited · -0.4pp GDP · UN WPP 2024 basis)
- DD News — “South Korea’s birthrate, the world’s lowest, rises again” (May 26, 2026 · Korea Ministry of Data and Statistics primary · TFR 2025: 0.80 preliminary · up from 0.75 (2024) and 0.72 (2023) · Seoul 0.63 in 2025 · marriages +8.1% 2025 +14.8% 2024 · govt projection TFR >1.0 by 2031)
- StatRanker — “Top 20 Countries with Fastest Population Aging (2015–2025)” (November 2025 · UN WPP 2024 basis · South Korea fastest · 5–8pp rise in 65+ share per decade · France 150 years · Japan 35 years · South Korea 7 years · East Asia + Eastern Europe + Latin America dominate)
- OECD EcoScope — “The Fiscal Impact of Population Ageing” (November 7, 2025 · UN WPP 2024 basis · old-age dependency ratio doubled 1960–2022 · 65+ grew 2.2%/yr · working-age 0.9%/yr · OECD paper Koutsogeorgopoulou + Morgavi 2025 · 180% GDP debt estimate cited)
- Mind Body Globe — “The Baby Bust: 6 Countries That Are Running Out of People” (March 2026 · Japan 686,061 births 2024 · -5.7% · first below 700,000 since 1899 · population 124M→87M by 2070 · Italy 24% over 65 · pension 16% GDP · Lithuania collapse · South Korea TFR crisis)
- Japan Times — “South Korea’s baby bust threatens its demographic future” (September 22, 2025 · Japan TFR 1.2 · South Korea TFR 0.75 confirmed · OECD average 1.5 · housing + education costs analysis)
- Morgan Stanley — South Korea Population Decline (January 2025 · primary · directly fetched · super-aged status · workforce halving · structural reforms · market reforms for growth)
- Works in Progress — “Two Is Already Too Many” (December 2025 · France pronatal campaign since 1920s · Europe’s highest fertility ~1.8 · +0.3 above Western avg · French border fertility step-up · South Tyrol €200/month per child · South Korea marriage collapse · 3% out-of-wedlock births · Nagi Japan TFR 1.4→2.0)












