
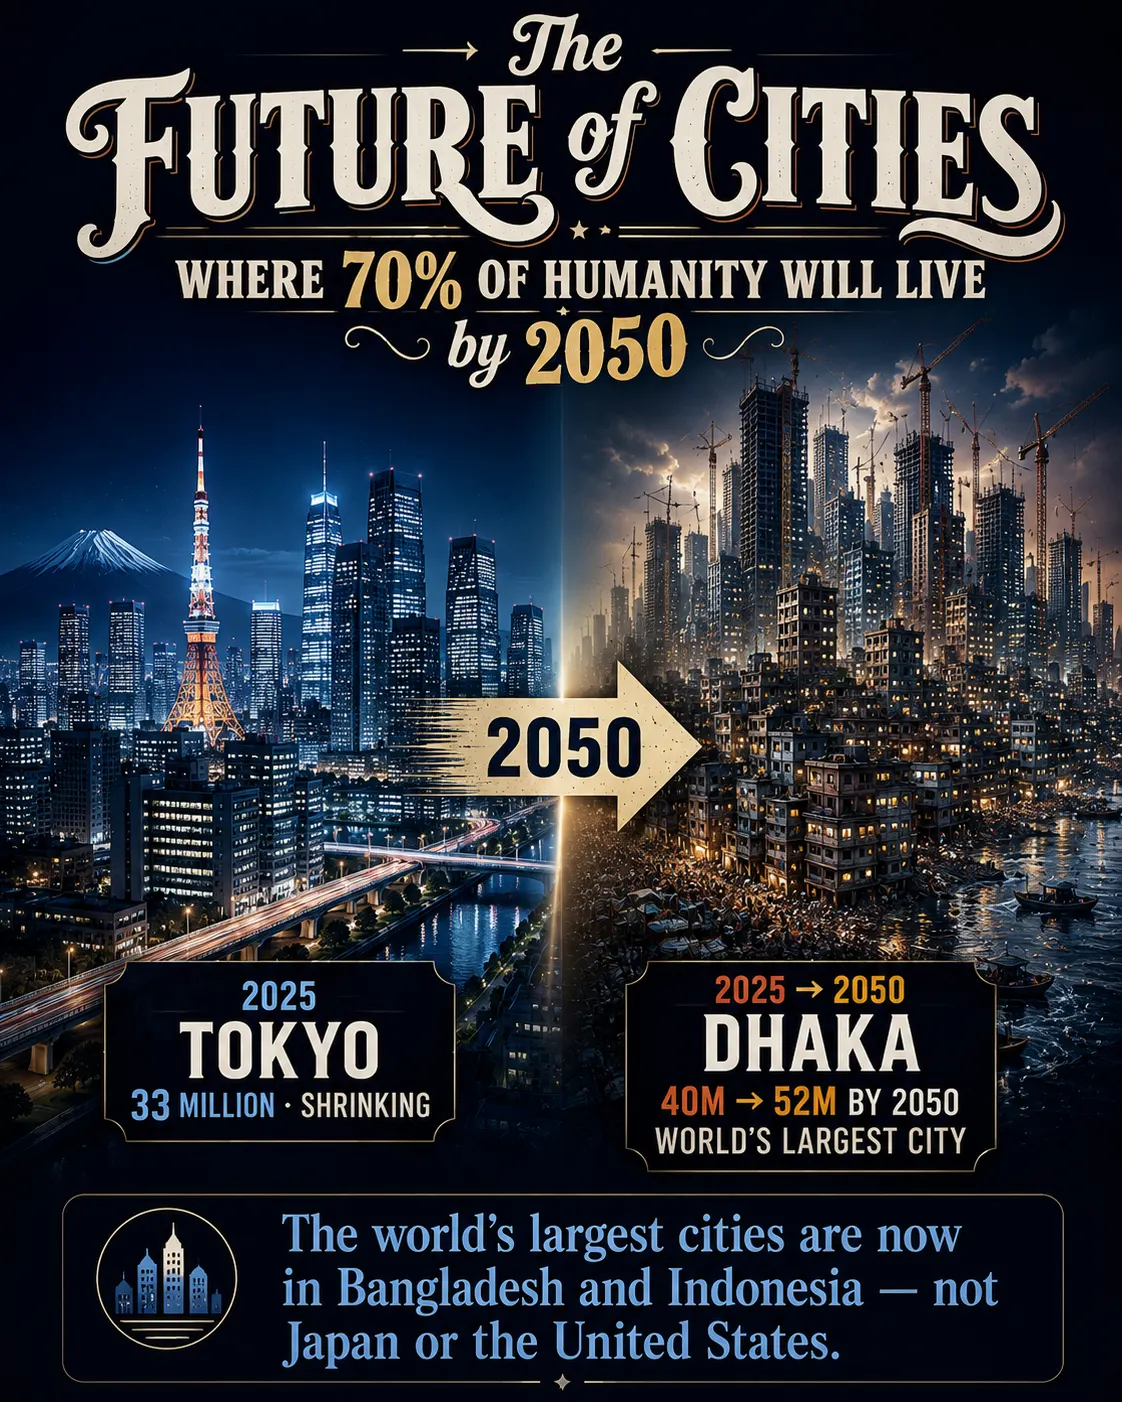
The Future of Cities —
Where 70% of Humanity Will Live by 2050
For the first time in history, Jakarta — not Tokyo — is the world’s most populous city, with nearly 42 million residents. By 2050, Dhaka will surpass it at an estimated 52 million. Two-thirds of humanity will live in urban areas by 2050. One billion people already live in areas prone to severe flooding, half of them in cities. More than 1.12 billion live in slums without basic services. The megacities most people picture — New York, London, Tokyo — are largely plateauing or shrinking, while the real story of 21st-century urbanization is playing out in cities most people in the West have never visited: Dhaka, Luanda, Dar es Salaam, Addis Ababa. The shape of human civilization is being decided in places that rarely make the front page.
- The world’s urban population is on track to reach approximately two-thirds of humanity by 2050 — adding 1.7 billion urban residents from today’s baseline. The UN World Urbanization Prospects 2025 (primary, November 18, 2025) finds that cities now house 45% of the global population, and urban areas overall (cities plus towns) house approximately 58% of 8.2 billion people. By 2050, this is projected to reach approximately 67% (WUP 2025) to 70% (SDG 11 Report 2025, broader definition). Nearly all future urban growth — approximately 90% — will occur in Asia and Africa. The urban population of South America has more than tripled since 2000 (+224%), while Europe is the only continent where total prison and urban population growth has slowed, with some cities actively shrinking.
- For the first time, Jakarta has overtaken Tokyo as the world’s largest city — and Dhaka is on course to become the largest by 2050. The WUP 2025 report (primary, directly confirmed from UN DESA press release, November 18, 2025) confirmed that Jakarta, Indonesia, is now the world’s most populous city with nearly 42 million residents. Dhaka, Bangladesh, is second with almost 40 million — having risen from 9th place — and is projected to become the world’s largest city by 2050 with an estimated 52 million residents. Tokyo, which held the top position throughout the late 20th century and early 2000s, fell to third at 33.4 million. Cairo (Egypt) is the only non-Asian city in the current top 10. By 2050, four new megacities are projected to emerge: Addis Ababa (Ethiopia), Dar es Salaam (Tanzania), Hajipur (India), and Kuala Lumpur (Malaysia).
- The most counterintuitive finding of WUP 2025: the future of urbanisation is not in megacities but in small cities most people have never heard of. Of the 12,000 cities analysed in WUP 2025, 96% have fewer than one million inhabitants, and 81% have fewer than 250,000. Small and medium-sized cities are growing at a faster pace than megacities, particularly in Africa and Asia. More of the world’s urban population lives in these small cities than in megacities. Seven countries — India, Nigeria, Pakistan, the Democratic Republic of Congo, Egypt, Bangladesh, and Ethiopia — will add over 500 million urban residents between now and 2050, accounting for more than half of all new city dwellers. Most of this growth is not in those countries’ largest cities but in secondary and tertiary urban centres. Source: WUP 2025 (primary) · JRC (November 2025).
- 1.12 billion people already live in slums or informal settlements without basic services — and urbanisation is outpacing infrastructure investment. The UN SDG 11 Report 2025 finds that 1.12 billion people live in informal settlements without adequate housing, sanitation, water, or electricity. Up to 3 billion people worldwide struggle to afford housing. In low-income countries, more than 60% of all city residents live in informal settlements (World Resources Institute, November 2025). The global average housing cost burden was 31% of household income in 2023 (from 124 countries). Built-up land has been expanding at twice the rate of population growth since 1975 (JRC, citing WUP 2025) — meaning urban areas are sprawling outward faster than people are moving into them, creating infrastructure inefficiency and environmental pressure simultaneously. Sources: SDG 11 Report 2025 · JRC (November 2025) · WRI (November 2025).
- Urban areas are simultaneously the front line and a primary driver of the climate crisis — and the populations at greatest risk are those with the least power to adapt. The UN-Habitat World Cities Report 2024 (primary) describes cities as “both victims of climate change and among its worst perpetrators.” As of 2025, one billion people live in areas prone to severe riverine flooding; half of them are in cities (SDG 11 Report 2025). By 2040, more than 2 billion urban residents could face an additional temperature rise of at least 0.5°C. Thirty-six per cent of the global urban population may endure annual mean temperatures of 29°C or higher. Informal settlements — where 1.12 billion people live — are systematically located in the most environmentally vulnerable areas: floodplains, hillsides, and coastal zones. In low-income countries, people with disabilities are up to four times more likely to die in a climate-related disaster than other groups (UN-Habitat 2024). Source: UN-Habitat World Cities Report 2024 (primary) · SDG 11 Report 2025.
Source: UN World Urbanization Prospects 2025 (primary · UN DESA · November 18, 2025). Figures confirmed directly from UN DESA press release (directly fetched): “Jakarta (Indonesia) is now the world’s most populous city, with nearly 42 million residents, followed by Dhaka (Bangladesh) with almost 40 million, and Tokyo (Japan) with 33 million.” New Delhi, Shanghai, Guangzhou, Manila, Kolkata, Seoul from Al Jazeera citing WUP 2025 (November 26, 2025). Cairo from UNRIC citing WUP 2025 (July 2026). Cairo is the only non-Asian city in the top 10 (WUP 2025). 9 of top 10 megacities are in Asia. All figures are urban agglomeration populations, not administrative city boundaries. Dhaka figure varies between sources (Destatis: 36.6M; WUP 2025 press release: “almost 40M”) due to different urban boundary definitions; WUP 2025 primary value used here.
| City / Country | Pop 2025 | Pop 2050 (proj.) | Trend | Key story |
|---|---|---|---|---|
🇧🇩 DhakaBangladesh · Projected #1 by 2050 |
~40M | ~52M | ▲▲▲ Explosive | Was 9th in global rankings. Now 2nd. Projected world’s largest by 2050. Driven by 300,000–500,000 rural migrants annually, many displaced by flooding, sea level rise, and riverbank erosion — climate migration at scale. One of the fastest rates of urban growth in the world. |
🇮🇩 JakartaIndonesia · Current #1 |
~42M | ~50M+ | ▲▲ Strong growth | World’s largest city 2025. Projected to grow 10M more by 2050 despite sinking land. Up to 25% of city could be underwater by 2050 from subsidence and sea level rise. Indonesia is building Nusantara, a new capital on Borneo, but economic gravity keeps pulling people to Jakarta. |
🇨🇳 ShanghaiChina · #5 currently |
29.6M | ~30M+ | Slow growth | Growing but slowing as China’s urban population approaches saturation and fertility decline hits. Represents the trajectory of Chinese megacities broadly. Chengdu and Mexico City have actually seen population decreases despite prior rapid growth. |
🇯🇵 TokyoJapan · Was #1 for decades |
33.4M | ~29M est. | ▼ Declining | World’s largest city for decades. Fell to #3 in 2025. Projected to fall to #7 by 2050. Japan’s sub-replacement fertility and aging population are beginning to translate into absolute population decline. Tokyo exemplifies the plateau of wealthy East Asian megacities. |
🇦🇴 LuandaAngola · Africa’s fastest-growing |
~11.4M | ~20.2M | ▲▲▲ 16× in 25 years | Was 715,000 in 2000, two years before Angola’s long civil war ended. Has grown 16-fold in 25 years. Expected to double again by 2050. One of the fastest absolute growth rates of any city on earth, driven by post-war rural migration and high natural increase. |
🇳🇬 LagosNigeria · Africa’s largest economy |
~12–17M | ~35M+ | ▲▲ Very fast | Largest city in sub-Saharan Africa. Nigeria is projected to become the world’s third most populous country by mid-century. Lagos represents the trajectory of African megacity growth: rapid, informal-settlement-dominated, and infrastructure-deficient relative to growth rate. |
🇦🇬 Addis AbabaEthiopia · Future megacity |
~5–6M | >10M | ▲ Becoming megacity | Projected to surpass 10 million inhabitants by 2050, joining the megacity threshold (WUP 2025 primary). Reflects Ethiopia’s rapid urbanisation driven by economic growth and rural-to-urban migration across East Africa. |
🇰🇷 Dar es SalaamTanzania · Future megacity |
~7M | >10M | ▲ Becoming megacity | Projected to surpass 10 million inhabitants by 2050 (WUP 2025 primary). One of Africa’s fastest-growing large cities. Tanzania’s population is projected to nearly double by 2050, with most growth occurring in urban areas. |
🇺🇸 New YorkUSA · Major plateauing |
~18.5M | ~17.5M est. | Slight decline est. | Projected to decline approximately 5% by 2050. Like other wealthy Western megacities, New York is approaching demographic plateau. Remains a global economic powerhouse but no longer a growth story in population terms. |
🇫🇷 Paris + MadridWestern Europe |
~9.3M / 5.5M | ~Same | Plateau | Among major European cities projected to remain close to current sizes by 2050 (WUP 2025). Istanbul, Moscow, and London are each projected to add around 1 million residents. Western European cities represent demographic stability, not growth — the urbanisation story there is largely complete. |
Sources: UN World Urbanization Prospects 2025 (primary · November 18, 2025 · UN DESA) · UN DESA Press Release (directly fetched · November 18, 2025) · UNRIC citing WUP 2025 (July 2026) · Al Jazeera citing WUP 2025 (November 26, 2025) · Destatis citing WUP 2025 (January 2026) · Visual Capitalist / WUP 2025 (February 2026). Dhaka projected #1 with 52M by 2050 from Destatis (Jan 2026). Luanda 715,000 (2000) → 11.4M (2025) → 20.2M (2050) from UNRIC. New megacities by 2050 (Addis Ababa, Dar es Salaam, Hajipur, Kuala Lumpur) from UN DESA press release primary. Tokyo projected #7 by 2050 from UNRIC. New York −5% from Visual Capitalist. Paris and Madrid near-stable from UNRIC. Click column headers to sort.
Why Has Jakarta Overtaken Tokyo — and What Does That Tell Us About Where Urbanisation Is Heading?
For most of the modern era of urban data, Tokyo has been the world’s largest city. It held that distinction through the late 20th century and into the 2000s, reflecting Japan’s extraordinary post-war economic growth and the concentrated development of its capital region. In 2025, the UN World Urbanization Prospects 2025 (primary, November 18, 2025) confirmed that Jakarta, Indonesia, has overtaken Tokyo with nearly 42 million residents — making it the world’s first megacity to cross that threshold in the Global South. Dhaka, Bangladesh, has simultaneously risen from 9th to 2nd globally with almost 40 million residents, having spent decades as a secondary entry in global city rankings.
The underlying pattern is straightforward. Tokyo’s population is beginning to decline, as Japan’s sub-replacement fertility rate (1.2 in 2025, the third consecutive year of record-low births) translates into absolute population loss in its urban agglomerations. The same dynamic is affecting Seoul, Osaka, and other wealthy East Asian cities: they are approaching demographic plateau. Meanwhile, Jakarta is drawing millions of internal migrants from across the Indonesian archipelago of 17,000 islands, and Dhaka is experiencing one of the fastest urban growth rates in the world, receiving approximately 300,000 to 500,000 new residents per year, many of them displaced by climate-related flooding, sea-level rise, and riverbank erosion in Bangladesh’s highly vulnerable delta geography.
The shift in the largest-city rankings is a leading indicator of a broader demographic rebalancing. The nine of ten top cities that are in Asia, and Cairo as the only representative of Africa, Africa’s Middle East, and the Global South outside Asia, reflect where economic and demographic gravity is concentrated today. By 2050, with 13 of the 50 largest cities in Africa (up from a handful today), the rebalancing will have gone further still. Tokyo’s projected fall from 3rd to 7th place by 2050 is not a story of Tokyo’s failure; it is a story of other cities growing faster in populations where fertility and migration trends are working in the opposite direction. The cities rising to the top are those in countries with young populations, high fertility rates, and rapid economic growth that is pulling rural residents into urban labour markets at a pace the cities’ infrastructure has not kept pace with.
Who Are the 1.12 Billion People Living in Informal Settlements — and What Does Their Housing Actually Look Like?
When the UN SDG 11 Report 2025 states that 1.12 billion people live in slums or informal settlements, the abstraction of the number conceals the texture of the reality. These are not temporary situations awaiting resolution. In cities like Dharavi in Mumbai, Kibera in Nairobi, or Cite Soleil in Port-au-Prince, informal settlements have existed for generations and house densities that can exceed 250,000 people per square kilometre — among the highest on earth. They are typically characterised by insecure land tenure (residents do not own or have legal rights to the land they occupy), inadequate or absent sanitation (shared toilets among dozens of households, or open defecation), limited or no clean water access, overcrowded dwellings with structural fragility, and no formal electricity supply (though informal connections are common). In low-income countries, more than 60% of all city residents live in such conditions (World Resources Institute, November 2025) — meaning informal settlement is not the exception in these cities but the norm.
The climate dimension makes this structural reality acutely urgent. Informal settlements are systematically located in the most hazardous urban environments: floodplains, along riverbanks, on steep hillsides vulnerable to landslides, in coastal zones subject to storm surge, and in heat-trapping low-altitude areas with no green space. When climate-related disasters strike a city, informal settlements bear a disproportionate impact. The UN-Habitat World Cities Report 2024 (primary) documents that informal settlements are “among the most exposed to disasters and other impacts” precisely because planning and infrastructure investments historically excluded them, leaving residents in the most dangerous geography with the least protection.
The paradox of urban climate adaptation is that interventions designed to protect cities can harm their most vulnerable residents. When flood defence infrastructure is built, when hillsides are stabilised against landslide, when coastal zones are protected — the improved land value frequently triggers eviction of informal settlement communities who have occupied that land without formal tenure. The people who most need climate protection are also the people most likely to be displaced by climate protection measures. This is not incidental; it is a structural feature of urban land markets in which informal residents hold no legal claim to the land on which their homes sit. The UN-Habitat 2024 report explicitly warns against “unintended and exclusionary consequences” of climate adaptation that fails to incorporate the perspectives and rights of informal settlement communities.
The affordability gap: The global average housing cost burden was 31% of household income in 2023 (UN SDG 11 Report 2025, from 124 countries). A widely cited rule of thumb holds that housing is affordable when it consumes 30% or less of income. The global average is already at this threshold — meaning a large fraction of the world’s population already exceeds it, particularly in high-cost cities where housing markets are unresponsive to demand from lower-income residents.
Built-up land is expanding at twice the rate of population growth (JRC/WUP 2025) — sprawl is outpacing densification. Countries in Central and Southern Asia remain the most spatially efficient, using the least built-up land per person. Europe, North America, Australia, and New Zealand have seen the most dramatic per-person increases in built-up land. Urban sprawl has its own cost: expanding cities require proportionally more infrastructure (roads, pipes, transit, power lines) per person than dense ones. The UN DESA note that “providing public transportation, housing, electricity, water and sanitation for a densely settled urban population is typically cheaper and less environmentally damaging than providing a similar level of services to a dispersed rural population” — and that this advantage is squandered when cities sprawl.
The 7 key countries of urban growth: India, Nigeria, Pakistan, the Democratic Republic of Congo, Egypt, Bangladesh, and Ethiopia will collectively add over 500 million urban residents by 2050 — more than half of all new city dwellers globally (JRC, November 2025). Most of this growth will not occur in those countries’ largest cities but in smaller cities and towns. These are precisely the cities with the least pre-existing infrastructure, planning capacity, and fiscal revenue to absorb such growth.
Sources: UN SDG 11 Report 2025 · JRC / EU Commission (November 2025) · WUP 2025 (primary) · UN DESA.
Why Is Dhaka Becoming the World’s Largest City — and Why Is That Both a Story of Hope and Crisis?
Dhaka’s projected rise from second to first place globally by 2050 — reaching an estimated 52 million residents — is driven by the convergence of several forces that are simultaneously a story of economic development and environmental catastrophe. Bangladesh has experienced remarkable economic growth over the past three decades, transforming from one of the world’s poorest countries into a substantial manufacturing economy, primarily through garment exports. Dhaka is the centre of that economy: hundreds of thousands of workers migrate from rural Bangladesh to the capital each year in search of employment in the garment industry, construction, and the expanding service sector.
The climate dimension, however, is inseparable from Dhaka’s growth story. Bangladesh sits in one of the world’s most flood-vulnerable delta systems, formed by the confluence of the Ganges, Brahmaputra, and Meghna rivers. As noted in UNRIC’s July 2026 analysis of WUP 2025, Dhaka’s growth has been partly driven by people displaced by rising sea levels, riverbank erosion, and soil salinisation. These are people who have not chosen urban life from among multiple attractive options; they have been pushed out of rural livelihoods by environmental degradation that is accelerating. Between 300,000 and 500,000 new arrivals per year means a city adding the equivalent of a mid-sized European city every twelve to twenty-four months. Dhaka’s infrastructure — roads, water, sanitation, electricity, housing — has not kept pace, producing one of the most congested, most polluted, and most flood-prone urban environments on earth.
Dhaka illustrates the central paradox of 21st-century urbanisation: the cities growing fastest are often the least equipped to handle that growth. High-income cities with shrinking populations have surplus infrastructure, fiscal capacity, planning expertise, and institutional depth to manage change. Low-income cities adding millions of residents annually have none of these in adequate supply. The result is a feedback loop: inadequate infrastructure makes life in informal settlements more dangerous and less productive, reducing the economic gains from urbanisation, limiting tax revenue, and constraining the public investment that would improve conditions — while the city continues to grow regardless, because the alternatives (rural Bangladesh in a changing climate) are worse.
What Happens When a City Sinks Into the Ocean — Jakarta and the New Capital Question?
Jakarta’s situation is the world’s most dramatic case of a megacity confronting existential climate risk. The city faces two simultaneous threats: sea level rise from global warming, and land subsidence caused by excessive groundwater extraction over decades. Parts of North Jakarta are already below sea level, and estimates suggest that up to one quarter of the city could be underwater by 2050. The problem is so serious that the Indonesian government has been constructing a new purpose-built capital city — Nusantara, in East Kalimantan province on the island of Borneo — to house government ministries, the parliament, and administrative functions that currently occupy Jakarta.
But Nusantara illustrates a fundamental truth about cities: governments can move buildings, but they cannot easily move economies. The UN WUP 2025 projects that Jakarta will have approximately 10 million more residents by 2050 even as the capital functions transfer to Nusantara. The economic infrastructure — the port, the factories, the financial institutions, the supply chains, the informal markets, the housing for workers at every income level — remains in Jakarta. People follow economic opportunity, not government declarations. What Nusantara may achieve is some reduction in pressure on Jakarta’s most overloaded public services, but the fundamental growth dynamic of one of the world’s largest cities is unlikely to reverse because of a capital relocation.
Jakarta is not the only sinking city. Houston, Miami, New Orleans, Amsterdam, Bangkok, Ho Chi Minh City, and Shanghai all face some combination of land subsidence and sea level rise. Many of the world’s largest port cities are at or near sea level for the same reason that made them great trading cities: easy access to the sea. As climate change advances, the decisions made in the next decade about flood defence infrastructure, building codes, land use planning, and managed retreat from the most vulnerable areas will determine which cities remain viable in 2100 and which face partial or total abandonment. The costs involved — trillions of dollars of existing assets, hundreds of millions of residents — make these among the most consequential infrastructure decisions in human history.
Flooding (2025 baseline):
· 1 billion people live in areas prone to severe riverine flooding
· Half of them are in cities
· Figure from SDG 11 Report 2025 ✓
Heat (by 2040 projection):
· More than 2 billion urban residents could face an additional temperature rise of at least 0.5°C
· 36% of the global urban population may endure annual mean temperatures of 29°C or higher
· Urban heat island effect amplifies baseline warming in cities
· Figure from SDG 11 Report 2025 ✓
Informal settlements and climate risk:
· 1.12 billion people in informal settlements (SDG 11 Report 2025)
· In low-income countries, 60%+ of city residents in informal settlements (WRI, Nov 2025)
· Informal settlements systematically located in highest-risk geography
· People with disabilities up to 4× more likely to die in climate disasters (UN-Habitat 2024, primary)
Who bears the burden:
The UN-Habitat World Cities Report 2024 (primary) is explicit: “Climate change is in many ways exacerbating existing inequalities, as the urban poor and other marginalised groups and communities find themselves facing its most extreme impacts with least resources.” This is not coincidence. It is the predictable outcome of land markets that systematically exclude lower-income residents from safe, well-serviced urban land.
The Jakarta case in numbers: Jakarta, the world’s largest city at 42 million people, sits on land that is subsiding at rates of up to 25 cm per year in some areas, while sea levels are rising. Up to 25% of the city could be underwater by 2050. Indonesia is building a new capital on Borneo. But the UN projects 10 million more people will be living in Jakarta by 2050 regardless.
Sources: SDG 11 Report 2025 · UN-Habitat World Cities Report 2024 (primary) · WUP 2025 (primary) · WRI (November 2025).
Is Urbanisation Good or Bad — and What Does the Evidence Actually Show?
The evidence on urbanisation is more positive than the housing crisis and climate risk statistics alone suggest. Cities are engines of economic development: as countries urbanise, GDP per capita rises in a relationship that holds across virtually every income level and geography (Our World in Data / OWID, citing UN WUP data). The concentration of people in cities generates agglomeration economies — the productivity gains that come from proximity, from shared infrastructure, from specialisation, from the density of connections that cities make possible. Providing clean water, sanitation, healthcare, education, and public transport to a dense urban population costs significantly less per person than providing equivalent services to a dispersed rural one. UN DESA documentation has repeatedly confirmed that “providing public transportation, housing, electricity, water and sanitation for a densely settled urban population is typically cheaper and less environmentally damaging.”
Africa’s urbanisation, despite its current challenges of informality and inadequate infrastructure, represents an enormous potential dividend. Sub-Saharan Africa’s cities are young, growing, and potentially positioned for the kind of manufacturing-led export growth that transformed East Asian economies in the second half of the 20th century. Countries like Ethiopia and Tanzania are urbanising rapidly, and their urban populations are connecting to global markets and supply chains in ways that rural populations cannot. The question is not whether urbanisation is good — historically, it has been the single most reliable pathway out of extreme poverty — but whether it can be managed well enough that its benefits are more widely distributed and its environmental costs are contained.
The failure mode of urbanisation is not the city itself but the inability of institutions to keep pace with city growth. The contrast between Singapore (one of the world’s wealthiest and most liveable urban environments, built from what was once a colonial port city with severe poverty and informal settlement) and Dhaka (currently adding more people than it can accommodate with adequate infrastructure) is not primarily a contrast in geography or natural endowment. It is a contrast in state capacity, planning, investment, and institutional quality. Singapore’s government managed urban land allocation, housing provision, and infrastructure investment as explicit policy priorities for decades. Dhaka’s government is managing a city that is growing at three to five times the rate Singapore ever faced, with a fraction of the fiscal resources. The lesson of urbanisation history is that it can produce prosperity or misery — the determining variable is governance.
Medellín, Colombia: Once dubbed the world’s most dangerous city, Medellín built a cable car network connecting steep hillside informal settlements to the city centre, paired with libraries, schools, and community centres in the most marginalised neighbourhoods. Homicide rates fell dramatically. The city became a global model for “social urbanism” — using physical infrastructure investment as a tool for social inclusion, not as a luxury added after poverty is addressed.
Singapore: Starting from a colonial city with high informality and poverty in the 1960s, Singapore managed housing provision as an explicit public project: the Housing Development Board (HDB) today houses approximately 80% of Singapore’s resident population in public housing with high quality, integrated community infrastructure. The key: treating housing as infrastructure, not a market commodity.
Curitiba, Brazil: Developed bus rapid transit (BRT) systems in the 1970s that became a global template for affordable mass transit in growing cities. Land use zoning along BRT corridors created dense, mixed-use development that reduced car dependence and housing costs simultaneously.
Key common factors: Proactive land use planning before growth (not reactive after); public investment in infrastructure as a precondition for private development; integration of informal settlement upgrading rather than demolition; affordable transit as a poverty reduction tool; long time horizons in political decision-making. None of these require high income. What they require is governance capacity, political will, and a planning horizon longer than the next election cycle.
Sources: UN-Habitat World Cities Report 2024 (primary) · UN SDG 11 Report 2025 · Multiple urban planning analyses.
- UN DESA — “Press Release: Cities are home to 45 per cent of the global population, with megacities continuing to grow, UN report finds” (primary · directly fetched · November 18, 2025 · Jakarta #1 nearly 42M · Dhaka #2 almost 40M · Tokyo #3 33M · Cairo only non-Asian top 10 · 33 megacities / 8 in 1975 / 19 in Asia · 37 by 2050 · Addis Ababa, Dar es Salaam, Hajipur, Kuala Lumpur · small cities 96% under 1M · rural-majority 62 countries → 44 by 2050 · sub-Saharan Africa only rural-growing region · 2/3 of pop growth in cities)
- UN DESA Population Division — World Urbanization Prospects 2025 (primary · population.un.org/wup · 237 countries · 1950–2050 · 2025 Revision · consistent with 2024 WPP · Degree of Urbanisation methodology · 12,000+ cities · three settlement categories: cities/towns/rural)
- UN Statistics Division — SDG 11 Report 2025: “Make Cities Inclusive, Safe, Resilient and Sustainable” (primary · 3B struggle to afford housing · 1.12B in slums · 2B+ face 0.5°C additional by 2040 · 36% urban pop at 29°C+ by 2040 · 1B in flood-prone areas half in cities · 31% housing cost burden global avg 2023 · 70% urban by 2050 · 131 countries with disaster risk reduction strategies)
- UN-Habitat — World Cities Report 2024: Cities and Climate Action (primary · “cities both victims and perpetrators of climate change” · informal settlements most exposed to disasters · people with disabilities 4× more likely to die in climate disaster · exclusionary climate adaptation warnings · megacities concentrating assets in vulnerable areas)
- JRC / European Commission — “World’s Constructed Areas Expanding Twice as Fast as Population Since 1975” (November 18, 2025 · WUP 2025 basis · 2× built-up land growth vs population · 7 countries over 500M new city dwellers (India, Nigeria, Pakistan, DRC, Egypt, Bangladesh, Ethiopia) · Africa biggest relative urban change · Central/S.Asia most efficient land use · sub-Saharan Africa rural still growing)
- Al Jazeera — “Indonesia’s Jakarta now the world’s largest city, Tokyo falls to third: UN” (November 26, 2025 · WUP 2025 basis · Jakarta 42M #1 · Dhaka #2 from 9th · Tokyo 33.4M #3 · top 10 rankings incl. Delhi 30.2M · Shanghai 29.6M · Guangzhou 27.6M · Manila 24.7M · Kolkata 22.5M · Seoul 22.5M · Jakarta 25% underwater risk · Nusantara new capital)
- German Federal Statistical Office (Destatis) — “The Largest Cities Worldwide 2025” (January 2026 · WUP 2025 basis · Jakarta 41.9M / Dhaka 36.6M / Tokyo 33.4M · 4.8B in urban areas by 2025 = 58% of 8.2B · 6.5B+ urban by 2050 = 67% · +1.7B urban residents · Dhaka projected 52.1M by 2050 = world largest · 33 megacities now → 37 by 2050)
- UNRIC — “World’s Largest Cities: How Megacities Will Change by 2050” (July 2026 · WUP 2025 basis · Dhaka + Jakarta both 50M+ by 2050 · Tokyo drops to 7th · Luanda 715K (2000) → 11.4M (2025) → 20.2M (2050) · 300-500K Dhaka migrants/year · climate displacement · Cairo 25.5M · Lagos 12.7M · Luanda 11.7M · Kinshasa 10.9M · Paris ~9.3M · Madrid ~5.5M)
- World Resources Institute — “Climate Change Disproportionately Affects Informal Settlements” (November 2025 · 60%+ of urban residents in informal settlements in low-income countries · 1.1B in slums · housing and climate crises deeply intertwined · Jakarta flooding March 2025 · NDCs should include informal settlement upgrading · Nairobi 3M+ in vulnerable homes)
- Our World in Data — “Urbanization” (March 2025 update · WUP 2025 basis · 7 in 10 urban by 2050 · more than twice as many urban as rural by 2050 · strong urbanisation-income relationship · 1950: predominantly high-income countries urban; 2050: most countries majority urban · economic benefits of agglomeration · national definitions of urban vary)












