The Plastic Economy —
Where the World’s Waste Actually Goes
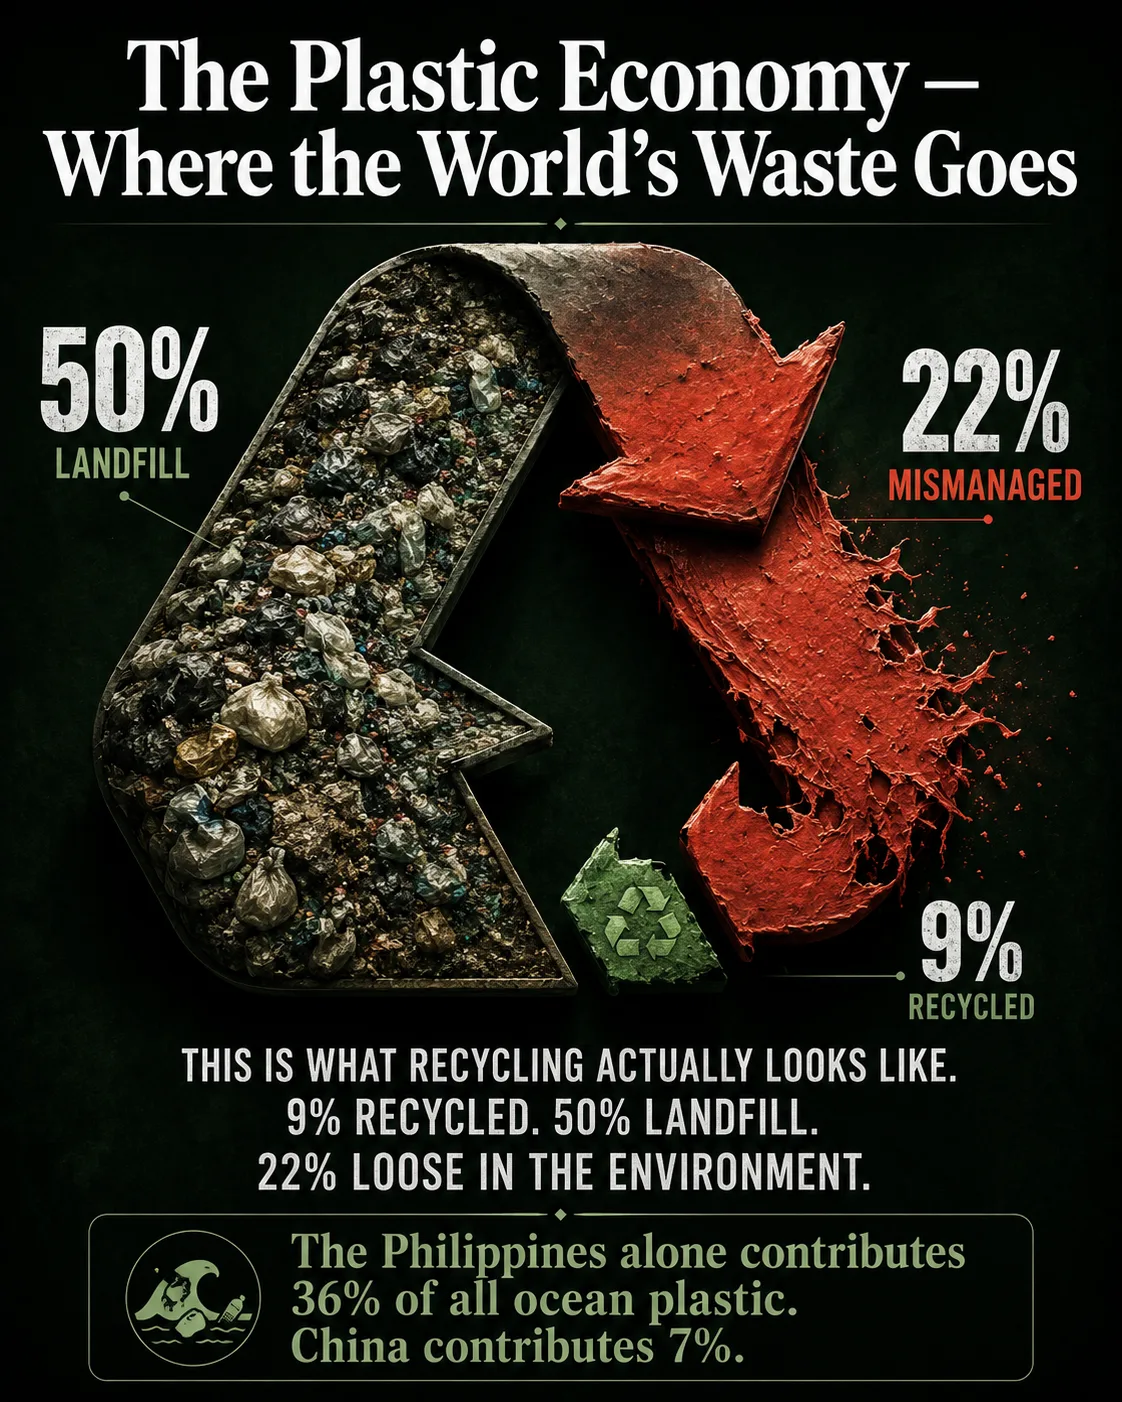
The world produces approximately 430–460 million tonnes of plastic every year — 230 times more than in 1950. Only 9% of all plastic waste has ever been recycled. Half goes to landfill. Twenty-two percent is mismanaged: burned in open pits, dumped in uncontrolled sites, or leaked directly into the environment. One to two million tonnes flows into the ocean annually through rivers, and the Philippines alone contributes an estimated 36% of all ocean plastic. A global treaty to address this has been negotiated for three years across six sessions — and has twice failed to reach agreement, most recently in Geneva in August 2025. The plastic economy is one of the clearest illustrations of a system designed for profit at every point of production, and for nobody’s account at the point of disposal.
- Only 9% of all plastic waste has ever been recycled — the other 91% still exists in some form. The OECD’s Global Plastics Outlook (primary, February 2022) found that of the 353 million tonnes of plastic waste generated globally in 2019, only 33 million tonnes — 9% — was successfully recycled after accounting for losses in the recycling process. The rest went to landfill (~50%), incineration (19%), or mismanagement (22%). Since plastic was first mass-produced in the 1950s, global production has grown 230-fold to approximately 430–460 million tonnes per year (OECD 2025 primary). Under a business-as-usual scenario, plastic waste is projected to nearly triple by 2060, reaching approximately 1.23 billion tonnes annually. Source: OECD Global Plastics Outlook (primary · 2022) · OECD Policy Scenarios to 2060 (2022) · OECD Stemming Plastic Pollution (primary · 2025).
- The geography of ocean plastic is counterintuitive: the Philippines, not China or the US, is the world’s largest single source. Science Advances (Meijer et al. 2021) — the most comprehensive global study of riverine plastic emissions to the ocean — found that the Philippines contributes an estimated 356,371 metric tonnes of ocean plastic per year, approximately 36% of the global total. Seven of the world’s top ten plastic-polluting rivers are in the Philippines, with 4,820 plastic-emitting rivers and a 36,289-kilometre coastline. China, despite producing roughly 34.5% of all plastic (Statista) and generating far more total plastic waste, contributes only about 70,707 MT/yr to ocean plastic — approximately 0.6% of its plastic waste — because its waste management infrastructure is substantially better. The lesson: total production does not determine ocean pollution. Waste management infrastructure and geography do. Source: Science Advances / Meijer et al. (2021).
- Plastic’s carbon footprint rivals or exceeds that of aviation. The OECD Global Plastics Outlook (primary, 2022) estimated that the plastics lifecycle contributed 3.4% of global greenhouse gas emissions in 2019 — approximately 1.8 billion tonnes of CO₂ equivalent — with 90% of emissions coming from production and conversion from fossil fuels. More recent lifecycle assessments (Lawrence Berkeley National Laboratory, 2024; Dauvergne et al., Nature, 2025) estimate the figure closer to 5% of global GHG emissions, compared to approximately 1.4% from aviation. Without intervention, plastic GHG emissions are projected to rise from 1.8 Gt CO₂e (2019) to approximately 2.8 Gt CO₂e by 2040 (OECD Policy Scenarios to 2060). The plastic crisis is simultaneously an ocean problem, a waste problem, and a climate problem. Source: OECD (primary · 2022) · Lawrence Berkeley Lab (2024) · Nature/Dauvergne et al. (2025).
- Microplastics are now found in human blood, breast milk, the placenta, and the brain — and health consequences are accumulating. Microplastics — plastic particles smaller than 5mm, produced either deliberately for industrial use or through the breakdown of larger plastic objects — have been detected in virtually every human tissue and environmental sample tested. Scientists presenting at INC-5.2 Geneva (August 2025) confirmed findings of microplastics in human placentas on both maternal and fetal sides, in human blood, and in human brain tissue. These particles contain chemicals that act as endocrine disruptors, affecting hormone function and development. Adults inhale an estimated 68,000 microplastic particles per day from indoor air alone (PLOS). The cumulative projected cost of plastic pollution-related health damage between 2016 and 2040 is estimated at $281 trillion (World Economic Forum). Source: INC-5.2 proceedings (August 2025) · CIEL · PLOS · WEF.
- A global treaty to end plastic pollution has twice failed — blocked by fossil fuel and petrochemical industry lobbying. In March 2022, 175 nations mandated the UN to negotiate a legally binding treaty to end plastic pollution by 2024. After five rounds of talks (INC-1 through INC-5.1 in Busan, South Korea, December 2024), no agreement was reached. A sixth session (INC-5.2) convened in Geneva in August 2025 with 184 countries attending and also adjourned without a treaty. The core deadlock: over 100 countries support binding production caps on plastic; a bloc of petrochemical-producing states, supported by industry lobbyists who outnumbered scientists 3:1 at the Busan talks, have blocked any upstream measures. The path forward as of July 2026 remains unclear. Source: WEF (August 2025) · CIEL (July 2025) · Greenpeace (August 2025) · INC-5.2 Geneva proceedings.
Source: OECD — Global Plastics Outlook: Economic Drivers, Environmental Impacts and Policy Options (primary · directly fetched · February 22, 2022 · doi:10.1787/de747aef-en · oecd.org). Directly confirmed: “only 9% of plastic waste was ultimately recycled, while 19% was incinerated and almost 50% went to sanitary landfills. The remaining 22% was disposed of in uncontrolled dumpsites, burned in open pits or leaked into the environment.” Ocean figure (<1% of total waste) from Our World in Data (OWID) citing Meijer et al. 2021: 1–2 million tonnes/yr to ocean from rivers, approximately 0.5% of total waste generated. Bar lengths proportional to percentages, anchored at 50% (sanitary landfill).
| Country | Ocean plastic/yr (MT) | Share of global total | Key factor | Waste mgmt quality |
|---|---|---|---|---|
🇵🇭 Philippines7,641 islands · 36,289 km coastline |
356,371 | ~36.4% | 4,820 plastic-emitting rivers. 7 of world’s top 10 most polluting rivers. Archipelago geography means almost all mismanaged plastic is coastal. 20% of domestic plastic waste reaches ocean. Rapid urbanisation outpacing waste infrastructure. | ⚠ Critical gap |
🇮🇳 India7,516 km coastline + major rivers |
126,513 | ~12.9% | World’s most populous country. Rapid urbanisation, informal waste sector. Ganges and Brahmaputra river systems carry significant plastic loads. Growing plastic production and consumption without proportionate waste infrastructure expansion. Also #1 in mismanaged waste by total volume in some rankings. | High risk |
🇲🇾 MalaysiaHigh leakage rate |
73,098 | ~7.5% | 9% of Malaysia’s total plastic waste reaches ocean — the highest leakage rate proportionally among large economies. Major rivers flowing to Strait of Malacca and South China Sea. History as a recipient of developed-world plastic waste exports (post-China 2018 ban) worsened domestic management challenge. | High leakage rate |
🇨🇳 ChinaLargest plastic producer globally |
70,707 | ~7.2% | China generates ~34.5% of world’s plastic (Statista) but only 0.6% of its waste reaches the ocean — showing relatively better waste management despite enormous total volumes. 2018 import ban on foreign plastic waste transformed global trade flows. Still contributes significantly in absolute terms due to sheer production scale. | Managed but scale |
🇮🇩 Indonesia17,000+ islands |
56,333 | ~5.7% | Archipelago geography similar to Philippines. Long coastlines, monsoon rainfall, inadequate collection infrastructure. Java’s rivers among world’s most plastic-loaded. Rapid growth without proportionate investment in waste management. | Geographic vulnerability |
🇲🇲 MyanmarSouth East Asia |
40,000 | ~4.1% | Very limited formal waste management. Irrawaddy River carries substantial plastic loads to Andaman Sea. Low-income country with rapidly growing plastic consumption through packaging-heavy supply chains. | Very limited infrastructure |
🇧🇷 BrazilOnly non-Asian top-10 country |
~37,000 | ~3.8% | Only non-Asian country in top 10. Amazon River carries plastic from interior to Atlantic. Discards 3.4 million tonnes of plastic annually; a third reaches coast. Microplastics found in Brazil’s most protected marine areas. Hosted Plastic Reboot Conference (October 2025) with 15 countries. | Improving but vast scale |
🇺🇸 United StatesHigh production, managed waste |
Low (<1% share) | <1% | US generates approximately 84.3 million tonnes of plastic annually (Statista) — massive per capita consumption — but waste management infrastructure is strong. Plastic that does escape the system is often exported: Canada (0.14Mt) and Mexico (0.09Mt) were top US plastic scrap export destinations in 2024. Per capita waste generation is high; ocean contribution is low. | Managed · exports waste |
Source: Science Advances / Meijer et al. 2021 (primary academic study · most comprehensive global riverine plastic emissions analysis). Figures cited via multiple secondary sources including Visual Capitalist, Geographical, PlasticBank, ScienceInsights (March 2026 · Earth Action 2024 Overshoot Report context). Philippines 356,371 MT/yr and 36.4% share confirmed from multiple independent citations of Meijer 2021. China 0.6% leakage rate vs Philippines 20% rate confirmed from Visual Capitalist / Geographical (December 2025). US plastic consumption ~84.3Mt and export data from Statista 2024. Brazil data from Geographical (December 2025). Click column headers to sort.
Why Has So Little Plastic Ever Been Recycled — and Is That Ever Going to Change?
The 9% recycling rate for plastic is not a failure of consumer behaviour or recycling programme ambiguity. It is a consequence of how plastic was designed. Plastic is not one material — it is hundreds of chemically distinct polymers, each requiring different processing conditions, none of which can be mixed without contamination. Polyethylene terephthalate (PET, used for water bottles) can be recycled at scale; many other plastics cannot. Labels, caps, dyes, additives, and multilayer packaging combinations all reduce recyclability. The result is that the fraction of plastic that can actually be recycled economically, without contamination, at industrial scale, in the real world rather than in a pilot project, is far smaller than the fraction collected. The OECD estimates that even if collection rates improved dramatically, a business-as-usual scenario would raise the recycling share to only 17% by 2060 — from 9% today.
The economic problem compounds the technical one. Virgin plastic — freshly manufactured from petrochemical feedstock — is cheap, particularly when oil prices are moderate, because plastic production is structurally linked to the economics of petroleum refining. The global production of secondary plastics from recycling has more than quadrupled in the last two decades (OECD), but secondary plastic still represents only 6% of total plastic feedstock. Unless virgin plastic carries the cost of the environmental damage it causes — through carbon pricing, extended producer responsibility fees, or production caps — recycled plastic cannot compete on price. This is the core reason that private-sector voluntary commitments to increased recycling — made by brands including Coca-Cola, Nestlé, and PepsiCo — have not been met. Recycling plastics costs more than making new ones. Until that changes, the economics will continue to make recycling the exception rather than the rule.
The chemical recycling route — breaking plastic back down into its monomer components and re-polymerising it — is promoted by the petrochemical industry as a technological solution that avoids the need for production caps. The OECD’s analysis, along with independent assessments, is less optimistic: chemical recycling remains expensive, energy-intensive, and at a fraction of the scale needed to make a material difference to global plastic waste flows. Innovation in waste prevention and recycling makes up only 1.2% of all plastics-related patents — a figure the OECD cites as evidence that the industry’s innovation focus is on new production, not on circular solutions.
Why Does the Philippines Contribute More Ocean Plastic Than China or the United States?
The most counterintuitive finding of Meijer et al.’s 2021 Science Advances study — the most comprehensive global analysis of riverine plastic emissions to the ocean — is that the world’s largest plastic producers are not the world’s largest ocean plastic contributors. China produces approximately 34.5% of the world’s plastic. The United States generates approximately 84.3 million tonnes of plastic annually. Yet the Philippines, which produces a fraction of either country’s plastic volume, contributes an estimated 356,371 metric tonnes of plastic to the ocean per year — approximately 36% of the global total — more than any other country. India is second at approximately 126,513 MT/yr.
Three factors explain this pattern. First, geography: the Philippines is an archipelago of over 7,600 islands with a 36,289-kilometre coastline and 4,820 plastic-emitting rivers. Most of its population lives within a short distance of the ocean. Plastic that enters any waterway has a very short journey to the sea. Second, leakage rates: approximately 20% of Philippine plastic waste reaches the ocean, compared to 0.6% for China and well under 1% for the United States. The absolute volume matters less than what fraction of it escapes waste management. Third, waste infrastructure: rapid urbanisation in the Philippines has outpaced the development of formal waste collection, processing, and disposal systems, leaving large quantities of plastic in informal or unmanaged circulation that is highly vulnerable to environmental leakage.
The implication for policy is precise: cleaning up ocean plastic requires investment in waste management infrastructure in the Philippines, India, Indonesia, Malaysia, and similar countries — not primarily action in the US or Europe, which contribute little to ocean plastic despite high production. Yet the global plastic treaty negotiations have focused heavily on production caps (which would constrain US and European petrochemical companies) rather than on waste management investment (which would actually reduce ocean plastic from its primary sources). Both are necessary. But the geography of where ocean plastic comes from is different from the geography of where plastics are produced, and conflating them leads to misallocated policy effort.
Seven of the world’s top 10 most plastic-polluting rivers are in the Philippines. The pattern across all river systems: countries with heavy monsoon rainfall, long coastlines, high population density, and limited formal waste collection are systematically overrepresented. The probability that any piece of mismanaged plastic waste reaches the ocean depends on all these geographic and infrastructural factors simultaneously — which is why national per capita production figures tell you almost nothing about national ocean plastic contributions.
What is in the ocean now: estimates range from 75 to 199 million tonnes of plastic floating in or near ocean surfaces. The OECD projects this will reach 76 million tonnes of accumulated buildup by 2040 and 141 million tonnes by 2060 under a business-as-usual scenario. Even if all new mismanaged plastic were eliminated today, the rivers that have already accumulated plastic would continue feeding the ocean for decades — as the OECD Global Plastics Outlook (primary, 2022) notes: “The build-up of plastics in rivers implies that leakage into the ocean will continue for decades to come even if mismanaged plastic waste was significantly reduced.”
Sources: Science Advances / Meijer et al. (2021) · OECD Global Plastics Outlook (primary · 2022) · OECD Policy Scenarios to 2060 (2022) · OECD Stemming Plastic Pollution (primary · 2025).
How Did Plastic Get Into Human Blood, Breast Milk, and the Human Brain?
Microplastics — defined as plastic particles smaller than 5 millimetres — are produced in two ways: manufactured directly at small size for industrial applications (microbeads in cosmetics, plastic pellets used as industrial feedstock), and produced through the physical and UV degradation of larger plastic objects. Every plastic item that sits in sunlight or water is slowly fragmenting into smaller particles, which fragment further into nanoplastics, which are small enough to penetrate cell membranes. Scientists presenting at INC-5.2 Geneva in August 2025 confirmed the presence of microplastics in human placentas on both the maternal and fetal sides: “Exposure begins before birth, and its consequences may last a lifetime.” Microplastics have also been confirmed in human blood, breast milk, and — in findings published in Nature in 2025 (Monclús et al.) — in human brain tissue.
The health consequences are still being established, but the chemical picture is clear in outline. Plastics contain thousands of chemical additives: plasticisers (including phthalates), flame retardants, stabilisers, colorants, and processing aids. Many of these are known or suspected endocrine disruptors — chemicals that interfere with hormone function, potentially affecting development, reproduction, metabolism, and immune response. The INC-5.2 proceedings document delegates confirming links between plastic chemical exposure and cancer, fertility issues, and gastrointestinal problems. Adults inhale an estimated 68,000 microplastic particles per day from indoor air (PLOS). People who drink bottled water daily ingest approximately 90,000 additional microplastic particles per year (ScienceDirect).
In 2025, Greenpeace International commissioned testing that found microplastics in baby food products sold in plastic pouches by Nestlé and Danone — two of the world’s largest food companies. Approximately 36.5% of fish caught for human consumption contain microplastics (ScienceDirect). The transfer from ocean plastic to the human food chain, through fish consumption and direct contamination of water supplies, means that even people in countries with no contact with the ocean are exposed to the plastic pollution produced primarily in coastal Asian nations. The health costs are not distributed along the same lines as the production decisions that created them.
Why Did the Global Plastics Treaty Fail — Twice — and What Happens Next?
In March 2022, representatives of 175 nations adopted UN Environment Assembly Resolution 5/14, mandating the creation of a legally binding global treaty to end plastic pollution — the most ambitious multilateral environmental agreement since the Paris Climate Accord. The resolution called for addressing the “full lifecycle of plastics,” from production through disposal. The deadline was end of 2024. What followed was six rounds of negotiations and two consecutive failures to reach agreement, most recently at INC-5.2 in Geneva, August 5–14, 2025, where 184 countries attended and the session was adjourned without a treaty text.
The core deadlock is structural. Over 100 countries — including Norway, Rwanda, and a broad coalition of Pacific island and African nations — support binding caps on plastic production as the centrepiece of any meaningful treaty. A smaller bloc of petrochemical-producing states, including Saudi Arabia and others with large plastics industries, has consistently blocked upstream measures and pushed for a treaty focused only on waste management rather than production reduction. At INC-5.1 in Busan, there were three times more fossil fuel and petrochemical industry lobbyists than scientists, and nine times more than Indigenous peoples, according to the Centre for International Environmental Law (CIEL). Greenpeace UK documented that seven petrochemical companies collectively produced 1.4 million tonnes of plastic — enough to fill five and a half garbage trucks every minute — while sending 70 lobbyists to the treaty negotiations since 2022.
The result is a deadlock between two coherent but irreconcilable visions of the treaty. One side sees the plastic crisis as fundamentally a production problem: if 430–460 million tonnes of plastic is manufactured every year, no amount of waste management investment will prevent the 22% that leaks from doing so. The other side sees it as fundamentally a waste management problem: the issue is not that plastic exists but that it is not properly collected and disposed of, and the solution is investment in infrastructure rather than restrictions on production. Both positions contain truth. The first is more likely to address the root cause; the second is more compatible with existing petrochemical industry business models. As of July 2026, the path to a final treaty text remains uncertain.
Coca-Cola: #1 brand polluter in multiple consecutive years. In 2024, Coca-Cola dropped its reuse targets and watered down its recycling goals. In 2025, it remained the #1 branded plastic polluter globally. Civil society organisations note that voluntary commitments to end plastic pollution “simply do not work” when the company’s core product economics still favour single-use plastic packaging.
PepsiCo: #2 three consecutive times. Produces approximately 2.5 million metric tonnes of plastic per year — the equivalent of approximately 70 blue whales per day in weight. A member of the Alliance to End Plastic Waste, which opposes production caps in the global treaty.
Nestlé: Made a commitment that 100% of its packaging would be reusable or recyclable by 2025. Has not met it. Also found to have microplastics in its baby food products (Greenpeace 2025 testing). The gap between voluntary corporate commitments and outcomes is the central argument for legally binding treaty obligations.
The broader picture: The plastic crisis has identifiable beneficiaries (petrochemical companies, consumer goods manufacturers) and diffuse victims (coastal communities, marine ecosystems, consumers absorbing microplastics). This asymmetry explains both why the treaty negotiations are difficult and why voluntary action has been insufficient. The companies profiting from plastic production do not bear the cost of plastic pollution — which means the market provides no signal to reduce it.
Sources: Surfers Against Sewage (August 2025) · Greenpeace (August 2025) · CIEL (July 2025) · Break Free from Plastic.
What Would Actually Work — and What Does the Data Say About Solutions?
The OECD’s Policy Scenarios to 2060 report (2022) is the most rigorous quantification of what different interventions could achieve. Its central finding is sobering: under the most ambitious globally coordinated scenario — combining production caps, extended producer responsibility, dramatically improved waste management, and innovation investment — plastic leakage into the environment could be reduced to near zero by 2060. Under the current business-as-usual scenario, plastic waste nearly triples and ocean accumulation rises to 141 million tonnes. The gap between these scenarios is entirely a policy gap, not a technology gap. The solutions are known; the implementation is what’s missing.
Four interventions have the strongest evidence base. First, waste management infrastructure in middle-income countries is the most immediate lever for reducing ocean plastic, because this is where 75–80% of ocean plastic currently originates. Investment in collection, processing, and disposal in the Philippines, India, Indonesia, Malaysia, and Vietnam would produce larger and faster reductions in ocean plastic than any action taken in high-income countries. Second, extended producer responsibility (EPR) — requiring manufacturers to fund the collection and processing of the packaging they put into circulation — creates a financial incentive to design for recyclability and shifts the cost of waste management from taxpayers to producers. The Philippines enacted the EPR Act of 2022, making it one of the first lower-middle-income countries to do so. Third, eliminating single-use plastic applications where alternatives exist would remove the source of the largest waste volumes: packaging accounts for approximately 35% of all plastic use (OECD), with most packaging discarded within the same year it is produced.
The fourth, most contested, and most impactful intervention is a binding cap on virgin plastic production. The OECD analysis shows that curbing plastics production and demand could yield a 10% reduction in plastic pollution by 2040 compared to a business-as-usual scenario. When combined with the other interventions, the cumulative effect is transformative. The reason this intervention is most contested is also the reason it is most impactful: it directly reduces the profitability of the petrochemical sector. Global plastic waste exports have already more than halved since 2014 — from 15.58 million tonnes to 6.04 million tonnes (OECD 2025) — demonstrating that when import bans are imposed (as China did in 2018), the industry adapts. A globally coordinated system of production accountability would work in the same direction at far greater scale.
1. Develop recycled (secondary) plastics markets by combining push policies (recycled content mandates, landfill taxes, extended producer responsibility) and pull policies (procurement preferences, quality standards). Currently secondary plastics = only 6% of total plastic feedstock. Global production of secondary plastics has quadrupled in 20 years but starts from a very low base.
2. Boost technological innovation in plastics — both in production (biodegradable and bio-based plastics; material efficiency) and waste management (advanced sorting, chemical recycling at scale). But innovation in waste prevention and recycling currently makes up only 1.2% of all plastics-related patents — a stark signal of where industry investment actually goes.
3. More ambitious domestic policy: an inventory of key regulatory instruments across 50 OECD, emerging, and developing countries shows the policy landscape is “fragmented and can be strengthened significantly.” Single-use plastic bans, extended producer responsibility, recycled content requirements, and landfill restrictions all show evidence of effectiveness where implemented.
4. Greater international co-operation — especially financing for waste management in lower-income countries; harmonised product standards; trade rules for plastic waste. This is what the stalled global treaty was meant to provide.
The OECD estimate: globally ambitious action across the plastics lifecycle can prevent up to 61 million tonnes of additional ocean plastic by 2060. That is roughly half the projected 2060 ocean accumulation under business-as-usual — but only if all four levers are pulled simultaneously, at global scale, starting now.
Sources: OECD Global Plastics Outlook (primary · 2022) · OECD Policy Scenarios to 2060 (2022) · OECD Stemming Plastic Pollution (primary · 2025).
- OECD — “Global Plastics Outlook: Economic Drivers, Environmental Impacts and Policy Options” (primary · directly fetched · February 22, 2022 · doi:10.1787/de747aef-en · 460Mt production 2019 · 353Mt waste · 9% recycled · 19% incinerated · 50% landfill · 22% mismanaged · 3.4% GHG · 1.8 Gt CO₂e · 22Mt leakage · four key levers)
- OECD — “Global Plastic Waste Set to Almost Triple by 2060” (June 2022 · Policy Scenarios to 2060 report · 1.23B Mt waste by 2060 · recycling 9%→17% · landfill 50% · mismanaged to 15% · ocean 76Mt 2040 / 141Mt 2060 · river flow double to 3.6Mt by 2060)
- OECD — “Stemming Plastic Pollution to Protect the Ocean” (primary · directly fetched · May 2025 · 230-fold increase since 1950 · short-lived applications · latest OECD Environment data · 61Mt ocean plastic prevented by ambitious action)
- Science Advances / Meijer et al. — “More than 1000 rivers account for 80% of global riverine plastic emissions into the ocean” (April 2021 · Philippines 356,371 MT/yr · India 126,513 MT/yr · Malaysia 73,098 MT/yr · China 70,707 MT/yr · Indonesia 56,333 MT/yr · Philippines = 36.4% of global ocean plastic · 4,820 rivers Philippines · 1-2Mt/yr total to ocean via rivers)
- Our World in Data — “Plastic Pollution” (November 2023 · Meijer basis · 1-2Mt/yr ocean via rivers · 0.5% of waste reaches ocean · 25% mismanaged · most ocean plastic from middle-income countries · Asia dominant source)
- World Economic Forum — “INC-5.2: The Global Plastics Treaty Talks — Here’s What Just Happened” (August 2025 · Geneva adjourned without agreement · 184 countries · $281T health cost 2016–2040 · 1B tonnes plastic waste in world 2025 · 1.7B by 2060 · 4% GHG · Chair Valdivieso quotes)
- Centre for International Environmental Law (CIEL) — “10 Things To Know About INC-5.2” (July 2025 · 3× more fossil fuel lobbyists than scientists at INC-5.1 · 9× more than Indigenous peoples · microplastics in blood and breast milk · endocrine disruptors · cancer links · consensus vs voting rules issue)
- Greenpeace International — “Still No Plastics Treaty: How the Fossil Fuel Industry Keeps Polluting Negotiations” (August 2025 · 7 companies · 1.4M tonnes plastic · 70 lobbyists since INC-1 · microplastics in baby food Nestlé + Danone · 75% production cut demand · INC-5.2 adjournment)
- Surfers Against Sewage — “Top Polluting Brands at Global Plastics Treaty” (August 2025 · Coca-Cola #1 · dropped reuse targets 2024 · PepsiCo #2 three times · 2.5M tonnes/yr · Nestlé missed 100% recyclable target · ExxonMobil chemical recycling strategy · Dow, INEOS, SABIC, BASF at talks)
- Nature — “The Global Plastics Treaty Can Be Saved — Here’s How to Break the Deadlock” (February 2026 · 184 states deadlocked after 6 sessions · plastics production 5% GHG / 2.24 Gt CO₂e · vs aviation 1.4% · compressed timeline issue · route to agreement)