India vs. Japan
The economy that overtakes first. The ranking says it already happened.
Japan is still ahead in current dollars. India is already ahead in purchasing power. The overtake is a unit choice.
Three numbers
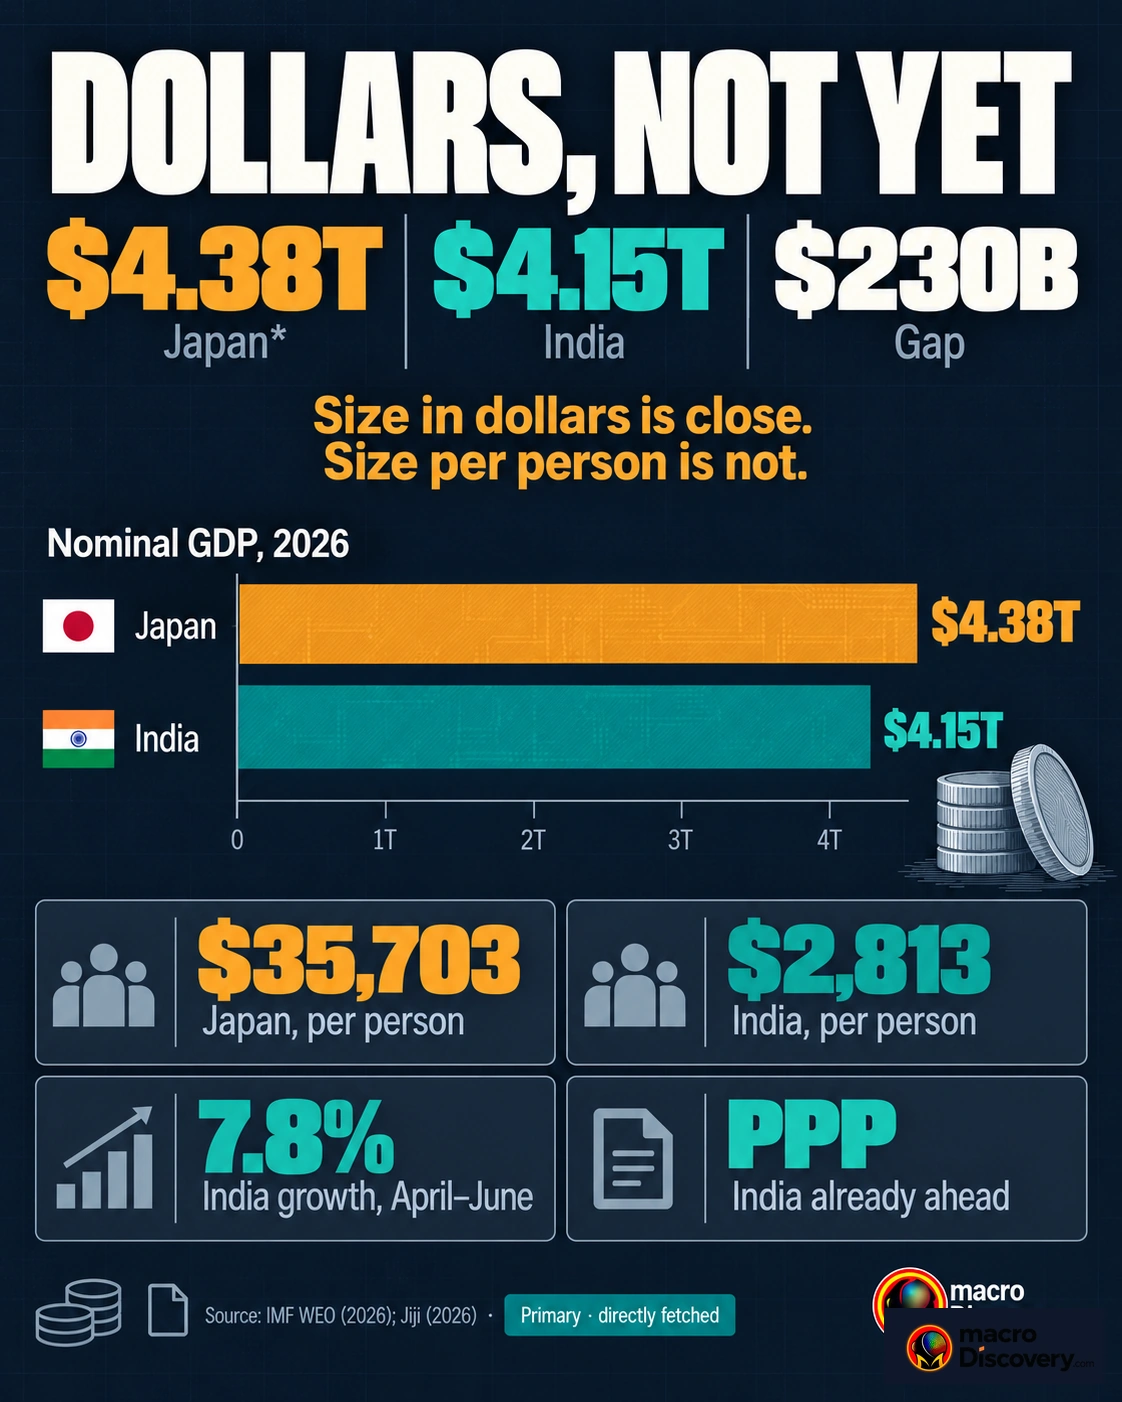
- $4.38 trillion — Japan’s nominal GDP in the IMF’s 2026 table. Fourth in current dollars. Source: IMF.
- $4.15 trillion — India in the same table. The United Kingdom, at about $4.26 trillion, sits between them. Source: IMF.
- Already ahead — India on purchasing-power GDP. A local-price unit, not the dollar total used for the fourth-place claim. Source: IMF.
What the data shows
A common claim is that India has overtaken Japan, or is about to, and is the world’s fourth-largest economy. The fact is that the dollar crossing has not happened, and a 2025 projection that said it would was a photo finish that the exchange rate erased. The IMF’s 2026 table puts Japan at about $4.38 trillion and India at about $4.15 trillion. The United Kingdom, at about $4.26 trillion, is between them. On current dollars Japan is fourth, the UK fifth, and India sixth. Calling India fourth uses a forecast that the later table did not keep.
The near-miss was real and thin. An earlier IMF projection had India at about $4.187 trillion and Japan at about $4.186 trillion in 2025, a gap of about a billion dollars. India’s statistical office then published a new base year. The nominal total came in lower than the old series. Converted at the average rate, the fiscal-year economy was about $4 trillion, against Japan’s about $4.4 trillion in 2025. The rupee fell nearly 5% against the dollar. The yen strengthened. An HDFC Bank economist said a crossing this year, or possibly next, was unlikely. Officials had already called India fourth. The revision and the currency moved the line after the sentence.
On the other unit, India is already ahead. Purchasing-power GDP prices a local basket. India has ranked above Japan on it for years, and well above. That is not the dollar total in the fourth-place claim. Output per person still runs several times higher in Japan. A crossing, when it comes, will be a larger population times a lower income. The Japan Times noted that surpassing Japan would reflect scale, not prosperity. A rank in dollars is not a rank in living standards, and a rank in purchasing power is not a rank in dollars.
Purchasing-power rank is not on this chart. On that unit India is already ahead.
| Count | Figure | What it is |
|---|---|---|
| Japan, 2026 | $4.38 trillion | Fourth in current dollars |
| United Kingdom, 2026 | $4.26 trillion | Between Japan and India |
| India, 2026 | $4.15 trillion | Sixth. Not the crossing |
| 2025 photo finish | about $1 billion | A projection the revision erased |
| Purchasing power | India already ahead | A different unit |
How it was measured
Nominal GDP is local output converted at the exchange rate. A weaker rupee lowers India’s dollar total without a fall in rupee output. A stronger yen raises Japan’s. The IMF table is an estimate for the year, revised in the World Economic Outlook. India’s base-year change is a statistical revision, not a recession.
Purchasing-power GDP uses a common price basket. It answers how much local goods the output buys. It is the wrong unit for a claim about the fourth-largest economy in dollars. Output per person divides the total by population. India has about 1.4 billion people. Japan has about 124 million. The totals are not incomes.
What it means
It is settled that the IMF’s 2026 dollar table still has Japan ahead of India, with the UK between them, and that India is already ahead on purchasing power. It is not settled that the dollar crossing happens next year. Use $4.38 trillion for Japan. Use $4.15 trillion for India. Use purchasing power only for the unit where India already leads. Do not call India fourth in dollars.
Common misreadings
- The 2026 dollar table still has Japan ahead. The UK is between them.
- A 2025 photo finish was a projection. A base-year revision and a weaker rupee erased it.
- Purchasing power is a different unit. A dollar rank is not a living-standard rank.
Where the numbers come from
How we built this
- Dataset: IMF nominal GDP for 2026; India’s base-year revision as reported; purchasing-power rank kept separate.
- Scope: Current dollars for the fourth-place claim. Per-person income noted and not ranked as the total.
- Figures: $4.38 trillion is Japan. $4.15 trillion is India. The purchasing-power lead is a different unit. The crossing is treated as not yet in the dollar table.