Compared: The Economics
of Immigration
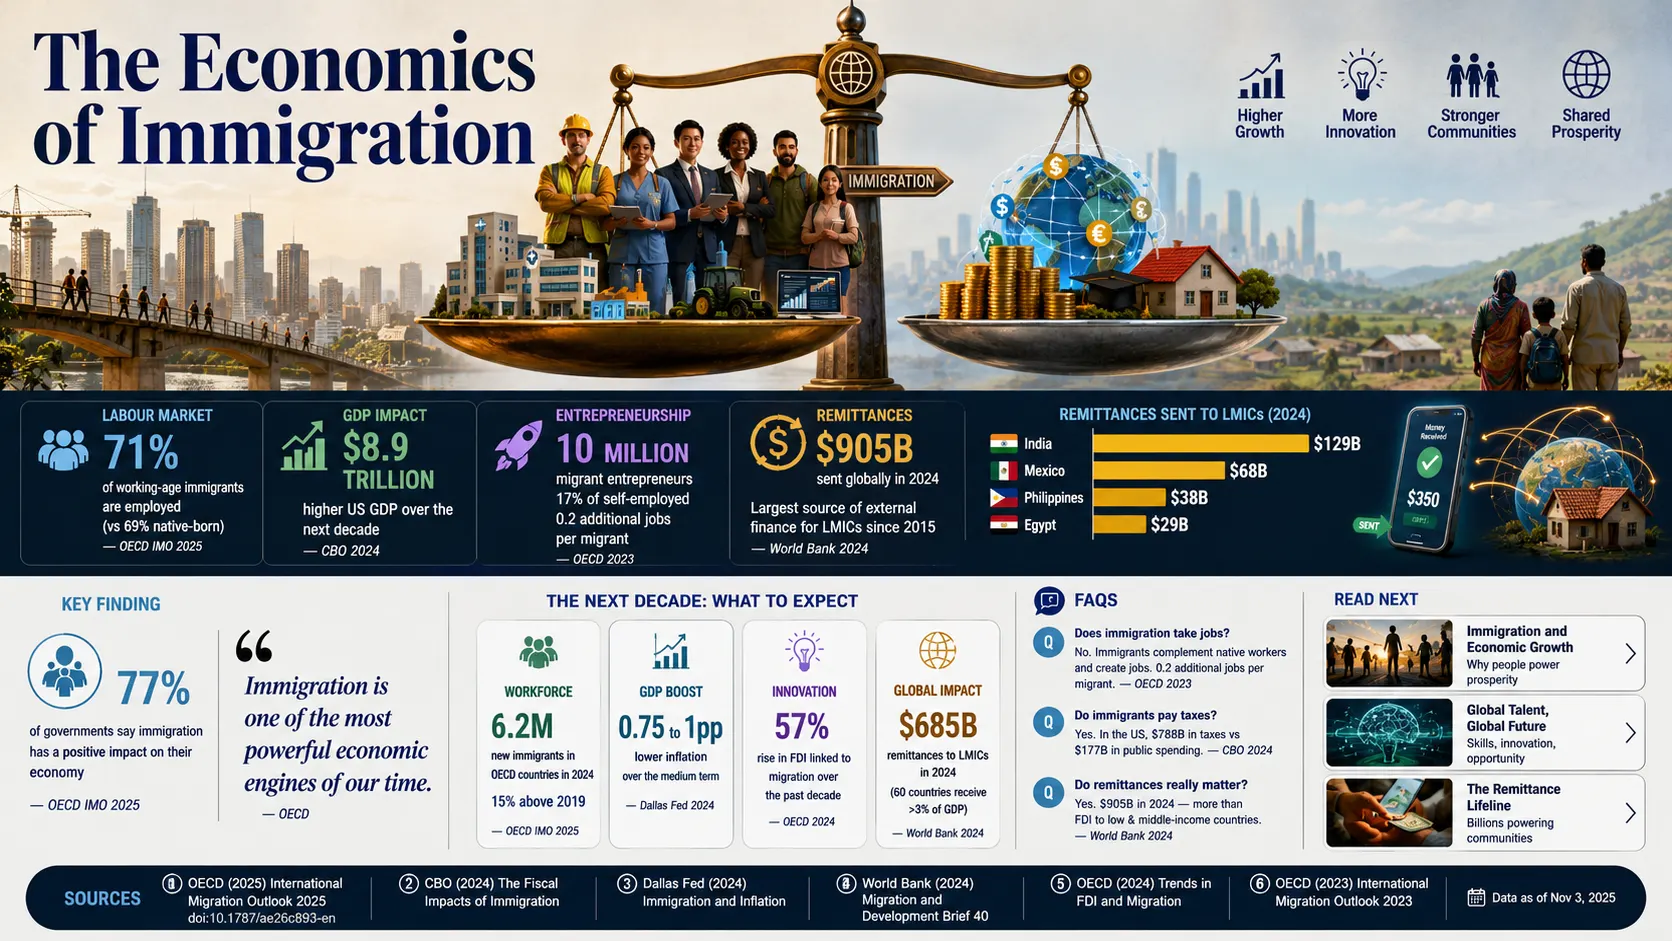
In 2024, almost 77% of immigrants in OECD countries were economically active — a higher rate than many native-born populations. The US immigration surge is projected to add $8.9 trillion to GDP by 2034. Migrants sent $905 billion home in 2024 — more than all foreign direct investment to developing countries combined. And when immigration fell sharply in the US in 2025, GDP growth fell with it.
Four dimensions of the economics of immigration, based on OECD, World Bank, CBO, and Dallas Fed primary data. Each tells a different part of the same story: immigration is a large-scale economic force, and when it declines, economies feel it. Sources: OECD International Migration Outlook 2025 (PRIMARY · doi.org/10.1787/ae26c893-en · November 3, 2025) · OECD IMO 2024 (PRIMARY) · CBO April 2024 · Dallas Fed July 8, 2025 · World Bank / IOM World Migration Report 2026.
Immigration is one of the most politically contested subjects in the world. It is also one of the most thoroughly studied in economics — and the economic evidence is more consistent than the political debate suggests. Immigrants work at high rates. They start businesses. They pay taxes. They send money home. And when host-country governments restrict their arrival, the effects show up quickly in labour markets and GDP growth.
“Remittances continued to be greater than Foreign Direct Investment, having increased by 57 per cent in the last decade in contrast to a 41 per cent reduction in FDI. Since 2015, remittances have been the largest source of external finance flows to low-and middle-income countries other than China.”
— IOM / World Bank, World Migration Report 2026 (PRIMARY · worldmigrationreport.iom.int · citing World Bank remittances data through 2024)$905 Billion in Remittances — The Transfer the Public Finance Data Misses
Global remittances reached $905 billion in 2024 — a 4.6% rise from $865 billion in 2023. Of that, $685 billion went to low- and middle-income countries: more than all foreign direct investment to those economies by a margin of over $270 billion. Remittances have been the largest source of external finance flows to LMICs other than China since 2015 — larger than development aid, larger than FDI. The US is the world’s largest sender (over $100 billion in 2024). India is the largest recipient ($129 billion). For Tajikistan, remittances equal 45.4% of GDP. In over 60 countries, they represent more than 3% of GDP. These flows are not captured in standard immigration cost-benefit analyses. They are private money transfers that bypass government budgets entirely, arriving directly in households that use them for food, school fees, healthcare, and business investment. The remittance channel is one of the largest poverty-reduction mechanisms in the global economy — and it is funded by the wages of people working abroad.