
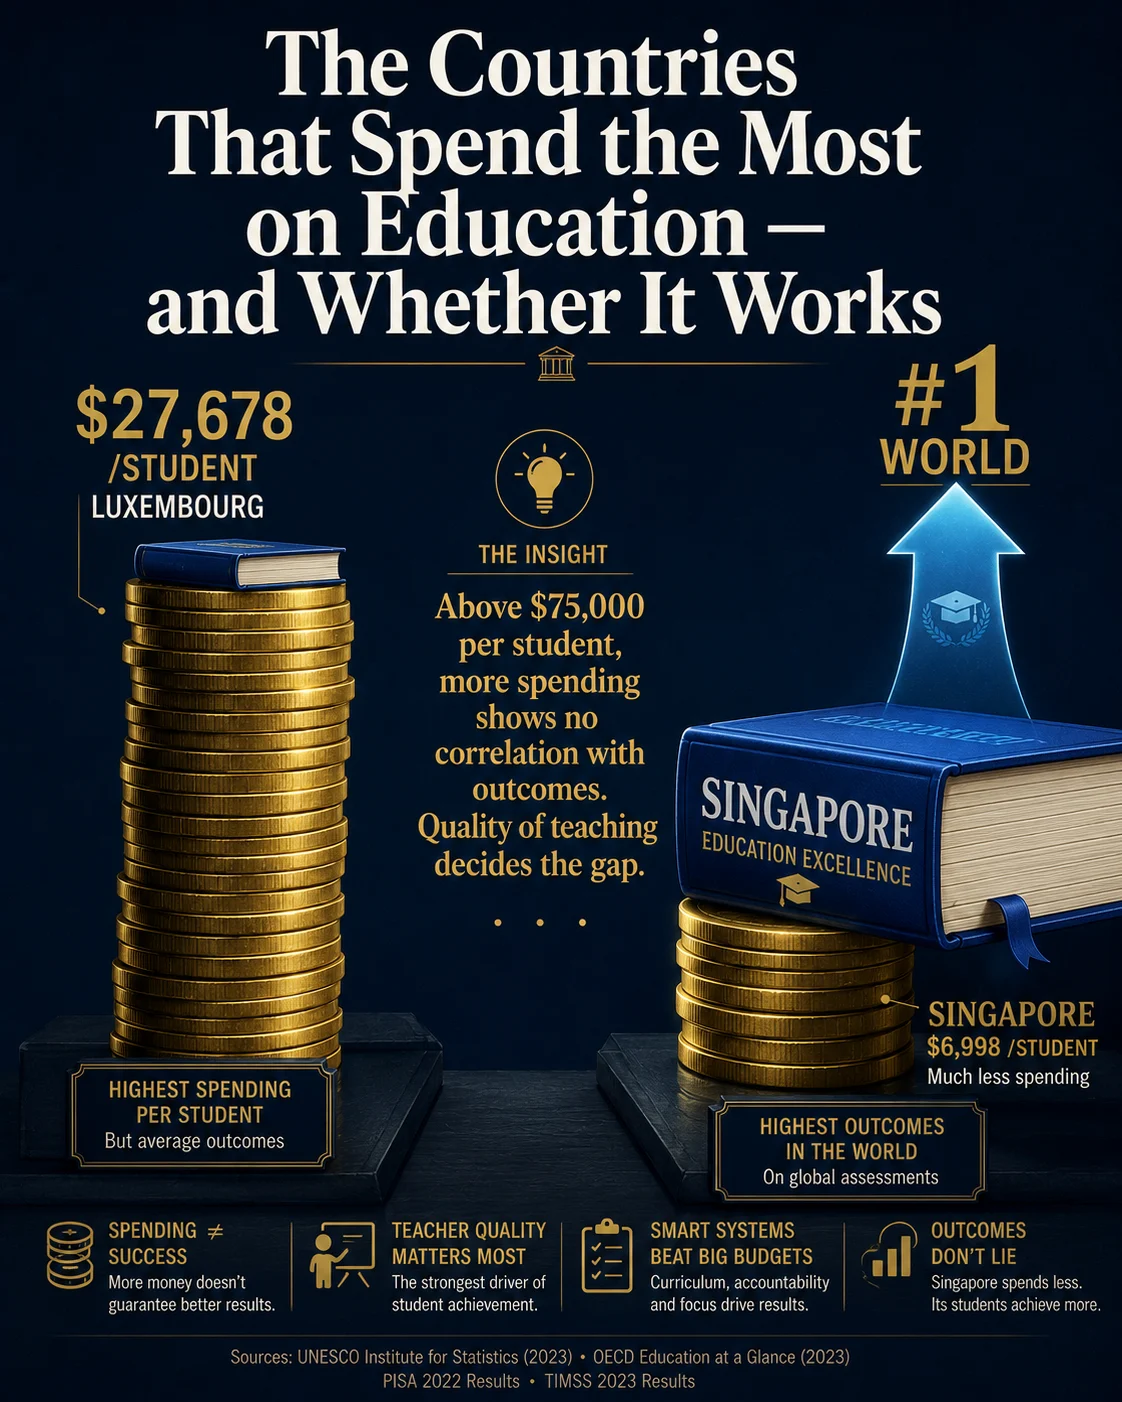
The Countries That Spend the Most
on Education — and Whether It Works
Luxembourg spends $27,678 per student every year — the highest in the world. Norway spends $19,797 and devotes approximately 6% of GDP to education. The United States spends more per student than almost any other country. And yet Singapore, which spends less than several of them, tops every PISA ranking by a wide margin. OECD’s own research has confirmed the paradox: above a cumulative threshold of $75,000 per student across primary and secondary school, more spending shows no measurable correlation with outcomes. What countries spend their money on turns out to matter far more than how much they spend.
- Above $75,000 in cumulative spending per student, more money does not produce better PISA scores. PISA 2022 (primary, December 2023) confirmed this threshold across multiple country analyses: below $75,000, higher spending is associated with higher maths performance. Above it, “the ways in which financial resources are used seems to matter more for student performance than the level of investment.” Luxembourg, Norway, Finland, and the United States all spend well above this threshold. Singapore, the world’s top performer, also does — but gets there through teacher quality, not class-size reduction or facility spending.
- Luxembourg’s $27,678 per-student figure is partly an accounting artefact of exceptional wealth. Luxembourg has the highest GDP per capita in the OECD. Its extraordinary per-student figure reflects high teacher salaries and a small student population — but its education spending as a share of GDP is actually below the OECD average (approximately 3.3%), because the GDP denominator is so large. This makes Luxembourg a misleading benchmark: it is simultaneously the highest absolute spender and a relatively modest GDP-share investor. The OECD Education at a Glance 2025 explicitly notes: “Luxembourg has high expenditure per student, but its high GDP and GDP per capita, mean its spending relative to those measures is lower.”
- The global education funding gap between rich and poor countries is 207 to 1. High-income countries spend approximately $11,413 per child per year on education. Low-income countries spend approximately $55. This gap — roughly 207 times — represents one of the widest resource disparities in any global public service. Below the $75,000 cumulative threshold, spending genuinely predicts outcomes: for the majority of the world’s children, who attend schools in countries well below that level, more resources directly improve learning. The diminishing-returns finding that dominates OECD policy discussion is not relevant to the 60%+ of children educated in lower-income systems.
- Spending more does not guarantee adult skills. OECD Education at a Glance 2025 (primary) contains a striking finding from the PIAAC Survey of Adult Skills 2023: despite rising educational attainment across OECD countries, literacy and numeracy skills of adults stagnated or declined in most OECD countries between 2012 and 2023. More people hold degrees than ever before. The actual skills those degrees represent have, in many systems, not kept pace. This is the most uncomfortable finding in current education research: rising credentials and rising spending have not translated into rising skills.
- Education spending is losing ground within government budgets. Government expenditure on education as a share of total government spending fell 6.9% on average across OECD countries, from 10.9% in 2015 to 10.1% in 2022 (OECD EaG 2025, primary). Education has become a smaller budget priority even as total government spending grew. In Norway — one of the highest spenders per student — the real wages of primary school teachers declined by 2.8% between 2015 and 2024, against an OECD average increase of 14.6%. Spending totals can rise in absolute terms while the system is simultaneously losing competitive ground on teacher pay.
Source: OECD — Education at a Glance 2025: OECD Indicators (primary · September 9, 2025 · doi:10.1787/1c0d9c79-en · 2022 financial year data). Directly confirmed: “For students in primary, secondary or post-secondary non-tertiary education, governments in OECD countries spend on average USD 12,438 per student, ranging from below USD 4,000 in Mexico and Türkiye to around USD 21,000 or more in Korea, Luxembourg and Switzerland.” Norway figure ($19,797) from EaG 2025 Norway country note (directly confirmed). Belgium ($16,467), Iceland ($17,753), Austria ($17,767), Sweden ($15,454), Netherlands ($15,254), Denmark ($15,027) from StatRanker/EaG 2025 secondary citing OECD primary. Bar lengths proportional to per-student spend, anchored at Luxembourg.
| Country | Per student (USD PPP) | % of GDP | PISA 2022 Maths | Top performers % | Verdict |
|---|---|---|---|---|---|
🇸🇬 SingaporePISA 2022 #1 all subjects |
$166,100* | ~3–4% | 575 | 41% | High spend · #1 outcomes |
🇱🇺 LuxembourgHighest per-student OECD |
$27,678 | ~3.3% GDP | ~483 | ~10% | Highest spend · avg outcomes |
🇳🇴 NorwayHighest % GDP in OECD |
$19,797 | ~6% GDP | ~470 | ~9% | High spend · avg outcomes |
🇰🇷 KoreaHigh spend + PISA top 5 |
>$21,000 | ~5.6% GDP | 527 | 23% | High spend · top outcomes |
🇫🇮 FinlandFormer #1 model |
$126,800* | ~5.8% GDP | 484 | 9% | High spend · declining since 2012 |
🇺🇸 United States5th highest per-student |
~$15,500 | ~6.0% GDP | 465 | 8% | High spend · below avg outcomes |
🇪🇪 EstoniaPISA anomaly: low spend, high score |
Below avg | ~5.3% GDP | 510 | ~15% | Moderate spend · well above avg |
🇯🇵 JapanBelow avg spend · PISA top 5 |
Below avg* | ~4.0% GDP | 536 | 23% | Moderate spend · top 5 outcomes |
🇲🇽 MexicoLowest OECD per student |
<$4,000 | ~4.3% GDP | 395 | 1% | Low spend · far below avg |
🇰🇮 KiribatiGlobal % GDP outlier |
Very low* | 14.2% GDP | N/A | N/A | Highest % GDP · small island aid effect |
* Cumulative spending per student ages 6–15 (PPP 2019) from PISA 2022 country notes (primary): Singapore $166,100 · Finland $126,800. Japan’s cumulative figure not published in available PISA 2022 country notes; PISA notes describe Japan as spending “below the threshold” countries implicitly. Luxembourg PISA score approximate from OECD GPS. Norway PISA score approximate from OECD GPS data. Estonia PISA 2022: 510 confirmed (OECD PISA 2022 primary). US PISA 2022 maths: 465 (OECD PISA primary). Mexico 395 (OECD PISA primary). Kiribati 14.2% GDP (2021) from Grokipedia/UNESCO UIS; no PISA participation. Spending per student from OECD EaG 2025 (primary). % GDP: OECD EaG 2025 for OECD members; UNESCO/UIS for Kiribati. PISA 2022 data: OECD PISA 2022 Vol I (primary · doi:10.1787/53f23881-en · December 5, 2023). Click column headers to sort.
Which Countries Actually Spend the Most on Education?
The answer changes significantly depending on which measure you use. By spending per student in purchasing-power-parity dollars, Luxembourg leads the world at $27,678 per student annually at the primary-to-post-secondary non-tertiary level — nearly double the OECD average of $12,438. At the tertiary level, Luxembourg’s spend rises to $54,384 per student, more than triple the OECD average of $15,102. But Luxembourg is an exceptional case: its extraordinary GDP per capita means that despite the largest absolute per-student spending, its education expenditure as a share of GDP sits at approximately 3.3% — well below the OECD average of 4.7%. The OECD explicitly notes this paradox in Education at a Glance 2025: Luxembourg has high expenditure per student but its very high GDP means spending relative to national income is comparatively low.
By GDP percentage, Norway leads the OECD at approximately 6% of GDP devoted to education — combining high absolute per-student spending ($19,797) with a high commitment relative to national income. The United States also ranks near the top on both measures, spending approximately $15,500 per student at the elementary and secondary level and approximately 6% of GDP in total. Chile, Israel, and Australia also have notably high GDP-share spending. By government budget priority, however, the trend across all OECD countries is negative: education’s share of total government spending fell from 10.9% in 2015 to 10.1% in 2022, a 6.9% decline on average. Even as spending has grown in absolute terms, it has lost ground to other priorities — health, social protection, and debt servicing — within public budgets.
The global picture extends the comparison into starker territory. High-income countries spend approximately $11,413 per child per year. Low-income countries spend approximately $55. This 207-to-1 gap represents the fundamental structural inequality in global education: the PISA threshold finding about diminishing returns above $75,000 in cumulative spending is a problem of the wealthy minority of the world’s school systems. The majority of the world’s children learn in systems so underfunded that every additional dollar genuinely improves outcomes — and the resource to provide it simply does not exist.
Does Spending More on Education Actually Improve Student Outcomes?
The PISA 2022 findings on this question are among the most policy-relevant in recent education research. The OECD’s own primary publication states: “Among the countries/economies whose cumulative expenditure per student, over all primary and secondary school years between the ages of 6 and 15, was under USD 75,000 (PPP) in 2019, higher expenditure on education was associated with higher scores in the PISA mathematics test. But this was not the case among countries/economies whose cumulative expenditure was greater than USD 75,000.” The full PISA 2022 Volume I report adds: “For many OECD countries that spend more per student, there is no relationship between extra investment and student performance.”
The $75,000 threshold represents roughly $7,500 per year over ten years of schooling between ages 6 and 15 — a level below which most OECD countries do not fall, but above which a significant portion of the world still sits. Above this threshold, the PISA data shows that Finland’s cumulative spend of approximately $126,800 produces students at the OECD average for top mathematics performers (9%). Singapore’s cumulative spend of $166,100 produces 41% top performers. Both are well above the threshold — but the outcomes differ by a factor of more than four. The difference is not the money. It is what the money is used for.
Korea and Singapore, the OECD notes, demonstrate that top-tier education systems are achievable “by prioritising the quality of teaching over the size of classes and funding mechanisms that align resources with needs.” Estonia produces PISA scores of 510 — well above the OECD average of 472 — while spending below the OECD average per student. Japan consistently ranks in the PISA top five while spending at or below average relative to its economic peers. The United States, by contrast, is among the highest spenders in the world and scores below the OECD average in mathematics. These counterexamples are not anomalies. They are the pattern.
Below $75,000 cumulative per student (ages 6–15): Spending and PISA mathematics scores are positively correlated. More money measurably helps.
Above $75,000 cumulative per student: “The ways in which financial resources are used seems to matter more for student performance than the level of investment in education.” The correlation disappears.
Context: Singapore spent $166,100 cumulatively (above threshold) and scored 575 in maths (highest globally). Finland spent $126,800 (above threshold) and scored 484 (average for OECD). Norway spends high and scores near average. The US spends high and scores below average. Estonia spends moderate and scores 510. Japan spends moderate and scores 536. These outcomes reflect teacher quality, curriculum design, and resource targeting — not aggregate spending levels.
Sources: PISA 2022 Country Notes — Finland, Japan, Korea, Singapore (primary · OECD · December 2023) · PISA 2022 Results Volume I (primary · doi:10.1787/53f23881-en).
Why Does Singapore Top Every Global Education Ranking?
Singapore scored 575 in PISA 2022 mathematics — 103 points above the OECD average of 472, and significantly ahead of every other country and economy. Forty-one percent of Singaporean students attained Level 5 or 6 proficiency in mathematics, compared to 9% across OECD countries. In reading and science, Singapore also ranked first globally. This performance was achieved with a cumulative per-student spending of approximately $166,100 over ages 6–15 — more than either Finland or Norway. But the OECD is clear that Singapore’s results do not come from the volume of spending: they come from how it is deployed.
The key structural feature of Singapore’s education system is the treatment of teaching as a high-status profession requiring rigorous selection and continuous professional development. Teaching positions in Singapore are competitive — entry to teacher training is selective, ongoing performance is monitored, and teacher pay is aligned with comparable professional roles. The OECD cites Singapore as demonstrating it is possible to establish a top-tier system “by prioritising the quality of teaching over the size of classes.” Singapore has not achieved its results by reducing class sizes to 15 students or building elaborate facilities — it has achieved them by ensuring the person at the front of a class of 30 is exceptionally well-prepared and appropriately compensated.
The contrast with the United States is instructive. The US spends more per student than Singapore at the elementary and secondary level and approximately 6% of GDP on education. Its PISA mathematics score in 2022 was 465 — 7 points below the OECD average and 110 points below Singapore. The explanation is not that the US is investing in the wrong things in aggregate, but that its education system fragments spending across approximately 13,000 school districts with enormous variation in resource quality, teacher preparation, and curriculum standards. Singapore’s centralised, coherent approach produces consistent outcomes; the US system produces consistent averages that mask extraordinary variation between its highest- and lowest-resourced schools.
What Does “Rising Attainment, Declining Skills” Mean for Education Returns?
The most challenging finding in OECD Education at a Glance 2025 (primary) is deceptively brief: “Despite rising educational attainment, literacy and numeracy skills of adults in most OECD countries stagnated or declined between 2012 and 2023.” This finding, from the PIAAC Survey of Adult Skills 2023, means that more people are completing more years of formal education than at any point in history — and the actual skills those years of education produce have simultaneously deteriorated across most OECD systems. More credentials. Less competence.
The equity dimension compounds this. Education at a Glance 2025 confirms that despite all the spending increases of recent decades, the gap between educational outcomes for students from different socioeconomic backgrounds remains dramatically wide: only 26% of young adults whose parents did not complete upper secondary education hold a tertiary qualification, compared to 70% of young adults with at least one tertiary-educated parent. Education systems have expanded significantly without becoming substantially more equitable. The children most likely to benefit from high-quality education — those from disadvantaged families — remain systematically the least likely to receive it, regardless of total national spending levels.
These two findings together — skills declining while attainment rises, and inequality persisting despite spending growth — suggest that the challenge in high-income country education systems is not primarily one of resource insufficiency. It is a challenge of curriculum quality, pedagogical effectiveness, teacher preparation, and equity in resource distribution within systems. Countries like Estonia and Japan, which produce disproportionately strong outcomes relative to their spending, have addressed those specific factors. Countries with high spending and mediocre outcomes have not.
This means: more adults hold diplomas, degrees, and qualifications than a decade ago. The actual ability of those adults to read critically and use numbers has not improved — and has in many countries declined. This is the credential inflation problem made measurable: the expansion of formal qualifications has not been matched by equivalent expansion in underlying skills. The report notes that “equipping learners with relevant skills is ultimately more important” than attainment rates. For policymakers arguing that increased education spending automatically produces better-prepared workforces and citizens, this finding is a significant challenge. Spending has increased. Credentials have increased. Skills have not kept pace.
Is Education Spending Keeping Up With What It Costs to Build a Good System?
Government spending on education grew in absolute terms between 2015 and 2022 across OECD countries — but it shrank relative to total government expenditure. The share fell from 10.9% to 10.1%, a decline of 6.9 percentage points on average. Health care, social protection, and debt servicing have claimed increasing shares of government budgets, leaving education’s relative position weaker even as its nominal totals rose. This matters because education system quality is determined not by what is spent today, but by what has been spent over decades to build teacher preparation infrastructure, curriculum quality, and school facilities.
The teacher salary data illustrates the practical consequences. Across the OECD, real primary teacher salaries increased by 14.6% between 2015 and 2024 on average — but in Norway, one of the highest-spending education systems in the world by both per-student and GDP measures, they declined by 2.8%. This is the paradox of aggregate spending statistics: Norway spent more than almost any OECD country on education, and simultaneously paid its primary teachers less in real terms in 2024 than in 2015. How money is allocated within education budgets — toward teacher pay and quality, or toward other inputs like facilities, administration, and technology — determines outcomes as much as the total sum.
The lesson from the full dataset is that education spending is necessary but not sufficient, and that its effectiveness is almost entirely a function of what it is directed toward. The global gap between $55 and $11,413 per child per year confirms that resources remain the binding constraint for the majority of the world’s children. But for OECD-level systems spending ten, fifty, or a hundred times the low-income country rate, the constraint is not resources — it is the quality of the decisions made about deploying those resources.
Teacher quality — selective entry to teacher training, competitive pay, and ongoing professional development. Korea and Singapore explicitly cited by OECD as models of “prioritising quality of teaching over size of classes.”
Early intervention — high-quality early childhood education and care with targeted support for disadvantaged learners. Iceland dedicates 3.2% of GDP to primary and lower secondary education alone (highest OECD).
Equity in resource distribution — directing resources toward learners who need them most, rather than tracking higher spending to already-advantaged schools and districts. The 26% vs 70% tertiary attainment gap (EaG 2025) shows most OECD systems have not solved this.
Curriculum quality and coherence — evidence-based curriculum with clear progression, as opposed to fragmented or locally variable approaches. Finland’s declining PISA scores since 2012 are partly attributed to curriculum fragmentation.
Feedback and accountability — systematic assessment of what students actually know, used to adjust instruction. Estonia has been cited as a model for this approach at moderate cost.
Sources: PISA 2022 Vol. I (primary) · OECD EaG 2025 (primary) · StatRanker/EaG 2025 analysis · LingoBright/OECD data.
- OECD — Education at a Glance 2025: OECD Indicators (primary · September 9, 2025 · doi:10.1787/1c0d9c79-en · 2022 data · $12,438 OECD avg per student · $15,102 tertiary · 4.7% GDP · 10.1% govt share · 26% vs 70% equity · adult skills stagnation · Luxembourg $27,678 / $54,384 · Norway $19,797)
- OECD — PISA 2022 Results Volume I: The State of Learning and Equity in Education (primary · December 5, 2023 · doi:10.1787/53f23881-en · $75,000 threshold · Singapore 575 maths / 41% top · OECD avg 472 / 9% · Korea and Singapore teacher-quality model)
- OECD — PISA 2022 Country Note: Finland (primary · December 2023 · $75,000 threshold confirmed · Finland cumulative $126,800 · 9% top performers · declining since 2012)
- OECD — PISA 2022 Country Note: Singapore (primary · December 2023 · $75,000 threshold confirmed · Singapore cumulative $166,100 · 41% top performers · 575 maths)
- OECD — PISA 2022 Country Note: Japan (primary · December 2023 · $75,000 threshold confirmed · 23% top performers · maintained/improved during pandemic)
- OECD — PISA 2022 Country Note: Korea (primary · December 2023 · $75,000 threshold confirmed · 23% top performers · 84% Level 2+ proficiency)
- OECD — Education at a Glance 2025: Norway Country Note (primary · September 2025 · $19,797 per student · teacher salaries −2.8% since 2015 vs OECD +14.6% · 12.2%→11.5% govt budget share)
- US NCES / OECD — “Education Expenditures by Country” (COE Indicator CMD · January 2023 · US $15,500 elementary/secondary · 5th highest · Norway $18,000 · OECD avg $11,300 · Norway GDP% 6.6% 2019)
- StatRanker — “Top 10 Countries by Education Spending per Student (2025)” (February 2026 · OECD EaG 2025 basis · Austria $17,767 · Iceland $17,753 · Belgium $16,467 · Sweden $15,454 · Netherlands $15,254 · Denmark $15,027)
- LingoBright — “What Country Spends the Most on Education” (May 2026 · OECD EaG 2025 basis · Luxembourg $27,678 / $54,384 · low-income $55 vs high-income $11,413 per child · 207:1 gap · Estonia and Poland anomalies)
- Our World in Data / UNESCO UIS — “Public Spending on Education as a Share of GDP” (2026 · UNESCO UIS 2026 basis · historical + recent data · global coverage)
- Grokipedia — “List of Countries by Spending on Education as Percentage of GDP” (January 2026 · UNESCO UIS basis · Kiribati 14.2% 2021 · Namibia 10.39% · Lesotho >10% · Nigeria 0.38% · OECD avg 4.9% 2021)












