
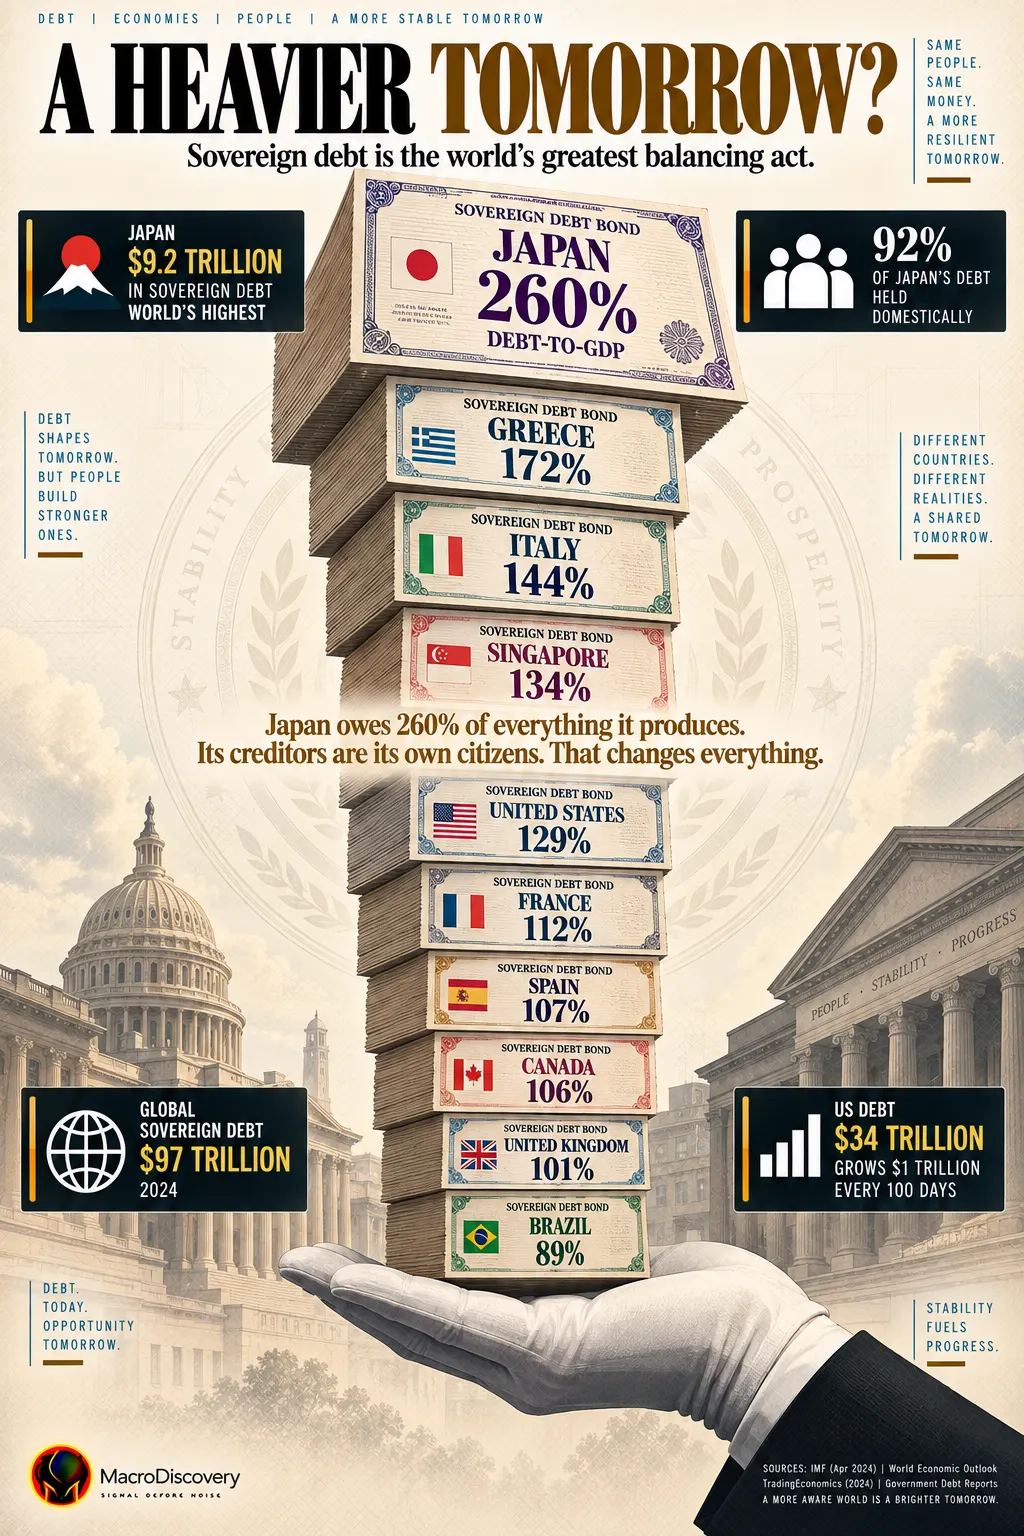
The Countries With the Highest Debt
Japan’s IMF gross-debt print for 2026 is 204% of GDP — not 260%. That older number lives on a different ledger. Net debt is about 134%. The crisis that never came has reasons. It is not magic.
The United States owes the most dollars. Singapore’s 172% is mostly matched by assets. Venezuela’s ratio is a different kind of story. Do not put them on one medal stand.
Search “Japan debt” and you still get 250% or 260% of GDP. That was the unconsolidated, older-book figure that lived in earlier IMF vintages and still appears in some national tallies. The April 2026 Fiscal Monitor is explicit: Japan’s general government gross debt definition was revised to consolidated face value. On that book, 2026 is 204.4%, drifting down toward 193% by 2031. The Fund warns the new series is not comparable with old World Economic Outlook rows. So the subtitle’s 260% is a memory. The current IMF print is 204.
Net debt — gross minus the government’s own financial assets — is the number that changes the mood: about 134% for Japan in 2026. Still huge. Not 204. Not 260.
Gross debt as a share of a year’s output
- 1Japan204%
- 2Singapore172%
- 3Sudan169%
- 4Bahrain152%
- 5Italy138%
- 6Greece137%
- 7United States126%
- 8France118%
Venezuela’s ratio on some 2025 rows exceeds 300% — a crisis book, not a G7 book. Singapore’s gross figure is mostly securities matched against CPF and other assets. Do not read 172% as Italy-with-palm-trees.
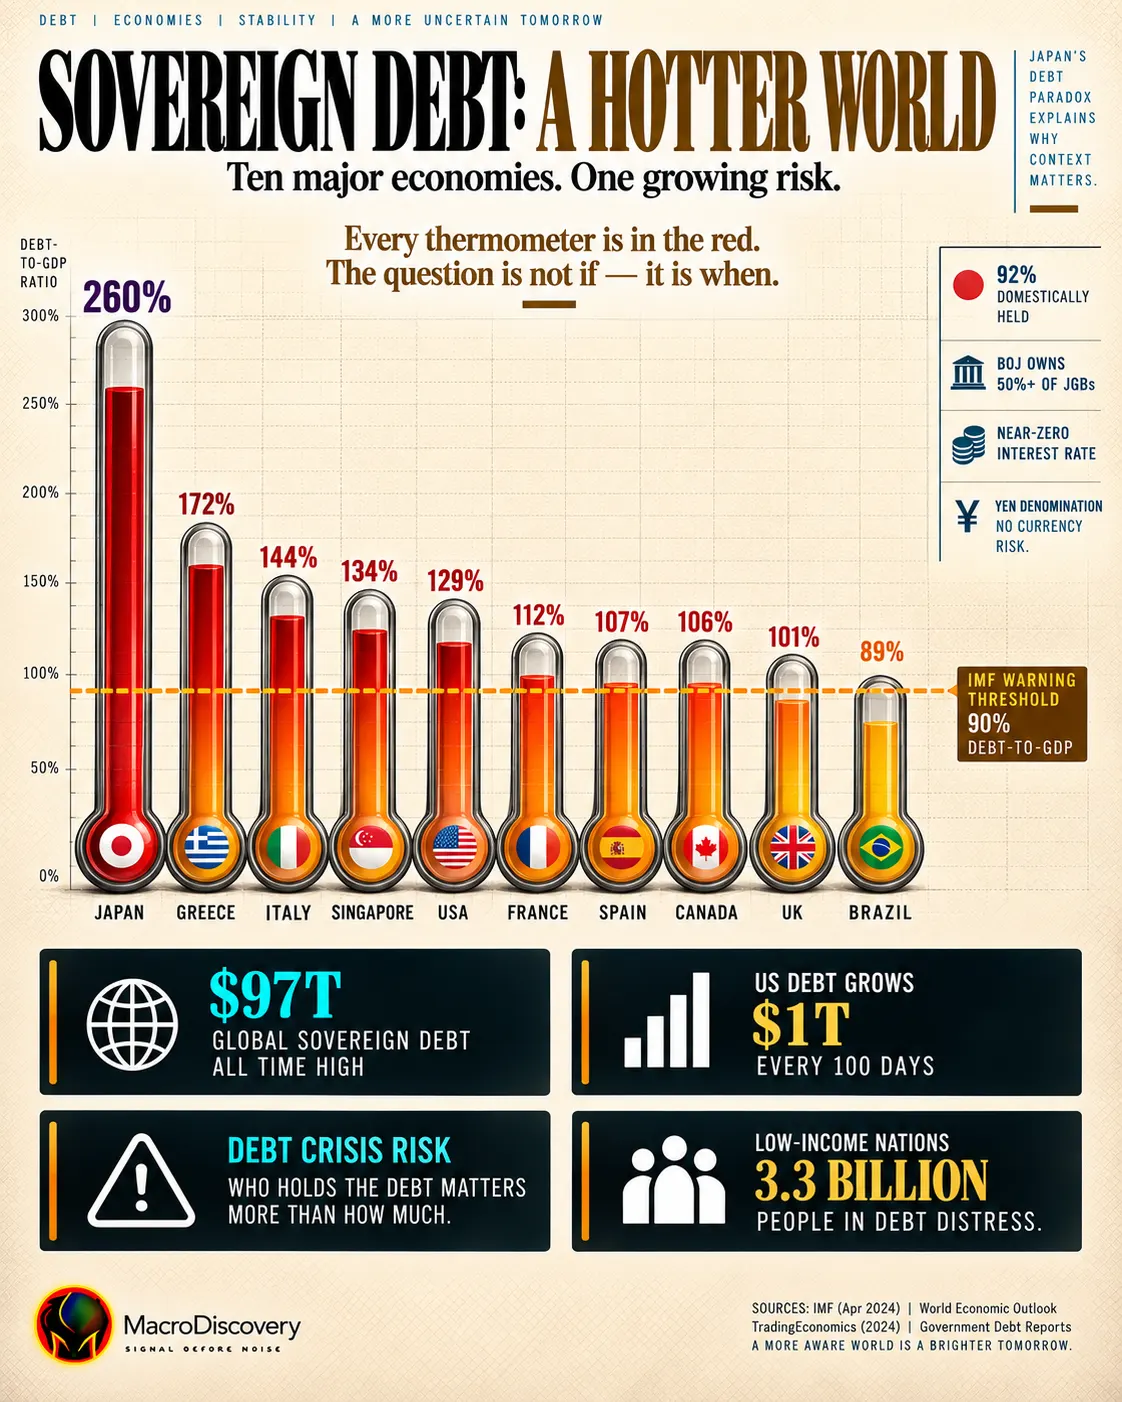
The United States is first in money. Japan is first in weight.
IMF 2026 dollar stock: the United States about $40.7 trillion, China about $22 trillion, Japan about $9 trillion. The country that “has the most debt” depends on whether you want a pile of bills or a pile relative to output. This ranking is the ratio. Say so in the first sentence if you quote it.
IMF 2026 revised book
Not 260%. That was the old unconsolidated postcard.
Gross minus financial assets
Still the heavy one among large rich countries.
Largest dollar stock
Ratio 126%, rising toward 142% by 2031 on this vintage.
Mostly matched assets
A balance-sheet country, not a distressed one.
260% was a headline. 204% is the Fund’s new ruler. 134% net is why the headline never became a bank run. None of those numbers is a forecast of forever.Macro Discovery reading of IMF April 2026 Table 1.2
Why 204% has not been 1998
Japan borrows in yen from Japanese households, banks, insurers and its own central bank. A country that issues debt in a currency it prints, to residents who save in that currency, does not face the same sudden stop as a dollar borrower in a thin market. That is the standard explanation. It is also the limit of the explanation. Aging shrinks the domestic saver base. The Bank of Japan already owns a large slab of the stock. Yields are no longer pinned at zero. “No crisis” is a description of the last thirty years, not a coupon you can cash in 2040.
Copy-paste the Japan story onto Italy and you skip the euro. Copy it onto the United States and you skip the fact that the world’s reserve asset can stay expensive longer than a textbook allows — and that the IMF’s own table has U.S. gross debt still climbing through 2031 while Japan’s revised ratio eases. Same unit. Opposite slope.
Editorial reading of IMF Fiscal Monitor April 2026. The Fund did not write this box. This is not investment advice.If you remember two things
Japan 204% gross. Not 260%.
Definition changed to consolidated face value. Net about 134%. MOF/old-book prints can still look like 250.
Own currency. Domestic savers. A central bank on the book.
That is why the ratio did not become an external crisis. It is not a promise it never will.
Short answers
One Fund table. Two Japan books.
- Ratios: IMF Fiscal Monitor April 2026, Table 1.2 — Japan 204.4% (2026), Singapore 171.9, Sudan 169.1, Bahrain 152.4, Italy 138.4, Greece 136.9, United States 125.8, France 118.4.
- Japan note: Fund footnote — definition revised from unconsolidated market value to consolidated face value; not comparable with prior WEO vintages. Net debt ~134% in 2026.
- Dollars: IMF 2026 stock — US ~$40.7T, China ~$22T, Japan ~$9T. Separate from the ratio rank.
- 260%: treated as the pre-revision / national high-print memory, not the current IMF cell.












