Home AI Technology Gaming Future Economy Geography Automobile Science Web Stories

40% of Fortune 500 Companies Were Founded by Immigrants: Economics of Immigration

Macro Discovery
On: September 10, 2026 7:21 AM
Follow Us:
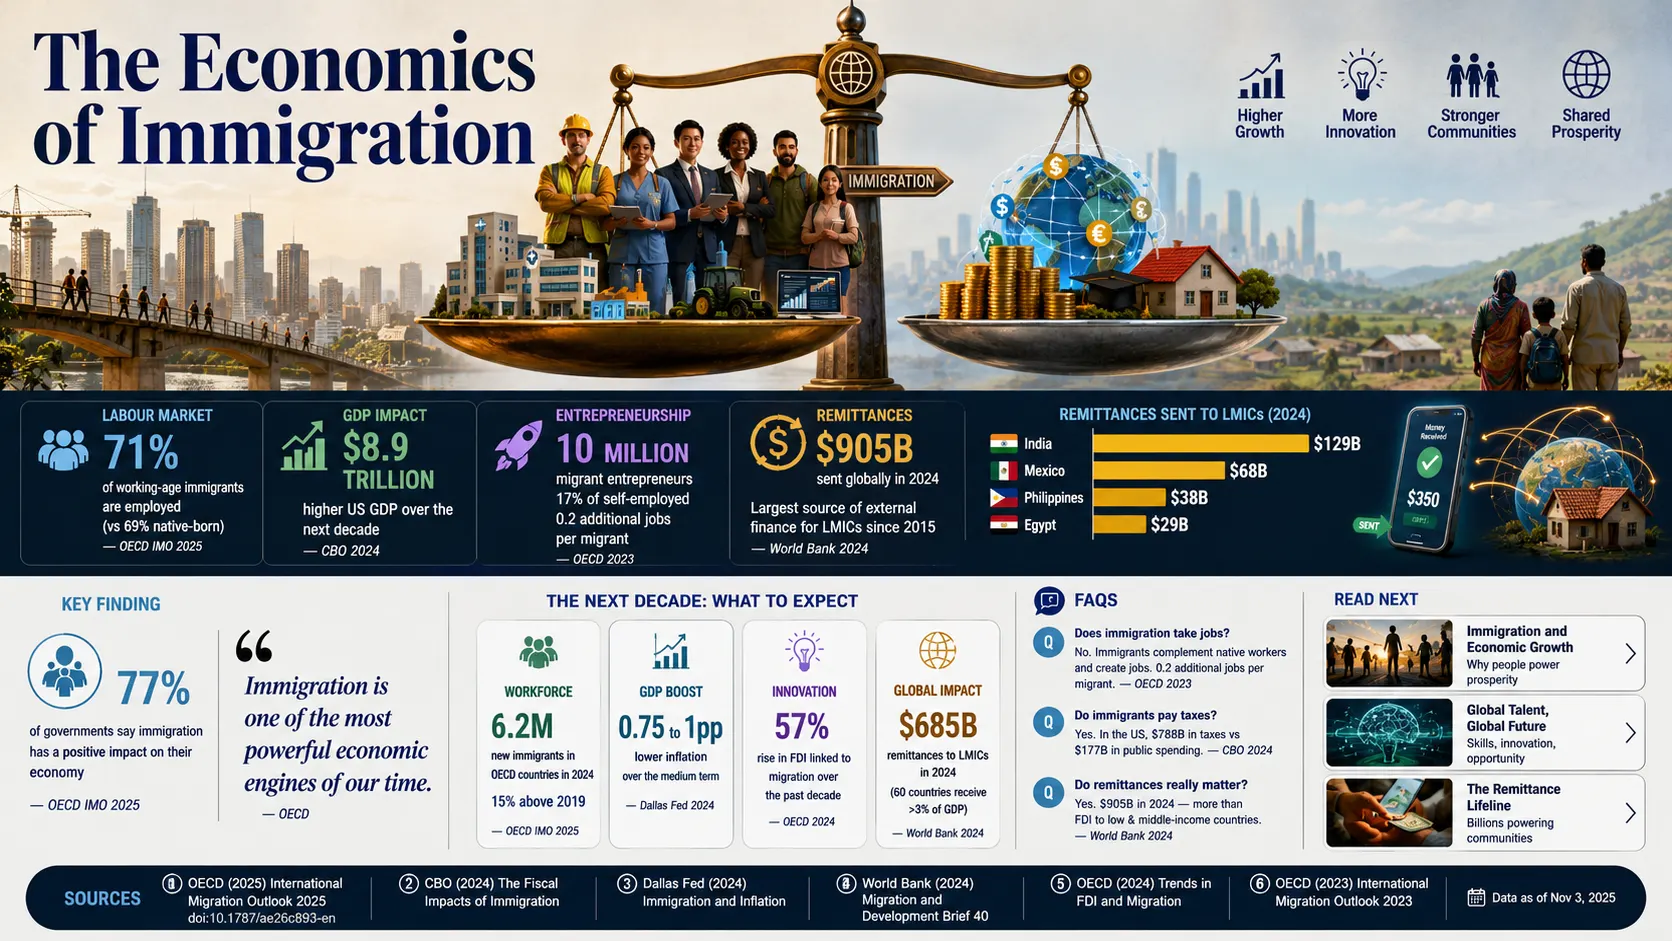
Editorial infographic showing the economics of immigration through a balance-scale metaphor, comparing immigrant workers, entrepreneurship, GDP growth, and global remittances with economic benefits for destination and origin countries. Economics of Immigration.
Compared: The Economics of Immigration — MacroDiscovery
MacroDiscovery
Migration Economics · 3 min read · OECD IMO 2025 · World Bank · CBO · Primary
OECD — International Migration Outlook 2025 (PRIMARY · oecd.org · doi.org/10.1787/ae26c893-en · November 3, 2025) · World Bank / IOM — World Migration Report 2026 (PRIMARY · worldmigrationreport.iom.int · remittances $905B, 2024) · CBO — Effects of the Immigration Surge (PRIMARY · April 2024) · Federal Reserve Bank of Dallas (PRIMARY · July 8, 2025)
Migration Economics · Global Comparison · 2024–2025 Data

Compared: The Economics
of Immigration

In 2024, almost 77% of immigrants in OECD countries were economically active — a higher rate than many native-born populations. The US immigration surge is projected to add $8.9 trillion to GDP by 2034. Migrants sent $905 billion home in 2024 — more than all foreign direct investment to developing countries combined. And when immigration fell sharply in the US in 2025, GDP growth fell with it.

By MacroDiscovery
Source: OECD International Migration Outlook 2025 (primary) · World Bank / IOM 2026 (primary)
Key finding: $905B remittances 2024 > all FDI to LMICs
77%
of OECD immigrants economically active in 2024 · 71% employed · <10% unemployed · OECD International Migration Outlook 2025 (primary)
$8.9T
US GDP boost projected 2024–2034 from immigration surge · CBO April 2024 (primary) · $788B taxes vs $177B federal spending
$905B
global remittances in 2024 · record · World Bank / IOM 2026 (primary) · exceeds all FDI to developing countries · largest external finance to LMICs
10M
migrant entrepreneurs in OECD (2022) · 17% of all self-employed · each additional migrant generates +0.2 jobs · OECD IMO 2024 (primary)
Visualization 01 — The Four Economic Dimensions of Immigration
How Immigrants Contribute to Host Economies — and Send Value Home

Four dimensions of the economics of immigration, based on OECD, World Bank, CBO, and Dallas Fed primary data. Each tells a different part of the same story: immigration is a large-scale economic force, and when it declines, economies feel it. Sources: OECD International Migration Outlook 2025 (PRIMARY · doi.org/10.1787/ae26c893-en · November 3, 2025) · OECD IMO 2024 (PRIMARY) · CBO April 2024 · Dallas Fed July 8, 2025 · World Bank / IOM World Migration Report 2026.

Labour Market · OECD 2024
71%
Immigrant employment rate in OECD countries, 2024. “Almost 77% economically active, with almost 71% employed and less than 10% unemployed.” — OECD IMO 2025 primary
In 2024, 6.2 million new permanent immigrants arrived in OECD — 15% above 2019 levels, even after a 4% decline from the 2023 record. The US alone received 1.4 million, a quarter of the OECD total. Immigrants account for over half of employees in accommodation and food services in both the US and OECD Europe. Family migration led; labour migration fell 21%.
GDP Contribution · US · CBO 2024
$8.9T
Projected US GDP boost from immigration surge 2024–2034. CBO (April 2024): immigrants projected to pay $788B in taxes vs $177B in federal spending — a net fiscal surplus of ~$611B.
The flip side is equally instructive: the Dallas Fed (July 8, 2025) estimates that the sharp decline in US immigration in 2025 reduced GDP growth by “0.75 to 1 percentage points” versus the CBO baseline. Immigration is not just an add-on to growth — it is a structural component. When it falls, growth falls. The OECD confirms: “the net fiscal impact is generally small, with a few exceptions where countries have large immigrant populations, such as Switzerland and Luxembourg, where the net fiscal impact is large and positive.”
Entrepreneurship · OECD 2022
10M
Migrant entrepreneurs in OECD countries (2022). 17% of all self-employed — up from 11% in 2006. Each additional migrant creates approximately 0.2 additional jobs. — OECD IMO 2024 primary
“Immigrants are not only competing workers; they are also employers.” The OECD IMO 2024 special chapter on migrant entrepreneurship shows immigrants disproportionately start businesses, contribute to innovation at rates comparable to native-born entrepreneurs, and create employment beyond their own labour supply. The growth in migrant self-employment from 11% to 17% of OECD totals in 16 years is one of the more significant structural shifts in advanced labour markets.
Remittances · World Bank / IOM 2024
$905B
Global remittances in 2024 — a record. LMICs received $685B — exceeding FDI by more than $270B. Tajikistan: 45.4% of GDP. India: $129B (top recipient). US: $100B+ (top sender).
Remittances have been the largest source of external finance to low- and middle-income countries other than China since 2015 — surpassing both official development aid and foreign direct investment. In more than 60 countries, remittances account for more than 3% of GDP. Unlike ODA or FDI, remittances go directly to households: they fund education, healthcare, and small business formation in communities that have no other access to international capital flows.
Top Remittance Senders and Receivers · 2024 · World Bank / IOM
🇺🇸 US (Sender)Top global sender since records began
$100B+
🇮🇳 India (Receiver)First country to cross $100B in remittances
$129B
🇲🇽 Mexico (Receiver)Remittances > oil export revenues since 2014
$68B
🇹🇯 Tajikistan45.4% of GDP = remittances — most dependent nation
45% GDP
Source: World Bank / IOM World Migration Report 2026 (PRIMARY · worldmigrationreport.iom.int). “Globally, remittance flows are estimated to have increased by 4.6 per cent from USD 865 billion in 2023 to USD 905 billion in 2024.” Remittances exceeded FDI flows to LMICs “by more than USD 270 billion in 2023” and have been the largest external finance source to LMICs other than China since 2015. “In more than 60 countries, remittances account for 3 percent or more of the Gross Domestic Product.”

Immigration is one of the most politically contested subjects in the world. It is also one of the most thoroughly studied in economics — and the economic evidence is more consistent than the political debate suggests. Immigrants work at high rates. They start businesses. They pay taxes. They send money home. And when host-country governments restrict their arrival, the effects show up quickly in labour markets and GDP growth.

OECD — International Migration Outlook 2025 (PRIMARY · doi.org/10.1787/ae26c893-en · November 3, 2025) · Dallas Fed (PRIMARY · July 8, 2025)
77%
“Almost 77% of immigrants were economically active, with almost 71% employed and less than 10% unemployed in 2024.” — OECD IMO 2025. When US immigration declined sharply in 2025, the Dallas Fed estimates GDP growth fell by “0.75 to 1 percentage points” versus baseline.
The OECD International Migration Outlook 2025 (primary, November 3, 2025) confirms 6.2 million new permanent immigrants arrived in OECD countries in 2024 — historically high at 15% above 2019 levels, despite a 4% decline from the 2023 record. The US alone received 1.4 million — a quarter of the OECD total. The immigrant employment rate is not just high in absolute terms; in many OECD countries immigrants are filling specific labour shortages in sectors where native-born workers are insufficient: healthcare, food services, construction, and logistics. Beyond employment: OECD IMO 2024 (primary) found 10 million migrant entrepreneurs in OECD countries in 2022 — 17% of all self-employed, up from 11% in 2006. Each additional migrant creates approximately 0.2 additional jobs through entrepreneurship and consumption demand alone.
Source: OECD — International Migration Outlook 2025 (PRIMARY · oecd.org · doi.org/10.1787/ae26c893-en · November 3, 2025 · “almost 77% of immigrants were economically active, with almost 71% employed and less than 10% unemployed in 2024” · “total of 6.2 million new permanent immigrants remains nevertheless historically high – 15% above 2019 levels” · “United States alone accounted for around a quarter of the total, with 1.4 million new permanent immigrants”) · OECD — International Migration Outlook 2024 (PRIMARY · “In 2022, there were 10 million migrant entrepreneurs in the OECD” · “17% of the self-employed in OECD countries on average were migrants, up from 11% in 2006” · “additional 0.2 jobs in the economy per additional migrant”) · Federal Reserve Bank of Dallas (PRIMARY · dallasfed.org · July 8, 2025 · “gross domestic product growth in 2025 is 0.75 to 1 percentage points lower than in a benchmark simulation”) · CBO — “Effects of the Immigration Surge on the Federal Budget and the Economy” (PRIMARY · April 2024 · “$8.9 trillion” GDP boost 2024–2034 · “$788 billion in taxes” vs “$177 billion in federal spending”)

“Remittances continued to be greater than Foreign Direct Investment, having increased by 57 per cent in the last decade in contrast to a 41 per cent reduction in FDI. Since 2015, remittances have been the largest source of external finance flows to low-and middle-income countries other than China.”

— IOM / World Bank, World Migration Report 2026 (PRIMARY · worldmigrationreport.iom.int · citing World Bank remittances data through 2024)

$905 Billion in Remittances — The Transfer the Public Finance Data Misses

Global remittances reached $905 billion in 2024 — a 4.6% rise from $865 billion in 2023. Of that, $685 billion went to low- and middle-income countries: more than all foreign direct investment to those economies by a margin of over $270 billion. Remittances have been the largest source of external finance flows to LMICs other than China since 2015 — larger than development aid, larger than FDI. The US is the world’s largest sender (over $100 billion in 2024). India is the largest recipient ($129 billion). For Tajikistan, remittances equal 45.4% of GDP. In over 60 countries, they represent more than 3% of GDP. These flows are not captured in standard immigration cost-benefit analyses. They are private money transfers that bypass government budgets entirely, arriving directly in households that use them for food, school fees, healthcare, and business investment. The remittance channel is one of the largest poverty-reduction mechanisms in the global economy — and it is funded by the wages of people working abroad.


Why it matters: the debate about immigration economics in high-income countries focuses almost entirely on the fiscal and labour market effects in destination countries. The remittance data inverts that frame: immigration also transfers enormous economic value from rich countries to poor ones, at scales that dwarf official development assistance. The economics of immigration is not just about what happens in Germany or the United States. It is about what happens in India, Mexico, and Tajikistan.
Key Numbers at a Glance
OECD Labour Market · 2024
77%
Immigrants economically active in OECD countries in 2024 — 71% employed, under 10% unemployed. 6.2M new permanent arrivals. US: 1.4M (25% of OECD total).
US GDP · CBO Projection 2024
$8.9T
Projected GDP boost from US immigration surge 2024–2034. $788B in taxes vs $177B in spending. Declining immigration cut 0.75–1pp from 2025 growth (Dallas Fed).
Remittances · World Bank 2024
$905B
Global remittances in 2024 — record. More than $270B above FDI to LMICs. Largest external finance to developing world since 2015. Tajikistan: 45% of GDP.
Entrepreneurship · OECD 2022
10M
Migrant entrepreneurs in OECD (2022). 17% of all self-employed — up from 11% in 2006. Each additional migrant creates ~0.2 jobs in the broader economy.
Frequently Asked Questions
Do immigrants help or hurt the economy?
The weight of economic evidence is that immigration helps host economies in aggregate, though the distribution of benefits and costs varies. In 2024, almost 77% of immigrants in OECD countries were economically active, with 71% employed and under 10% unemployed (OECD IMO 2025, primary). The US CBO (April 2024) projected the recent immigration surge would boost US GDP by $8.9 trillion over 2024–2034, with immigrants paying $788B in taxes versus $177B in federal services consumed. The Dallas Fed (July 2025) confirmed this in reverse: declining US immigration in 2025 reduced GDP growth by 0.75–1 percentage points versus baseline. The OECD notes the net fiscal impact is “generally small” in most countries, but “large and positive” in Switzerland and Luxembourg. Effects vary significantly by immigrant skill level, age at arrival, and integration outcomes.
How much money do immigrants send home globally?
Migrants sent $905 billion in remittances globally in 2024 — a record, up 4.6% from $865 billion in 2023 (World Bank / IOM World Migration Report 2026, primary). Of this, $685 billion went to low- and middle-income countries — exceeding all FDI to those economies by more than $270 billion. The US was the largest sender (over $100 billion). India was the largest recipient ($129 billion), followed by Mexico ($68 billion). In Tajikistan, remittances equal 45.4% of GDP. Since 2015, remittances have been the largest source of external finance to developing economies other than China — larger than all official development assistance. In more than 60 countries, remittances account for over 3% of GDP.
How many immigrants arrived in OECD countries in 2024?
6.2 million new permanent immigrants arrived in OECD countries in 2024 — historically high at 15% above 2019 pre-pandemic levels, though down 4% from the 2023 record (OECD International Migration Outlook 2025, primary). The United States alone received 1.4 million — approximately a quarter of the OECD total. Germany, Canada, the UK, and Spain each accounted for 7–11%. Family migration was the leading reason for permanent migration. Labour migration fell 21%. The OECD also counted 10 million migrant entrepreneurs in member countries as of 2022 — 17% of all self-employed, up from 11% in 2006, each generating approximately 0.2 additional jobs in the broader economy.
Sources
  • OECD — International Migration Outlook 2025 (PRIMARY · oecd.org · doi.org/10.1787/ae26c893-en · November 3, 2025 · “almost 77% of immigrants were economically active, with almost 71% employed and less than 10% unemployed in 2024” · “total of 6.2 million new permanent immigrants remains nevertheless historically high – 15% above 2019 levels” · “United States alone accounted for around a quarter of the total, with 1.4 million new permanent immigrants. Germany, Canada, the United Kingdom and Spain each contributed between 7% and 11%” · “Family remained the leading reason for permanent migration to OECD countries. Labour migration declined (−21%)”)
  • OECD — International Migration Outlook 2024 (PRIMARY · oecd.org · doi.org/10.1787/c6f3e803-en · November 2024 · “In 2022, 17% of the self-employed in OECD countries on average were migrants, up from 11% in 2006” · “There are an estimated additional 0.2 jobs in the economy per additional migrant” · “In 2022, there were 10 million migrant entrepreneurs in the OECD” · “Immigrants are not only competing workers; they are also employers”)
  • OECD — Economic Impact of Migration (PRIMARY · oecd.org/en/topics/sub-issues/economic-impact-of-migration.html · “the net fiscal impact is generally small, with a few exceptions where countries have large immigrant populations, such as Switzerland and Luxembourg, where the net fiscal impact is large and positive” · “immigrants account for over half of employees in accommodation and food services in OECD European countries and in the United States”)
  • CBO — “Effects of the Immigration Surge on the Federal Budget and the Economy” (PRIMARY · April 2024 · “greater level of immigration expected between 2024 and 2034 will boost gross domestic product (GDP) by $8.9 trillion” · “$788 billion in taxes” vs “$177 billion in federal mandatory spending” for surge population · net federal fiscal surplus ~$611B)
  • Federal Reserve Bank of Dallas — “Declining immigration weighs on GDP growth, with little impact on inflation” (PRIMARY · dallasfed.org · July 8, 2025 · “gross domestic product growth in 2025 is 0.75 to 1 percentage points lower than in a benchmark simulation using the Congressional Budget Office’s immigration projections through November 2024”)
  • IOM / World Bank — World Migration Report 2026, Chapter 2: International Remittances (PRIMARY · worldmigrationreport.iom.int · “Globally, remittance flows are estimated to have increased by 4.6 per cent from USD 865 billion in 2023 to USD 905 billion in 2024” · “Remittances continued to be greater than Foreign Direct Investment, having increased by 57 per cent in the last decade in contrast to a 41 per cent reduction in FDI. Since 2015, remittances have been the largest source of external finance flows to low-and middle-income countries (LMICs) other than China” · “exceeded Foreign Direct Investment (FDI) flows to LMICs by more than USD 270 billion in 2023” · “United States of America has consistently been the top remittance-sending country in the world, with a total outflow surpassing USD 100 billion in 2024” · India $129B · Mexico $68B · Tajikistan 45.4% of GDP · “In more than 60 countries, remittances account for 3 percent or more of the Gross Domestic Product”)
Macro Discovery

Sukh Dhaliwal

Sukh Dhaliwal is the founder of Macro Discovery, an independent digital publication covering AI, technology, science, future trends, and global innovation through visual storytelling and data-driven analysis.

Join WhatsApp

Join Now

Join Facebook

Follow us

Leave a Comment