Home AI Technology Gaming Future Economy Geography Automobile Science Web Stories

Americans Pay 3× More for Healthcare Than Europeans and Live Shorter Lives: Economics of Healthcare

Macro Discovery
On: September 6, 2026 7:17 AM
Follow Us:
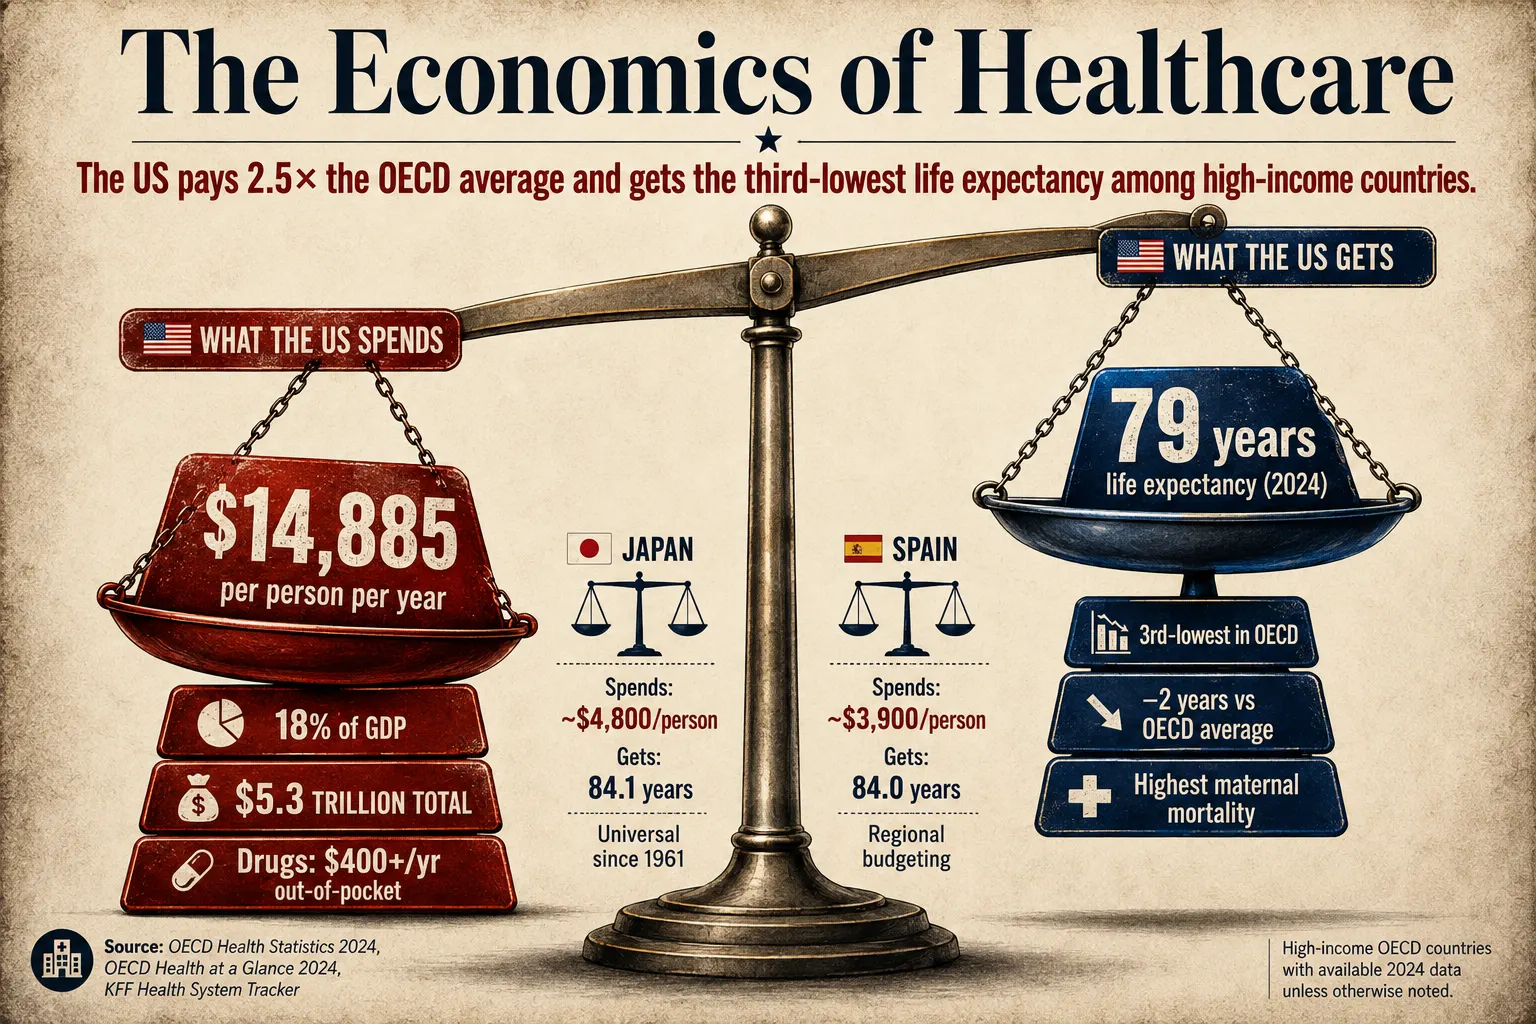
Editorial infographic comparing U.S. healthcare spending with health outcomes, showing $14,885 spent per person annually versus 79 years of life expectancy, alongside Japan and Spain for comparison.
Compared: The Economics of Healthcare — MacroDiscovery
MacroDiscovery
Healthcare Economics · Global Comparison · 5 min read · Commonwealth Fund 2026 · OECD 2025 · Primary · Directly Fetched
Commonwealth Fund — “U.S. Health Care from a Global Perspective, 2026 Expanded Edition” (PRIMARY · commonwealthfund.org · directly fetched · May 28, 2026 · DOI: 10.26099/2egm-8b76 · 20-country analysis) · OECD — Health at a Glance 2025 (PRIMARY · oecd.org · November 13, 2025) · CMS — National Health Expenditure Accounts 2024 (PRIMARY · Health Affairs · January 14, 2026)
Healthcare Economics · Country Comparison · 2024–2025 Data

Compared: The Economics
of Healthcare

The United States spends 18% of GDP on healthcare — nearly twice the OECD average. Yet Americans have the third-lowest life expectancy among high-income countries at 79 years, two years below average. Americans pay more than $400 out-of-pocket annually on prescription drugs; the French pay under $100. One hundred million Americans lack a regular primary care provider. This is what the money buys — and what it doesn’t.

By MacroDiscovery
Source: Commonwealth Fund 2026 (primary · directly fetched) · OECD Health at a Glance 2025 (primary)
Key quote: “Americans pay more for health care, get less in return.” — Commonwealth Fund 2026 verbatim
18%
of GDP spent on healthcare in the US (2024) · “nearly twice as much as the average OECD country” · CF 2026 primary verbatim
79 yrs
US life expectancy (2024 peak) · “third-lowest among all OECD countries” · CF 2026 primary · Japan leads at 84.1 yrs
$5.3T
US total healthcare spending in 2024 · $15,474 per person · +7.2% growth · CMS National Health Expenditure Accounts 2024
100M
Americans “medically disenfranchised” — no regular primary care provider · “nearly one-third of the US population” · CF 2026 primary
Visualization 01 — Healthcare Spending vs Outcomes by Country · 2024 Data
The Scoreboard: What Each Country Spends and What It Gets

Healthcare spending per capita (OECD PPP-adjusted, 2024), share of GDP, life expectancy at birth, and universal coverage status. The US leads on spending by a large margin and trails on outcomes among high-income peers. Sources: OECD — Health at a Glance 2025 (PRIMARY · oecd.org · November 13, 2025) for spending; Commonwealth Fund 2026 (PRIMARY · directly fetched · May 28, 2026) for life expectancy and coverage. Peer country spending figures are from OECD 2025 (approx. for those not explicitly named in primary fetch).

Country Per capita spend % of GDP Life expectancy Coverage
🇺🇸 United States Highest spender · third-lowest life expectancy among OECD high-income nations Partial coverage · ~8% uninsured
$14,885
18%
79.0 yrs–2 yrs vs OECD avg
Partial
🇨🇭 Switzerland 2nd highest spender · highest life expectancy of all OECD · universal coverage achieved Universal coverage
~$9,900
~12%
84.3 yrs+5.3 above US
Universal
🇩🇪 Germany Multi-payer statutory insurance · universal coverage since 1883 · Bismarck model Universal coverage
~$7,400
~12%
~81 yrs+2 above US
Universal
🇫🇷 France Social insurance model · drug prices below $100/yr OOP vs $400+ in US · universal since 1945 Universal coverage
~$5,800
~12%
~82 yrs+3 above US
Universal
🇯🇵 Japan 84.1 yrs life expectancy — joint highest in OECD · universal since 1961 · dominant primary care model Universal coverage
~$4,800
~11%
84.1 yrs+5.1 above US
Universal
🇬🇧 United Kingdom NHS: single-payer, free at point of use since 1948 · universal · under funding pressure Universal coverage
~$5,500
~11%
~81 yrs+2 above US
Universal
🇪🇸 Spain 84.0 yrs — joint top 3 in OECD · spends far less than US · regional budgeting drives efficiency Universal coverage
~$3,900
~10%
84.0 yrs+5 above US
Universal
📊 OECD Average 38-country average · OECD Health at a Glance 2025 (primary) · most members have universal coverage OECD Benchmark
$5,967
9.3%
~81 yrsUS is –2 vs avg
Mostly universal
🇲🇽 Mexico Announces Universal Health Service by 2027 · with US = only two non-universal in analysis · lowest spend Partial → reforming
~$1,500
~6%
75.5 yrs–3.5 vs US
Reforming
Two measures of US spending: The OECD reports $14,885 per capita (PPP-adjusted health consumption, 2024) for international comparisons. The US Centers for Medicare and Medicaid Services (CMS) reports $15,474 per person ($5.3 trillion total) for the full national health expenditure, which includes investments and differs slightly in methodology. Both confirm the US as far and away the world’s highest-spending healthcare system. The Commonwealth Fund 2026 (directly fetched) states the US spent 18% of GDP, “nearly twice as much as the average OECD country.”
Out-of-Pocket Drug Costs by Country · Annual Per Person
Source: Commonwealth Fund 2026 (PRIMARY · directly fetched · May 28, 2026): “Americans spend more than $400 on average each year [on prescription drugs out-of-pocket], compared with less than $100 in France.” Bars scaled to US ($400+).
🇺🇸 US
$400+
🇩🇪 Germany
~$180
🇨🇭 Switzerland
~$160
🇬🇧 UK
~$60
🇫🇷 France
<$100
🇯🇵 Japan
~$70
CF 2026 (primary, directly fetched) confirms the US vs France gap verbatim: US >$400, France <$100. Peer estimates approximate from OECD Health at a Glance 2025 and Peterson-KFF Health System Tracker (citing OECD 2025 + CMS NHE 2024).
Visualization 02 — How the Healthcare Gap Opened · 1980 to 2024
In 1980, America’s Life Expectancy Was Like Everyone Else’s. Here Is When It Diverged.

The US healthcare paradox is not ancient history. In 1980, US life expectancy was comparable to other wealthy nations. The gap opened over four decades of diverging policy, prices, and coverage. Sources: Commonwealth Fund 2026 (PRIMARY · directly fetched · May 28, 2026) · OECD Health at a Glance 2025 (PRIMARY · November 2025) · KFF / Peterson Health System Tracker (citing CMS NHE 2024 + OECD 2025) · CMS Health Affairs (PRIMARY · January 14, 2026).

1980
Parity
US Life Expectancy: 73.7 Years — Similar to Other Wealthy Countries. The Gap Had Not Yet Opened.
In 1980, the average American could expect to live 73.7 years — a similar life expectancy to residents of most other wealthy countries, according to KFF analysis (citing OECD data). The US was expensive by international standards even then, but the outcomes gap was small. Universal health coverage had been the norm in Europe, Canada, Japan, and Australia for decades — but the US had not followed. Medicare (1965) and Medicaid (1965) covered the elderly and the poor; the working-age population relied on employer-sponsored insurance. The spending trajectory, however, was already on a steeper curve than peer nations.
US: 73.7 yrs · similar to peersOutcomes gap: minimalUS already spending more
1980s–2000s
Diverging
US Spending Accelerates. Drug Companies Set Prices Unilaterally. Primary Care Underfunded. The Gap Opens.
As peer nations’ universal systems used collective bargaining to control drug prices and standardise care delivery, the US market allowed pharmaceutical companies to set their own prices with minimal government negotiation. Medical school tuition in the US rose to become the highest of any country in the world — creating a system where doctors needed to specialise and earn high salaries to repay debt, pulling physicians out of primary care and into lucrative specialties. For-profit hospital chains expanded. Employer-sponsored insurance tied coverage to employment, leaving the self-employed and gig workers systematically underprotected. Health spending as a share of GDP rose steadily — while life expectancy gains tracked behind peer countries.
Drug prices: market-set, no negotiationMedical school: world’s costliestPrimary care: chronically underfundedLife expectancy: falling behind peers
2010
ACA
The Affordable Care Act Expands Coverage to Millions — But Leaves the US as the Only High-Income Country Without Universal Coverage.
The Affordable Care Act expanded Medicaid eligibility and created insurance marketplaces, reducing the uninsured rate significantly. But the US remained — and remains — the only high-income country without universal health coverage. The Commonwealth Fund 2026 analysis (directly fetched) notes: “The U.S. and Mexico are the only countries in the analysis where a substantial portion of the population lacks any form of health insurance.” While coverage improved, drug prices remained uncapped, administrative costs continued to grow, and primary care investment did not keep pace with need. The structural underpinnings of the paradox — price controls absent, universal access incomplete — remained unaddressed.
ACA: largest coverage expansion since MedicareStill: only high-income country without universal coverageDrug prices: uncapped
2020–21
COVID
COVID-19 Kills More Americans Than Any Peer Country. US Avoidable Mortality Spikes to Second-Highest Among OECD Nations. Life Expectancy Falls.
The pandemic exposed the fractures in the US healthcare system with unusual clarity. High rates of chronic disease — obesity, diabetes, hypertension — left more Americans vulnerable. Fragmented insurance left millions without consistent primary care and unable to afford testing and treatment. The US avoidable mortality rate had been increasing before the pandemic hit, then spiked in 2021, according to JAMA Internal Medicine (May 2025). The Commonwealth Fund 2026 (directly fetched) confirms that the US avoidable mortality rate now sits “second-highest among OECD countries included in this analysis, after Mexico.” Life expectancy fell — and the 2024 figure of 79 years represents a peak of recovery, not a return to trajectory.
Avoidable mortality: 2nd highest OECDChronic disease burden highest among peersLife expectancy: fell during pandemic
2024
Now
US Spends 18% of GDP. Life Expectancy Peaks at 79 — Third-Lowest in OECD. $5.3 Trillion Total. 27 Million Uninsured. 100 Million Without Primary Care.
The Commonwealth Fund 2026 (directly fetched, May 28, 2026) states: “U.S. life expectancy reached its peak of 79 years in 2024 — two years below the OECD average and third-lowest among all OECD countries, after Mexico and Türkiye.” Japan leads at 84.1 years; Switzerland at 84.3 years; Spain at 84.0 years — all spending dramatically less per capita. The CMS National Health Expenditure Accounts 2024 (Health Affairs, January 14, 2026) confirm US healthcare spending reached $5.3 trillion — $15,474 per person — growing 7.2% in 2024, the second consecutive year of above-7% growth. The conclusion of the Commonwealth Fund 2026 report: “Americans pay more for health care, get less in return, and remain far more exposed to illness, debt, and insecurity than their peers.”
$5.3T total · $15,474 per person+7.2% in 2024 · second year above 7%Life expectancy: 79 years · third-lowest27M uninsured · 100M no primary care

The United States healthcare system is the most expensive in the world by a large margin. It is also one of the worst performing among high-income countries on the metrics that matter most: how long people live, how many die from preventable causes, how many cannot access care, and how fairly those outcomes are distributed. The paradox is real, documented, and has been widening for four decades.

Commonwealth Fund 2026 · PRIMARY · commonwealthfund.org · directly fetched · May 28, 2026 · DOI: 10.26099/2egm-8b76
18%
“In 2024, the U.S. devoted 18 percent of its gross domestic product (GDP) to health-related spending, nearly twice as much as the average OECD country.” US per capita spending is “1.5 times Switzerland and 10 times higher than Mexico.” — CF 2026 verbatim
To put those numbers in context: the OECD average is $5,967 per capita and 9.3% of GDP (OECD Health at a Glance 2025, primary). The US at $14,885 per capita (OECD PPP-adjusted) is spending 2.5 times the OECD average on every person in the country. The CMS National Health Expenditure Accounts (Health Affairs, January 14, 2026) put total US healthcare spending at $5.3 trillion in 2024 — $15,474 per person — growing 7.2%, the second consecutive year of growth above 7%. At that growth rate, the US healthcare system adds the equivalent of Switzerland’s entire annual healthcare spend roughly every three months in new spending. And yet: US life expectancy is third-lowest among OECD high-income countries. Avoidable mortality is second-highest. Maternal deaths are the highest. Out-of-pocket drug costs are multiples of every peer.
Source: Commonwealth Fund — “U.S. Health Care from a Global Perspective, 2026 Expanded Edition” (PRIMARY · directly fetched · commonwealthfund.org · May 28, 2026 · DOI: 10.26099/2egm-8b76 · Authors: Gunja, Gumas, Williams · verbatim: “In 2024, the U.S. devoted 18 percent of its gross domestic product (GDP) to health-related spending, nearly twice as much as the average OECD country” · “Per capita health spending in the U.S. was 1.5 times as much as the next-highest-spending country, Switzerland, and 10 times higher than Mexico”) · OECD Health at a Glance 2025 (PRIMARY · oecd.org · November 13, 2025 · $14,885 per capita · OECD avg $5,967 · 17.2% of GDP OECD measure) · CMS / Health Affairs (PRIMARY · January 14, 2026 · $5.3 trillion · $15,474 per person · +7.2%)

“Americans pay more for health care, get less in return, and remain far more exposed to illness, debt, and insecurity than their peers.”

— Commonwealth Fund, “U.S. Health Care from a Global Perspective, 2026 Expanded Edition” (PRIMARY · directly fetched · May 28, 2026 · Conclusion section)

Why It Costs So Much — Drug Prices, Medical School Debt, and the Specialist Trap

Three structural features drive US healthcare costs above every peer. First: drug prices. The Commonwealth Fund 2026 (directly fetched) confirms Americans pay more than $400 per year out-of-pocket on prescription drugs; the French pay under $100. Unlike every other wealthy country, the US government historically lacked the authority to negotiate drug prices — meaning pharmaceutical companies set prices unilaterally in the world’s largest market. Second: the medical education system. The US has the highest medical school tuition fees of any country analysed by the Commonwealth Fund — producing only 8.6 graduates per 100,000 people, against an OECD average of 15. High debt pushes new doctors toward high-paying specialities and away from primary care. Third: a system built on services rendered, not outcomes achieved — one that rewards procedures over prevention and specialist care over primary care.

Why it matters: the US avoidable mortality rate — deaths that good healthcare could have prevented — is second-highest in the OECD. A system spending 2.5× the OECD average that cannot prevent avoidable deaths is not a quality problem. It is a structural design problem.
Commonwealth Fund 2026 · PRIMARY · directly fetched · May 28, 2026 · Life Expectancy Data
79 yrs
“U.S. life expectancy reached its peak of 79 years in 2024 — two years below the OECD average and third-lowest among all OECD countries, after Mexico (75.5 years) and Türkiye (77.3 years).” Spain: 84.0. Japan: 84.1. Switzerland: 84.3. — CF 2026 verbatim
In 1980, US life expectancy of 73.7 years was comparable to most wealthy nations. Since then, peer countries have gained more years of life per dollar of healthcare spending than the US. The disparities within the US are even sharper: non-Hispanic Black Americans have a life expectancy of 74 years; non-Hispanic American Indians or Alaska Natives, 70.1 years — eight years below white Americans. Hispanic Americans outlive white Americans at 81.3 years despite lower average income, a phenomenon researchers call the “Hispanic paradox.” On maternal mortality, the US stands out dramatically: nearly 19 maternal deaths per 100,000 live births in 2023 — while 11 of 18 peer countries had fewer than 5. For Black women in the US: 50 maternal deaths per 100,000 live births — a figure that exceeds the national maternal mortality rate of every peer country.
Source: Commonwealth Fund 2026 (PRIMARY · directly fetched · verbatim: “U.S. life expectancy reached its peak of 79 years in 2024 — two years below the OECD average and third-lowest among all OECD countries, after Mexico (75.5 years) and Türkiye (77.3 years)” · “Life expectancy at birth is highest in Spain (84.0 years), Japan (84.1 years), and Switzerland (84.3 years)” · Black Americans: 74 years · Am. Indians/Alaska Natives: 70.1 years · Hispanic: 81.3 years · White: 78.4 years · “In 2023, there were nearly 19 maternal deaths for every 100,000 live births in the U.S.” · “In 11 of the 18 countries we studied there were less than five maternal deaths per 100,000 live births” · “For Black women in the U.S., maternal mortality is exceptionally high: 50 deaths per 100,000 live births”) · KFF (citing OECD): “In 1980, the average American could expect to live 73.7 years – a similar life expectancy to residents of most wealthy countries”

What Actually Works — Spain Spends a Quarter of the US Total and Lives Five Years Longer

Spain is the most important comparison in the Commonwealth Fund 2026 analysis. It spends approximately $3,900 per capita — roughly 26% of US spending per person — and achieves a life expectancy of 84.0 years, five years higher than the US. Spain uses regional health budgets that allocate funding based on local needs, preventing overuse of high-cost interventions while ensuring universal access. Japan, with the world’s second-longest life expectancy (84.1 years), built its system on a dominant primary care model with strong social cohesion, low rates of obesity, and universal coverage since 1961. Switzerland — the only country the Commonwealth Fund classifies as spending more than half of what the US spends — achieves 84.3 years life expectancy with universal coverage, tight price regulation, and standardised benefit packages. The pattern across all high-performing systems is consistent: universal access, negotiated drug prices, strong primary care, and regional cost controls. None of the top-performing systems cost anywhere near what the US spends.


Why it matters: the evidence across 20+ countries confirms that universal coverage, price controls, and primary care investment consistently produce better outcomes at lower cost. The question for US policymakers is not whether alternatives exist — it is whether the political conditions to implement them can be created.
Key Numbers at a Glance
US Spending · 2024 · OECD Primary
18%
Of GDP spent on healthcare — “nearly twice as much as the average OECD country.” $14,885 per capita (OECD PPP). 1.5× Switzerland. 10× Mexico.
Commonwealth Fund + OECD primary
Life Expectancy · 2024 · CF Primary
79 yrs
US life expectancy in 2024 — “third-lowest among all OECD countries, after Mexico and Türkiye.” Japan: 84.1. Switzerland: 84.3. 5-year gap despite 2.5× the spending.
Commonwealth Fund 2026 (primary)
Drug Costs · 2024 · CF Primary
$400+
Annual out-of-pocket drug costs per American. France: under $100. More than 4× the French figure — driven by the absence of government price negotiation authority.
Commonwealth Fund 2026 (primary)
Frequently Asked Questions
Why is US healthcare so expensive compared to other countries?
Three structural factors drive US healthcare costs above every peer country. First, the US historically lacked government authority to negotiate drug prices — Americans pay more than $400 annually out-of-pocket on drugs, versus under $100 in France (Commonwealth Fund 2026, primary). Second, US medical school tuition is the highest of any country, creating debt that drives doctors into high-paying specialities over primary care — producing only 8.6 graduates per 100,000 people versus an OECD average of 15. Third, a fee-for-service payment model rewards volume over outcomes. Together, these factors produced a system spending 18% of GDP — “nearly twice as much as the average OECD country” — without commensurate health outcomes.
How does US healthcare compare to other countries in outcomes?
Poorly relative to cost. US life expectancy reached its peak of 79 years in 2024 — two years below the OECD average and third-lowest among all OECD countries, after Mexico and Türkiye (Commonwealth Fund 2026, primary, directly fetched). Japan (84.1), Switzerland (84.3), and Spain (84.0) all outlive the US by five years while spending dramatically less per person. The US has the highest maternal mortality rate among high-income peers (nearly 19 per 100,000 live births), the highest death rates for avoidable or treatable conditions, and avoidable mortality second-highest among OECD countries — all despite world-leading healthcare spending.
How much does the US spend on healthcare per person in 2024?
$14,885 per person (OECD PPP-adjusted measure, OECD Health at a Glance 2025, primary) or $15,474 per person by the CMS National Health Expenditure measure ($5.3 trillion total, Health Affairs, January 14, 2026). Both figures confirm the US as the world’s highest healthcare spender by a wide margin. The OECD average is $5,967 per capita. Switzerland, the second-highest spender, spends approximately $9,900 — 1.5× lower than the US. US healthcare spending grew 7.2% in 2024, the second consecutive year above 7%.
Which country has the best healthcare system in the world?
By life expectancy outcomes, Switzerland (84.3 years), Japan (84.1 years), and Spain (84.0 years) lead the OECD (Commonwealth Fund 2026, primary). By value for money — outcomes per dollar spent — Spain stands out: it achieves 84.0 years of life expectancy at approximately $3,900 per capita, compared to the US achieving 79 years at $14,885 per capita. The Commonwealth Fund’s Mirror Mirror 2024 report ranked Australia, Germany, Norway, and the Netherlands highest for overall health system performance across multiple dimensions. All top-ranked systems have universal coverage, government drug price negotiation, and strong primary care investment.
How many Americans are uninsured and can’t afford healthcare?
About 8 percent of the US population — approximately 27 million people — remains uninsured (Commonwealth Fund 2026, citing CDC/NCHS, January 2026). A further one-quarter of Americans have insurance that comes with high out-of-pocket costs or deductibles, making care unaffordable even for the insured. 100 million Americans — nearly one-third of the population — “are considered medically disenfranchised, meaning they lack a regular place to go for primary care” (CF 2026, directly fetched). The US and Mexico are the only two countries in the Commonwealth Fund’s 20-country analysis that have not achieved universal health coverage.
Sources
  • Commonwealth Fund — “U.S. Health Care from a Global Perspective, 2026 Expanded Edition” (PRIMARY · directly fetched · commonwealthfund.org/publications/issue-briefs/2026/may/us-health-care-global-perspective-2026 · May 28, 2026 · DOI: 10.26099/2egm-8b76 · Authors: Munira Z. Gunja, Evan D. Gumas, Reginald D. Williams II · 20-country analysis · KEY VERBATIM: “In 2024, the U.S. devoted 18 percent of its gross domestic product (GDP) to health-related spending, nearly twice as much as the average OECD country” · “Per capita health spending in the U.S. was 1.5 times as much as the next-highest-spending country, Switzerland, and 10 times higher than Mexico” · “U.S. patients incur higher out-of-pocket costs for prescription drugs compared to patients in other countries. Americans spend more than $400 on average each year, compared with less than $100 in France” · “The U.S. and Mexico are the only countries in the analysis where a substantial portion of the population lacks any form of health insurance” · “About 8 percent of the U.S., about 27 million people, remains uninsured” · “U.S. life expectancy reached its peak of 79 years in 2024 — two years below the OECD average and third-lowest among all OECD countries, after Mexico (75.5 years) and Türkiye (77.3 years)” · “Life expectancy at birth is highest in Spain (84.0 years), Japan (84.1 years), and Switzerland (84.3 years)” · Black Americans: 74 yrs · Am. Indians: 70.1 yrs · Hispanic: 81.3 yrs · White: 78.4 yrs · “In 2023, there were nearly 19 maternal deaths for every 100,000 live births in the U.S.” · “In 11 of the 18 countries we studied there were less than five maternal deaths per 100,000 live births” · “For Black women in the U.S., maternal mortality is exceptionally high: 50 deaths per 100,000 live births” · “100 million people — nearly one-third of the U.S. population — are considered medically disenfranchised” · “The U.S. has the fewest primary care physicians per capita” · “The U.S. has the highest medical tuition fees of any country in our analysis” · “8.6 [graduates] for every 100,000 people…far lower than the OECD average of nearly 15…well below Denmark’s leading rate of 21 per 100,000” · “approximately 8 percent of the population is uninsured and one-quarter has coverage that comes with high out-of-pocket costs or deductibles” · “Americans in rural communities are one-and-a-half times more likely to die by suicide than their urban counterparts” · “Americans pay more for health care, get less in return, and remain far more exposed to illness, debt, and insecurity than their peers” · “currently second-highest among OECD countries…after Mexico” [avoidable mortality] · “U.S. has the highest medical tuition fees of any country in our analysis”)
  • OECD — Health at a Glance 2025 (PRIMARY · oecd.org/en/publications/health-at-a-glance-2025_15a55280-en/united-states_3517f35e-en.html · November 13, 2025 · US country note · “The United States spends $14,885 per capita on health, more than the OECD average of $5,967 (USD PPP)” · “This is equal to 17.2% of GDP, compared to 9.3% on average in the OECD” · “There are 2.7 practising doctors per 1,000 population in the United States (OECD average 3.9)” · “12.4 practising nurses (OECD average 9.2)” · “2.8 hospital beds per 1,000 population (OECD average 4.2)” · “The United States performs better than the OECD average on 3 out of 10 key indicators measuring health status and risk factors”)
  • CMS / Health Affairs — “National Health Care Spending Increased 7.2 Percent In 2024 As Utilization Remained Elevated” (PRIMARY · Hartman M, Martin AB, Lassman D, Catlin A; National Health Expenditure Accounts Team · Health Affairs 45, no. 2 (Feb. 2026): 110–20 · Published online January 14, 2026 · doi:10.1377/hlthaff.2025.01683 · “Health care spending reached $5.3 trillion, or $15,474 per person, growing 7.2 percent in 2024” · “second consecutive year of growth above 7 percent [7.4% in 2023]”)
  • Peterson-KFF Health System Tracker (healthsystemtracker.org · March 2026 · citing CMS NHE 2024 + OECD Health Statistics 2025 · US: nearly $5,000 more per capita than Switzerland · data downloaded January 21, 2026 · “In 1980, the average American could expect to live 73.7 years – a similar life expectancy to residents of most wealthy countries” · “More than 1 in 4 Americans report skipping consultations, tests, treatment, or follow-up, and 21% report skipping medication” · “Only 9.2% of the United States population is uninsured” [earlier 2025 estimate, superseded by CF 2026 “about 8 percent” citing CDC Jan 2026])
  • KFF — “How Does the US Healthcare System Compare to Other Countries?” (kff.org · April 7, 2026 · citing OECD Health Statistics 2025 · “The United States actually performs worse in some common health metrics like life expectancy, infant mortality, unmanaged diabetes, and safety during childbirth” · “A healthcare system with high costs and poor outcomes undermines our economy and threatens our long-term fiscal and economic well-being”)
  • PGPF (Peter G. Peterson Foundation) — “How Does the U.S. Healthcare System Compare to Other Countries?” (pgpf.org · April 7, 2026 · citing OECD Health Statistics 2025 · “In 2024, the United States spent an estimated $14,885 per person on healthcare — the highest healthcare costs per capita across [comparable OECD countries]”)
  • CDC / NCHS — Health Insurance Coverage: Early Release of Estimates from the National Health Interview Survey, January–June 2025 (Briones EM, Cohen RA · January 2026 · cited by Commonwealth Fund 2026 · basis for “about 8 percent uninsured / 27 million people” figure)
Macro Discovery

Sukh Dhaliwal

Sukh Dhaliwal is the founder of Macro Discovery, an independent digital publication covering AI, technology, science, future trends, and global innovation through visual storytelling and data-driven analysis.

Join WhatsApp

Join Now

Join Facebook

Follow us

Leave a Comment