How Humans Spend 80 Years
How humans spend 80 years. The pie chart everyone shares.
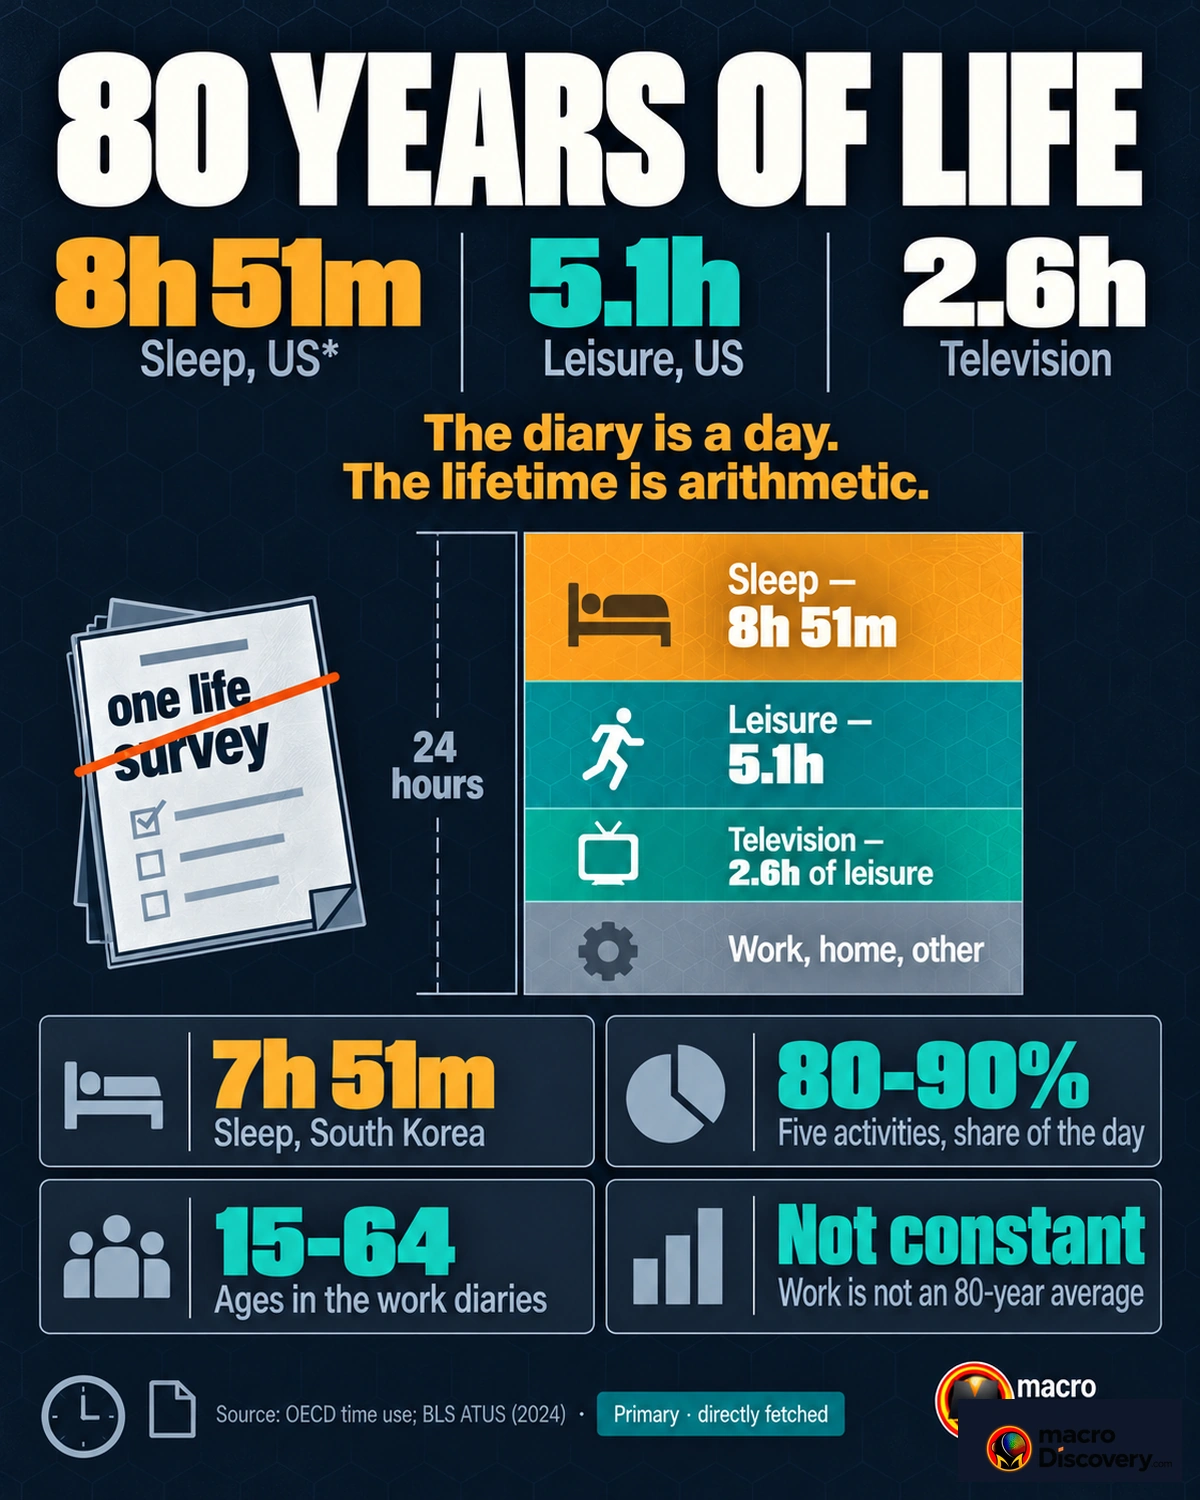
The 26-year sleep slice is a multiplication. The diary is one adult day in the United States. Television is 2.6 hours. Work is 8.1 hours only on days worked.
80 Years of Life
Three numbers
- 2.6 hours — television on an average day in 2024, more than half of leisure time, which was 5.1 hours. Source: US time-use diary.
- 8.1 hours — work by full-time employees on days they worked. Not every day. Source: US Bureau of Labor Statistics.
- 26 years — the usual sleep slice of an 80-year chart. That is 7.8 hours a day from birth. A multiplication, not a counted life. Source: the chart, not a diary.
What the data shows
A common claim is that a pie chart shows how a human spends 80 years: about 26 asleep, a decade on screens, and the rest in named slices. The fact is that the pie is one adult diary day, stretched. The US American Time Use Survey asks people 15 and older what they did yesterday. It is not a life, and it is not the world. In 2024, watching television averaged 2.6 hours a day, more than half of leisure, which was 5.1 hours. Men spent 5.5 hours on leisure and women 4.7. Adults 75 and over spent 7.6 hours. Adults 35 to 44 spent 3.8. A single slice for screens flattens that.
Work is not 8 hours of every day in an 80-year life. Full-time employees averaged 8.1 hours on days they worked: 8.4 hours on a weekday and 5.6 on a weekend day. Eighty-seven percent worked on an average weekday. Twenty-nine percent worked on an average weekend day. Childhood, school, and retirement are in the 80 years and not in that 8.1. Multiplying a workday by 29,200 days counts jobs that were not held. In 2025, 81% of people did household work on an average day, about 2 hours. Eighty-seven percent of women and 75% of men did some. On the days they did it, women spent 2.8 hours and men 2.1.
The sleep slice is the clearest multiplication. Twenty-six years of 80 is 7.8 hours a day, every day, from birth. An analysis of the same diary for ages 15 to 74 puts recent sleep, including naps, near 8.9 hours a day, about 36% of the day, up from about 8.5 hours two decades ago. Childhood sleep is longer than that. A diary that starts at 15 cannot fill the first slice of an 80-year pie. The chart is a teaching picture. It is not a counted life.
The 26-year sleep slice is not on this chart. It is 7.8 hours a day times 80 years.
| Count | Figure | What it is |
|---|---|---|
| Television, 2024 | 2.6 hours a day | More than half of leisure |
| Leisure, 2024 | 5.1 hours | Men 5.5, women 4.7 |
| Work, days worked | 8.1 hours | 87% of weekdays, 29% of weekend days |
| Household, 2025 | about 2 hours | 81% did some |
| Sleep slice on the chart | 26 years | 7.8 hours a day from birth. Not a diary |
How it was measured
The diary is a sample of yesterday for US civilians 15 and older. A primary activity is the main thing being done. Television watched while eating can be coded as one or the other. Hours on days worked are not hours on an average day of life. Weekend days are in the average, which is why a work figure below 8 hours a day is not a short shift.
A lifetime pie multiplies one rate by 80 years. That assumes the rate holds from birth to death, for both sexes, in every country. The diary does not. Sleep in the file includes naps and waking. An analysis of the microdata is not the same object as the Bureau’s published table.
What it means
It is settled that the 2024 US diary puts television at 2.6 hours a day and full-time work at 8.1 hours on days worked. It is not settled that an 80-year pie is a counted life. Use 2.6 hours for television. Use 8.1 hours for work on days worked. Use 26 years only as the chart’s multiplication. Do not treat the pie as a biography.
Common misreadings
- Twenty-six years asleep is 7.8 hours a day from birth. It is not a counted life.
- Work is 8.1 hours on days worked. Most weekend days are not workdays.
- The diary is the United States, ages 15 and up. It is not the world, and it is not childhood.
Where the numbers come from
How we built this
- Dataset: BLS American Time Use Survey for 2024 and 2025; a secondary reading of the sleep series.
- Scope: One US diary day. The 80-year pie treated as a multiplication, not a life table.
- Figures: 2.6 hours is television. 8.1 hours is work on days worked. 26 years is the chart’s sleep slice, equal to 7.8 hours a day from birth.