
How Much a Human Life Is Worth —
by Country
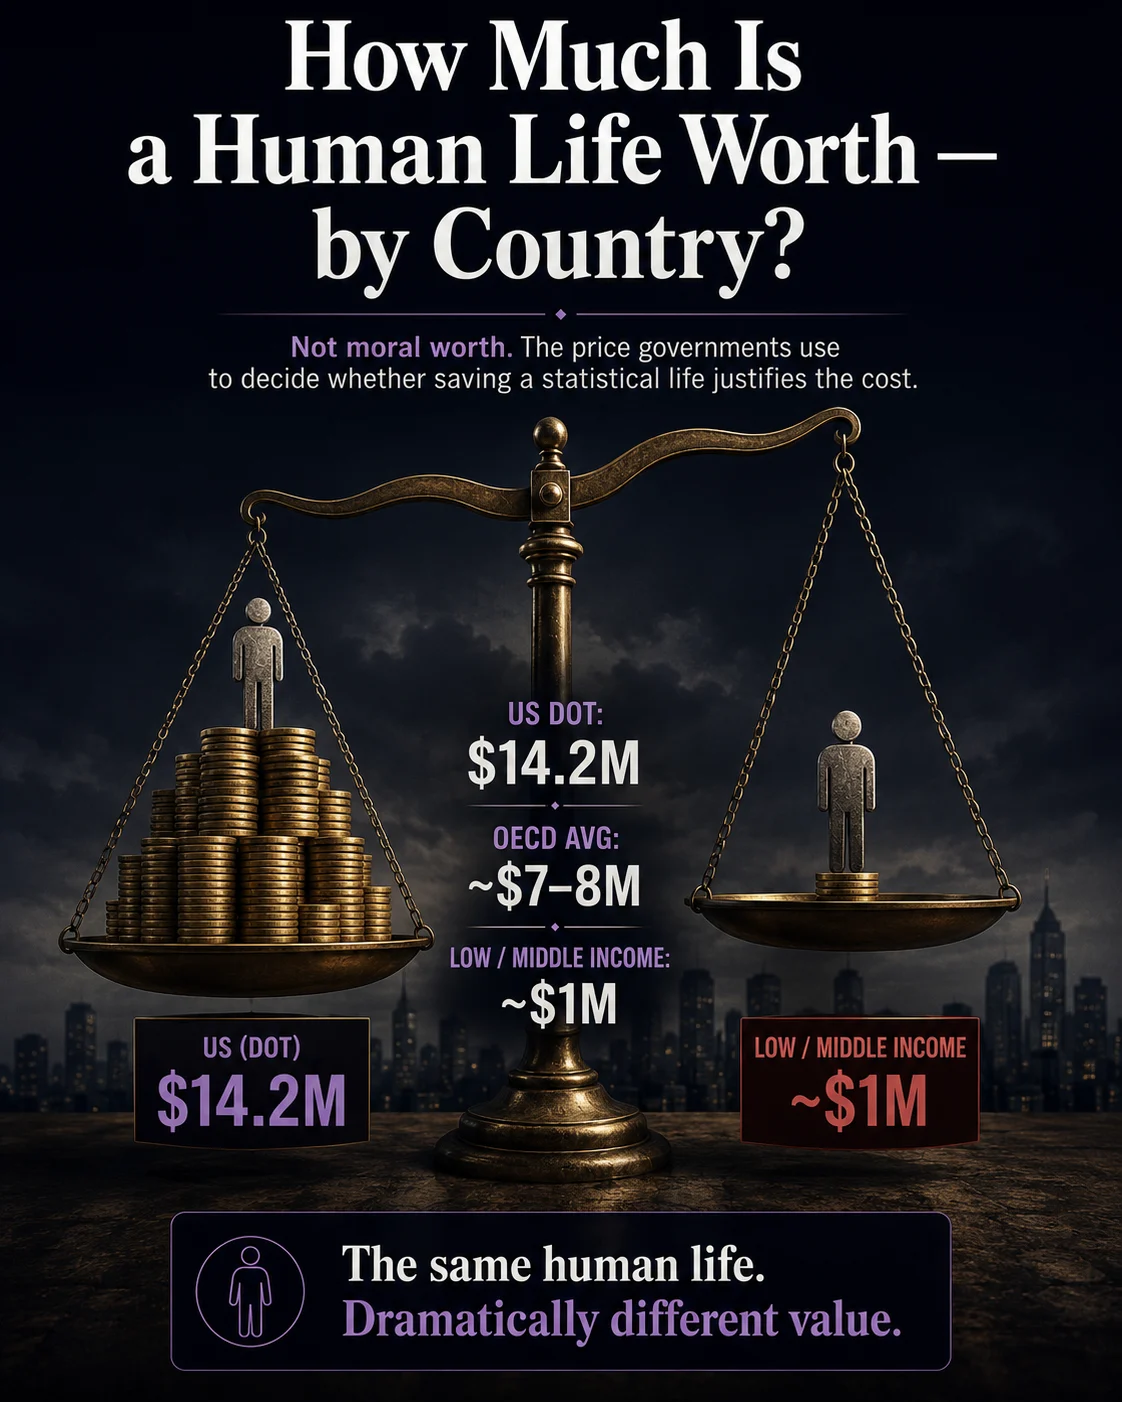
The US Department of Transportation officially values a statistical life at $14.2 million. OECD countries average $7–9 million. In low- and middle-income countries, the figure falls to approximately $1 million. These numbers do not reflect what a life is worth in any moral sense — no government claims they do. They are a policy tool: a way of calculating whether a safety regulation’s benefits outweigh its costs. But the tool has real consequences. Countries with lower values invest less in safety regulations. Workers in poor countries face more dangerous conditions, partly because the calculation says their lives cost less to risk. The same number that justified the US Clean Air Act — which generated trillions in health benefits — also shapes how much protection a worker in Bangladesh or Nigeria receives.
- The VSL is not what a life costs — it is what a government decides is worth spending to save one. The Value of a Statistical Life reflects willingness to pay for small reductions in mortality risk, aggregated across a population. It is derived from real-world data: wage premiums workers demand for dangerous jobs, consumer spending on safety features, and survey responses about risk preferences. It does not say any individual life is worth a fixed sum. It says: at this level of risk reduction, this is what society’s revealed preferences suggest people are willing to pay in aggregate. The distinction matters because the number has enormous practical consequences for which regulations get implemented and which do not.
- The US Department of Transportation sets the world’s highest official government VSL at $14.2 million for 2025. This figure, updated annually from the DOT’s 2013 comprehensive guidance methodology, is used to evaluate every transportation safety regulation in the United States. A road safety improvement that costs $100 million must save the equivalent of 7 statistical lives ($100M ÷ $14.2M) to pass a basic cost-benefit test. By this measure, the US treats each prevented traffic fatality as worth $14.2 million in regulatory effort. Different US agencies use different VSL figures, creating a structural inconsistency where the same American life is valued differently depending on which agency governs the risk. Source: US DOT (primary · directly fetched · 2025).
- OECD’s landmark 2025 meta-analysis found a 7- to 8-fold gap between rich and poor countries. The OECD’s “Mortality Risk Valuation in Policy Assessment” (October 2025, primary), the most comprehensive global VSL analysis ever conducted, synthesised 277 studies and more than 4,000 estimates from 1973 to 2023. Its central finding: the mean base VSL in low- and middle-income countries is approximately $1 million, while OECD member countries average $7.1–7.7 million and the EU averages $7.6–8.7 million. The same OECD report provides a methodology for adjusting VSL estimates by country income level, using GDP per capita ratios. This means, mechanically, that as a country gets richer its regulatory protection of life automatically increases — and as a country remains poor, its standard remains low. Source: OECD (primary · October 2025 · doi:10.1787/76ca89a2-en).
- When the EPA put VSL at zero, it effectively said air pollution regulation generated no measurable benefits. The EPA’s VSL has not been formally updated since the late 1990s and in recent regulatory analyses under the Trump administration was set at or near zero for certain rulemakings — a move reported by the New York Times as “Trump’s EPA Has Put a Value on Human Life: Zero Dollars.” Resources for the Future (RFF) documented the consequences: when the VSL is zeroed, the billions of dollars in air quality and health benefits from environmental regulations disappear from the cost-benefit calculation, making any regulation appear unjustifiable on economic grounds regardless of its actual public health impact. The Clean Air Act’s benefits from 1970 to 1990 were estimated at $5.6 to $49.4 trillion against costs of $523 billion — a ratio achievable only because the VSL was included in the benefits calculation.
- The VSL’s income relationship creates a troubling global dynamic: poorer countries get less protection because their lives are assigned lower values. The OECD meta-analysis confirms that VSL rises with income, using an income-elasticity adjustment that scales VSL in proportion to GDP per capita. The W2Economics/World Bank study (published in Traffic Injury Prevention) found VSL-to-income ratios of approximately 46× GNI per capita in low-income countries, rising to 76–77× in high-income countries. A road safety or workplace hazard regulation in a low-income country is harder to justify on cost-benefit grounds than the identical regulation in a high-income country. This creates a vicious cycle: less economic justification for safety investment leads to more dangerous conditions, which leads to more deaths, in precisely the countries least able to bear that burden. Source: W2Economics/World Bank (Traffic Injury Prevention) · OECD 2025 (primary).
Sources: US DOT $14.2M: US Department of Transportation (primary · directly fetched · 2025 · transportation.gov). EU $7.6–8.7M and OECD $7.1–7.7M and LMIC ~$1M: OECD “Mortality Risk Valuation in Policy Assessment” (primary · October 2025 · doi:10.1787/76ca89a2-en). Canada ~$4.5–5M: Policy Research Initiative ($6.5M CAD 2007, converted). Australia ~$3.8M USD: Australia OIA (A$5.87M 2025, primary, AUD/USD approximately 0.65). Sweden ~$2.6M: Wikipedia citing Swedish Transport Analysis recommendation (22M SEK, €2.4M at ~1.1 USD/EUR). *US EPA: Resources for the Future (2023) reports EPA VSL not updated since late 1990s; New York Times/RFF report EPA effectively set VSL near zero in Trump-era rulemakings. Bar lengths proportional to USD values; EPA bar at zero reflects effective policy outcome, not official figure.
| US Agency | VSL figure used | Last updated | Implications | Status |
|---|---|---|---|---|
US DOTDept of Transportation |
$14.2M (2025) | Annual updates from 2013 methodology | Every road, rail, aviation, and pipeline safety regulation evaluated against $14.2M per prevented fatality. High VSL supports aggressive safety investment. Falcon 9 reuse, seatbelt laws, bridge upgrades all evaluated here. | Current · Gold standard |
US HHS/ASPEHealth & Human Services |
Updated 2025 | Updated February 2025 to 2024 base year (+49% vs 2013) | Used for healthcare, drug safety, and public health regulations. HHS underwent structured expert review in 2016 to update its VSL; set separately from DOT using same underlying literature but different income adjustments. | Current · Updated 2025 |
US EPAEnvironmental Protection Agency |
~$7.4M (official) / $0 (effective) | Official VSL not updated since late 1990s; in recent rulemakings set to zero | The EPA’s failure to update its VSL means air and water pollution regulations are evaluated against a 25-year-old benchmark. When EPA set VSL to zero in recent analyses, it made it mathematically impossible for any pollution regulation to show positive net benefits. RFF: “Reexamination of the VSL is imperative.” | ⚠ Crisis · Zero in use |
US FDAFood & Drug Administration |
Varies by analysis | Uses VSL for drug approval and food safety cost-benefit analyses | Drug and food safety regulations evaluated against mortality risk reductions. Higher VSL supports more aggressive approval standards for dangerous products. FDA typically follows OMB guidance (Circular A-4). | Follows OMB guidance |
US OSHAOccupational Safety |
~$8–12M range | Varies by rulemaking; has used multiple values | Workplace safety regulations evaluated against fatality prevention. OSHA’s VSL application was historically the origin of the concept: W. Kip Viscusi used VSL to resolve a dispute between OSHA and OMB in the Reagan administration — the first major federal VSL use. | Inconsistent history |
Sources: US DOT $14.2M (2025): transportation.gov (primary · directly fetched). US HHS/ASPE 2025 update: aspe.hhs.gov/sites/default/files/documents/Standard-RIA-Values-2025.pdf (primary · February 2025 · “increases VSL estimates in nominal terms by about 49% compared to 2013”). EPA zero controversy: Resources for the Future (RFF 2023) · New York Times (reported by RFF.org). OSHA VSL history: Michigan Journal of Economics (May 2025) · Wikipedia citing Viscusi. OMB Circular A-4: federal OMB regulatory guidance. Click column headers to sort.
What Is the Value of a Statistical Life — and Why Does It Exist at All?
Governments cannot avoid making decisions that involve tradeoffs between money and human lives. A traffic safety regulation costs $500 million to implement and will save approximately 50 lives per year. Should it be adopted? A food safety rule will cost the food industry $2 billion annually and will prevent approximately 30 deaths from contamination each year. Is that a good investment? Without some way to compare the costs of regulation against its benefits — including the benefit of prevented deaths — these decisions become purely political rather than being grounded in any systematic analysis.
The Value of a Statistical Life emerged as the answer to this problem. In the 1980s, economist W. Kip Viscusi used it to resolve a dispute between the US Occupational Safety and Health Administration and the Office of Management and Budget over workplace safety rules — the first major federal application. The concept was straightforward: rather than claiming to know what a life is worth in an absolute sense, researchers asked what people actually pay, in their own choices, to reduce mortality risks. Workers demand higher wages for more dangerous jobs. Consumers pay extra for safer cars. Homeowners accept lower prices for houses near hazardous facilities. These revealed preferences — what people actually do when faced with real risk-reward tradeoffs — can be aggregated to estimate how much a large population is collectively willing to pay for a given reduction in mortality risk.
The critical distinction is between the value of an identified life and the value of a statistical life. If a specific person is trapped in a mine, the willingness to pay for their rescue is effectively unlimited — no cost is too high to save a known individual. The VSL is not this. It is the aggregate willingness to pay for a small reduction in an anonymous risk shared across a large population. As the EPA explains it: if 100,000 people would each pay $100 to reduce their individual mortality risk by 1 in 100,000, that sums to $10 million for one statistical life saved. This number is then used to evaluate whether a regulation that costs $10 million and saves one statistical life per year represents a worthwhile investment. Nothing about this calculation determines the moral worth of any person.
Why Does the US Value a Life at $14 Million — and Is That Too High or Too Low?
The US Department of Transportation’s VSL of $14.2 million for 2025 analyses is the highest official government figure of any country in the world. It represents the output of the DOT’s 2013 comprehensive guidance methodology, updated annually for inflation and real income growth. The Transportation research base underlying it draws on wage-risk studies from the US labor market, where workers in dangerous occupations command a measurable premium for accepting higher mortality risk. These studies “reveal” preferences through actual economic behaviour rather than hypothetical surveys.
The variation between US agencies is substantial and consequential. The DOT uses $14.2 million. The EPA’s official figure (though effectively set to zero in recent rulemakings) was estimated at around $7.4 million when last updated in the late 1990s. HHS updated its VSL to 2024 base year in February 2025, reporting an increase of approximately 49% versus 2013. OSHA has used figures ranging from $8 to $12 million in different rulemakings. Resources for the Future (RFF) has documented the practical consequence: when the EPA set its VSL effectively to zero in certain Trump administration regulatory analyses, the benefit of preventing deaths from air pollution disappeared from the calculation entirely, making any environmental regulation unjustifiable on economic grounds. The New York Times headline — “Trump’s EPA Has Put a Value on Human Life: Zero Dollars” — captured the consequence without requiring any technical exposition.
The debate over whether the US VSL is too high or too low reflects genuine scientific uncertainty about income elasticity, age adjustments, and methodological choices. Some researchers argue the VSL should be lower for older populations (who have fewer remaining life-years at risk) and higher for cancer risks (which people particularly dread). Others argue the VSL should rise with income, meaning it should be higher in 2025 than in 2013 — which the DOT’s annual updating methodology already captures. The OECD’s 2025 meta-analysis explicitly addresses methodology for transferring VSL estimates across countries and over time, providing the most technically rigorous framework currently available. Its median US-specific estimate, derived from the meta-analysis rather than from DOT’s wage-study methodology, would likely fall between the DOT’s $14.2 million and the general OECD average of $7-8 million.
The enormous benefits figure was driven primarily by VSL: most of the benefit came from prevented premature deaths, each valued at millions of dollars. Without VSL, air quality improvements would have generated only measurable economic benefits (lower medical costs, improved agricultural yields), a fraction of the total. With VSL, the Clean Air Act turned out to be one of the most cost-effective government programmes in American history.
This is the double-edged nature of VSL. When applied correctly and consistently, it provides powerful justification for aggressive health and safety regulation. When it is suppressed — as when EPA zeroed it out in recent rulemakings — the same methodology that proved the Clean Air Act’s value makes any regulation appear to have no benefits worth accounting for. The number is neutral. The decision about whether to use it is not.
Sources: Wikipedia citing EPA retrospective study · Resources for the Future (RFF 2023) · Michigan Journal of Economics (May 2025).
Why Are Lives Worth Less in Poor Countries — According to Policy Models?
The OECD 2025 meta-analysis confirms what economists have long observed: the VSL rises with income. People in wealthier countries demand larger wage premiums for dangerous work, pay more for safety features, and express higher willingness-to-pay for risk reduction in surveys — partly because they have more disposable income to pay, and partly because their marginal utility of income is lower. This produces a finding that is deeply uncomfortable but methodologically sound: the same reduction in mortality risk — say, installing safety barriers on a highway — is worth approximately seven to eight times more in an OECD country than in a low- or middle-income country, based on what people in those countries would collectively pay for it.
The OECD 2025 report provides a transfer function: to estimate a country’s VSL, multiply the relevant OECD group estimate by the ratio of the country’s GDP per capita to the OECD group’s average GDP per capita, raised to an income elasticity of approximately 1.0 to 1.2. The W2Economics/World Bank study found VSL-to-income ratios of approximately 46 times GNI per capita in low-income countries, rising to 76–77 times in high-income countries. Applying this to a country with GNI per capita of $1,000 per year gives a VSL of approximately $46,000 — versus approximately $3.8 million in Australia or $7.7 million in an average OECD country, where per capita incomes are vastly higher.
The practical consequence is a vicious cycle. A road safety improvement in Bangladesh or Nigeria must clear a much lower cost-benefit hurdle than the same improvement in Germany or Japan. This means that by the internal logic of VSL-based policy analysis, low-income countries should invest less in safety regulations. They do. Workers in low-income countries face more dangerous conditions, partly because their employers and governments can justify less spending on hazard prevention. More workers die. The VSL framework describes this as economically rational. Critics — including the Michigan Journal of Economics analysis (May 2025) — describe it as a mechanism by which global economic inequality is literally written into calculations about who deserves protection from harm.
The Fund followed economic logic: it was designed to replace the economic value of a life to the family, which depends on earning potential. But the result — a CEO’s life effectively valued many times more than a janitor’s — provoked exactly the ethical debate that VSL always risks when its assumptions are made explicit. Feinberg later acknowledged the tension.
The VSL addresses this differently: it uses willingness-to-pay aggregated across populations, which produces one value for “a statistical life” rather than income-differentiated values. But the income effect is still present: the VSL itself is higher in wealthier countries precisely because their populations have more money to spend. The mechanism for valuing life differs. The conclusion — that richer people’s lives are protected more by policy — does not.
Sources: Michigan Journal of Economics (May 2025) · Feinberg 2005 · Wikipedia.
Should VSL Vary by Age, Cancer Risk, or Other Factors?
The VSL as commonly used is a single number applied uniformly to all prevented deaths — a 25-year-old and an 80-year-old count equally, a sudden accident and a slow cancer death count equally. Economists have long debated whether this is appropriate, and the OECD 2025 meta-analysis addresses several of these dimensions. The evidence on age adjustments is genuinely contested: some studies suggest people are willing to pay less for risk reductions as they age (because fewer life-years remain), while others find no clear age gradient in willingness-to-pay for small risk changes. The OECD’s current recommendation is to avoid routine age adjustments in part because of the ethical objection that doing so explicitly treats older lives as worth less.
The cancer-risk question has a clearer empirical answer. Research consistently finds that people are willing to pay a premium to avoid cancer risks specifically — what Cass Sunstein and others call a “cancer premium” in VSL. People fear cancer more than sudden death, and are willing to pay more to avoid it. This suggests EPA’s VSL for carcinogen regulations should be higher than for accident risks — a recommendation that the Science Advisory Board has raised with EPA but which has not been implemented.
The deepest challenge to standard VSL methodology is the question of who is excluded from the data. Wage-risk studies can only estimate VSL from workers — people in the paid labour force who have wages to offer as compensation for risk. Retirees, children, people outside the labour force, and people in informal or non-market economies are systematically excluded. Yet EPA’s air pollution regulations disproportionately benefit people over 65, who are most vulnerable to air quality effects. Using a VSL derived from workers aged 18–65 to evaluate regulations whose primary beneficiaries are over 65 produces a systematic undervaluation of those regulations’ benefits — one that RFF has explicitly flagged as a methodological problem requiring correction.
Scale: 277 studies, 4,000+ VSL estimates covering 1973–2023 — the largest VSL meta-analysis ever attempted. First to use both revealed preference (wage-risk) AND stated preference (survey) methodologies together.
Coverage: Includes studies from Latin America, Africa, Australia, and Asia — not just Europe and North America. This significantly improves the LMIC estimates, which were previously based on very limited primary data.
Key finding: Mean base VSL ranges from approximately $1 million in low/middle-income countries to $7.1–8.5 million for OECD/high-income countries. Higher than 2012 estimates even after inflation adjustment, reflecting newer and more rigorous methodologies.
Transfer guidance: Provides explicit methodology for adjusting VSL estimates across countries by GDP per capita ratio, and across time. Includes six country groupings for direct application.
New dimension: Addresses morbidity (non-fatal health impacts) alongside mortality, enabling more comprehensive cost-benefit analyses of health regulations.
Sources: OECD (primary · October 2025 · doi:10.1787/76ca89a2-en · directly fetched) · Policy Edge India (December 2025 analysis).
Is There an Alternative to Putting a Price on Life in Policy Decisions?
The critics of VSL tend to underestimate how much worse policy becomes without it. Before cost-benefit analysis using VSL became standard in the 1980s, regulatory decisions were made through political negotiation, industry pressure, and intuition. Regulations with enormous costs and tiny benefits survived because no systematic comparison was made. Regulations with modest costs and huge benefits were blocked by the same political process. VSL provides a principled basis for distinguishing between them. Cass Sunstein’s academic work on this point is clear: the question is not whether to value life but how to value it consistently, because inconsistent valuation is itself a form of injustice — producing wildly different implicit VSLs across different regulatory contexts with no principled basis for the variation.
The most frequently proposed alternative is the Quality-Adjusted Life Year (QALY), used by the UK’s National Institute for Health and Care Excellence (NICE) and other health technology assessment bodies. QALYs measure health outcomes in terms of years of life weighted by quality of life, with one QALY representing one year of perfect health. The UK NICE threshold is approximately £20,000–30,000 ($25,000–38,000) per QALY — meaning treatments or interventions costing more than this per QALY are generally not approved for NHS funding. This approach is widely used for comparing medical treatments but is less well-developed for environmental and safety regulations where the nature of the benefit is different.
The answer to “should we put a price on life?” is: we already do, and always have. Every government budget allocation that directs resources toward or away from health and safety is implicitly valuing lives. VSL makes that implicit valuation explicit and subject to scrutiny. The deeper question is how the VSL should be calculated, which populations it should reflect, and how the income-gradient problem — the systematic disadvantage of people in poorer countries and poorer demographics within countries — can be addressed in a framework that is both economically grounded and ethically defensible. The OECD 2025 meta-analysis represents the most sophisticated current attempt at that synthesis.
Road safety: A guardrail installation costing $1.4 million that prevents one fatality per decade has a benefit-cost ratio of exactly 1.0 using the US DOT VSL of $14.2M per life × 0.1 lives per year = $1.42M/year benefit. It passes. At a LMIC VSL of $1M, the same guardrail generates only $100,000/year in benefits and fails badly. It doesn’t get built.
Air pollution: A factory emission reduction costing $500M and preventing 50 premature deaths per year generates $710M in benefits at US DOT VSL ($14.2M × 50). Net positive. At $0 (EPA effective VSL in recent rulemakings), benefits = $0. Regulation rejected.
Drug approval: A medication reducing mortality risk by 1 in 1,000 in a patient population of 100,000 saves 100 statistical lives per year. At $14.2M VSL, that’s $1.42 billion in benefits annually. If the drug costs less than this to provide, it passes FDA cost-effectiveness review.
Workplace safety: OSHA requiring safety equipment costing $80,000 per worker-year to prevent one death per 500 worker-years has a benefit of $14.2M ÷ 500 = $28,400 per worker-year. Equipment costing less than $28,400 passes. More expensive equipment fails. The VSL literally determines which protection workers receive.
This is why the number matters. Not because it captures the value of human life in any moral sense. Because it determines, in thousands of regulatory decisions annually, which risks governments decide are worth preventing and which are not. Sources: EPA VSL methodology (epa.gov) · US DOT guidance (transportation.gov) · Michigan Journal of Economics (May 2025).
- OECD — “Mortality Risk Valuation in Policy Assessment: A Global Meta-Analysis of Value of Statistical Life Studies” (primary · directly fetched · October 2025 · doi:10.1787/76ca89a2-en · 277 studies · 4,000+ estimates · 1973–2023 · LMIC ~$1M · OECD $7.1–7.7M · EU $7.6–8.7M · high-income $7.1–8.5M · transfer methodology)
- US Department of Transportation — “Departmental Guidance on Valuation of a Statistical Life in Economic Analysis” (primary · directly fetched · 2025 · $14.2 million for 2025 base year · methodology from 2013 · annual updates for price and real income changes)
- US HHS ASPE — “HHS Standard Values for Regulatory Analysis, 2025” (primary · February 2025 · updated to 2024 base year · +49% vs 2013 in nominal terms · VSLY estimates · OMB Circular A-4)
- Australia OIA — “Value of Statistical Life” (primary · directly fetched · February 2026 update · A$5.87M VSL 2025 dollars · VSLY A$253,000 · wage price index adjusted · Abelson methodology)
- US EPA — “Mortality Risk Valuation” (primary · epa.gov · history of EPA VSL from 1984 · ~$4.6M 2001$ early estimate · 26-study meta-analysis basis · SAB EEAC engagement · white papers 2010 2016)
- Resources for the Future (RFF) — “Rethinking the Value of a Statistical Life” (September 2023 · EPA VSL not updated since 1997 · hedonic wage methodology critique · exclusion of 65+ population · “reexamination of VSL is imperative”)
- Michigan Journal of Economics — “The Price of Human Life: Can We Ethically Quantify Risk?” (May 2025 · DOT $13.7M 2024 · 9/11 Fund ethics · developing nations lower VSL lower safety regs · Bhutan GNH alternative · Hammitt & Robinson 2011)
- DevDiscourse — “How Much Is a Life Worth? New Model Aims to Shape Global Road Safety Policies” (W2Economics/World Bank · Traffic Injury Prevention journal · LMICs $22,000–$1.05M · HICs $1.23M–$4.82M · VSL ratios: LI 46× LMI 58× UMI 77× HI 76× · nonlinear income-VSL relationship)
- Wikipedia — “Value of a Statistical Life” (June 2026 · Sweden official €2.4M · mean €3.7M · Australia update · Canada $6.5M CAD · Clean Air Act $5.6–49.4T benefits vs $523B costs · Viscusi OSHA history · QALY comparison)
- Policy Edge — “OECD Updates Global Estimates for Valuing Life in Policy Decisions” (December 2025 · OECD 2025 meta-analysis summary · 4,000 estimates · six country groupings · transfer methodology · morbidity alongside mortality · India application example)












