Visualized: The Future of Food
The next decade of eating is not a lab-grown steak commercial. Official outlooks show more calories from animals in middle-income countries, production rising mainly through yields, a billion tonnes still thrown away, and hundreds of millions still hungry.
Most “future of food” pages sell a product. This one uses the public ledgers: the OECD-FAO Agricultural Outlook 2025–2034, FAO hunger and emissions accounts, the UNEP Food Waste Index 2024, and UN World Population Prospects 2024.
Those sources do not agree on a single story. They do agree on the shape of the next ten years: demand grows in middle-income Asia; animal-source foods take a larger calorie share there; yields do most of the production work; waste remains enormous; and ending hunger by 2030 is already off track.
More people. Not endless people.
UN DESA’s World Population Prospects 2024 starts from 8.2 billion people in 2024. The medium projection peaks near 10.3 billion in the mid-2080s, then eases to about 10.2 billion by 2100. That is a larger table, not an infinite one.
Hunger is falling slowly, not vanishing. FAO’s State of Food Security and Nutrition estimates 673 million people undernourished in 2024 (about 8.2% of the world), down from 2022. The same report still projects 512 million people facing hunger in 2030 — nearly 60% of them in Africa.
The next plate is more animal in the middle, still thin at the bottom
OECD-FAO projects global consumption of agricultural and fish commodities up about 13% by 2034. Almost all of that increase is in low- and middle-income countries. India and Southeast Asia account for 39% of global consumption growth, up from 32% in the previous decade. China’s share falls to 13%, from 32%.
Daily per capita calories from meat, dairy, fish and other animal products rise about 6% worldwide. In lower-middle-income countries the rise is about 24%. In low-income countries, animal-source intake is still projected at only 143 kcal a day in 2034 — below the 300 kcal in FAO’s Healthy Diet Basket.
Per capita, next decade
OECD-FAO Outlook 2025–2034. Meat, dairy, fish and other animal products.
Still below the healthy-diet line
FAO Healthy Diet Basket benchmark for these foods is 300 kcal a day.
Share of global consumption growth
Up from 32% last decade. China’s share drops to 13%.
Global production by 2034
OECD-FAO: meat, dairy and egg output rises 17%. Livestock inventories rise 7%. Direct agricultural GHG emissions rise about 6%.
Growth comes from yields, not a new continent of farmland
Global agricultural and fish production is projected to rise about 14% by 2034, mostly from productivity gains in middle-income countries. Cereal output grows about 1.1% a year. Yields supply most of that (0.9% a year). Harvested area expands only 0.14% a year — less than half the previous decade’s 0.33%.
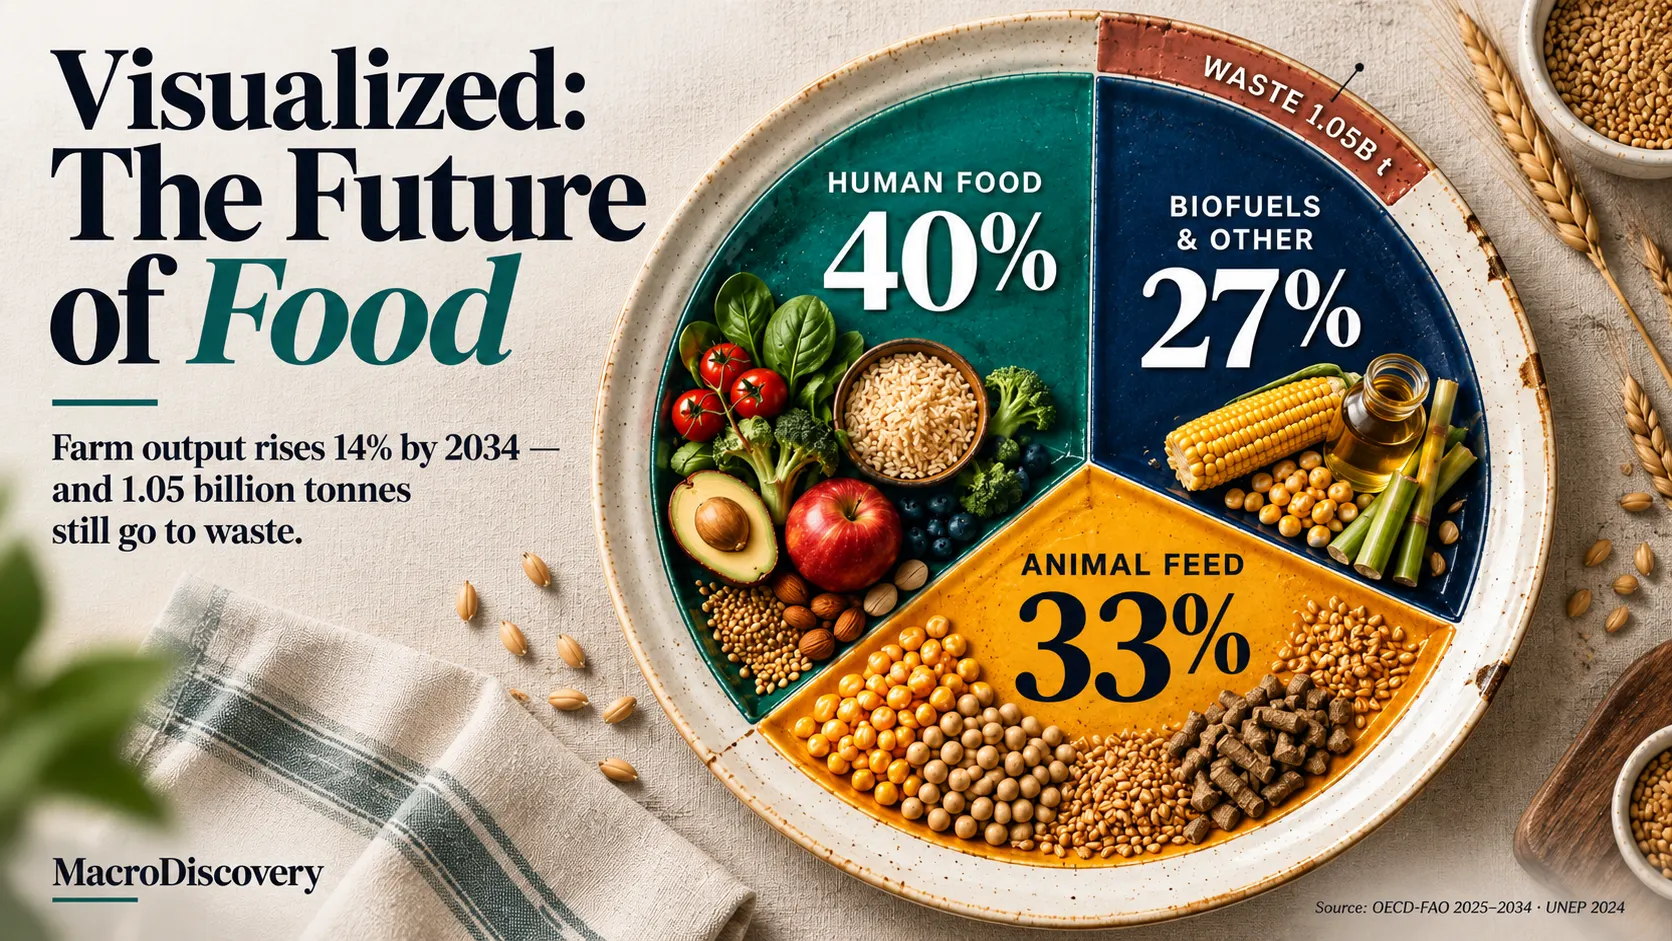
By 2034, OECD-FAO expects 40% of cereals to be eaten directly by people and 33% to go to animal feed. Biofuels and other industrial uses take the remaining 27%. Biofuel demand itself grows about 0.9% a year, led by Brazil, India and Indonesia.
- 01 Cereal production +1.1% per year
- 02 Yield +0.9% per year
- 03 Harvested area +0.14% per year
Bar widths are scaled to the 1.1% cereal-production rate as 100%. They compare annual growth rates only. They are not shares of output.
- 01 Human consumption 40% of cereals
- 02 Animal feed 33% of cereals
- 03 Biofuels and other uses 27% of cereals
Shares sum to 100%. This chart is not comparable to the annual-growth chart above.
A second food system, thrown away
UNEP’s Food Waste Index Report 2024 estimates 1.05 billion tonnes of food wasted in 2022 at household, food-service and retail stages — about 19% of food available to consumers. Households account for 631 million tonnes (79 kg per person). Food service: 290 million. Retail: 131 million. Average total: 132 kg per person.
UNEP’s own framing: household waste alone is more than one billion meals a day. That is a different problem from farm-gate loss. FAO separately estimates about 13% of food is lost after harvest and before retail.
UNEP measures consumer-facing waste. FAO’s Food Loss Index measures earlier supply-chain loss. IPCC-linked estimates put food loss and waste at roughly 8–10% of global greenhouse gases. Do not add UNEP tonnes to FAO percentages and call it one number.
Agrifood is a third of emissions — and a shrinking share of a growing total
FAOSTAT puts agrifood-system emissions at 16.5 billion tonnes of CO₂ equivalent in 2023, up 21% since 2001. The share of all human emissions fell from 38% to 32% over that period because the rest of the economy grew faster.
Farm-gate crop and livestock activity was about 8.1 Gt in 2023, or 49% of agrifood-system emissions. Separately, OECD-FAO projects that direct agricultural greenhouse-gas emissions increase by about 6% over the 2025–2034 outlook period, even as the carbon intensity of output falls. The outlook ties that rise to larger animal inventories and some extra cropland, not fully offset by productivity gains.
The official outlook is not “food runs out.” It is “enough calories grow, the wrong people still miss them, and a billion tonnes never get eaten.”Macro Discovery reading of OECD-FAO 2025–2034, SOFI, and UNEP Food Waste Index 2024
The future of food is a distribution problem wearing a technology costume
Lab meat, vertical farms and precision fermentation may matter later. They are not what the 2025–2034 official baseline is built on. That baseline is ordinary agriculture: higher yields, more animal-source foods in middle-income Asia, some extra cropland, and a projected 6% rise in direct agricultural greenhouse-gas emissions.
Two measured gaps sit side by side. Low-income diets stay short of FAO’s 300 kcal animal-source benchmark, at 143 kcal a day in 2034. After food has already been grown, UNEP counts 1.05 billion tonnes wasted in households, restaurants and shops. Those figures are not interchangeable. One is calories per person. The other is tonnes discarded. Together they show a system that both underfeeds and over-discards.
A population peak near 10.3 billion in the mid-2080s removes the oldest scare line — endless mouths — without solving the current one. FAO still projects 512 million people hungry in 2030. That is a policy result, not a physics result.
These conclusions are Macro Discovery’s interpretation of published FAO, OECD, UNEP and UN DESA figures. They are not statements by those agencies.What the data shows
Output can rise 14% without a land boom
OECD-FAO attributes most extra cereal output to yields (0.9% a year). Area growth slows to 0.14% a year. That is the official path. It still comes with larger herds and some extra cropland.
Waste is larger than the remaining hunger gap looks
UNEP: 1.05 billion tonnes wasted in 2022. FAO: 673 million undernourished in 2024. Those are different units — tonnes versus people — and must not be treated as a one-for-one swap. They do show a system that both underfeeds and over-discards.
What readers ask
How this analysis was produced
- Population: UN DESA World Population Prospects 2024 (8.2 billion in 2024; peak ~10.3 billion, mid-2080s).
- Markets and diets: OECD-FAO Agricultural Outlook 2025–2034 (production +14%, consumption +13%, animal-source calories +6% globally).
- Hunger: FAO State of Food Security and Nutrition figures for 2024 (673 million undernourished; 512 million projected in 2030).
- Waste: UNEP Food Waste Index Report 2024 (1.05 billion tonnes in 2022; household 631 Mt).
- Emissions: FAOSTAT Analytical Brief 115, agrifood systems 2001–2023 (16.5 Gt; 32% share).
- Bar widths: Chart A scales annual growth rates to cereal production (+1.1% = 100%). Chart B uses OECD-FAO cereal-use shares (40 / 33 / 27). Waste bars scale household 631 Mt to 100%. Display scales only; charts are not mixed across units.
- Meat, dairy and eggs: OECD-FAO official release states output “is set to increase by 17%.” That published figure is used here, not a separately computed 16.6%.
- Macro Discovery analysis: The dark box is editorial. It is not an FAO or OECD finding.