The Economics of National Parks
National parks generate $50 billion a year. Most of it goes to communities outside the park.
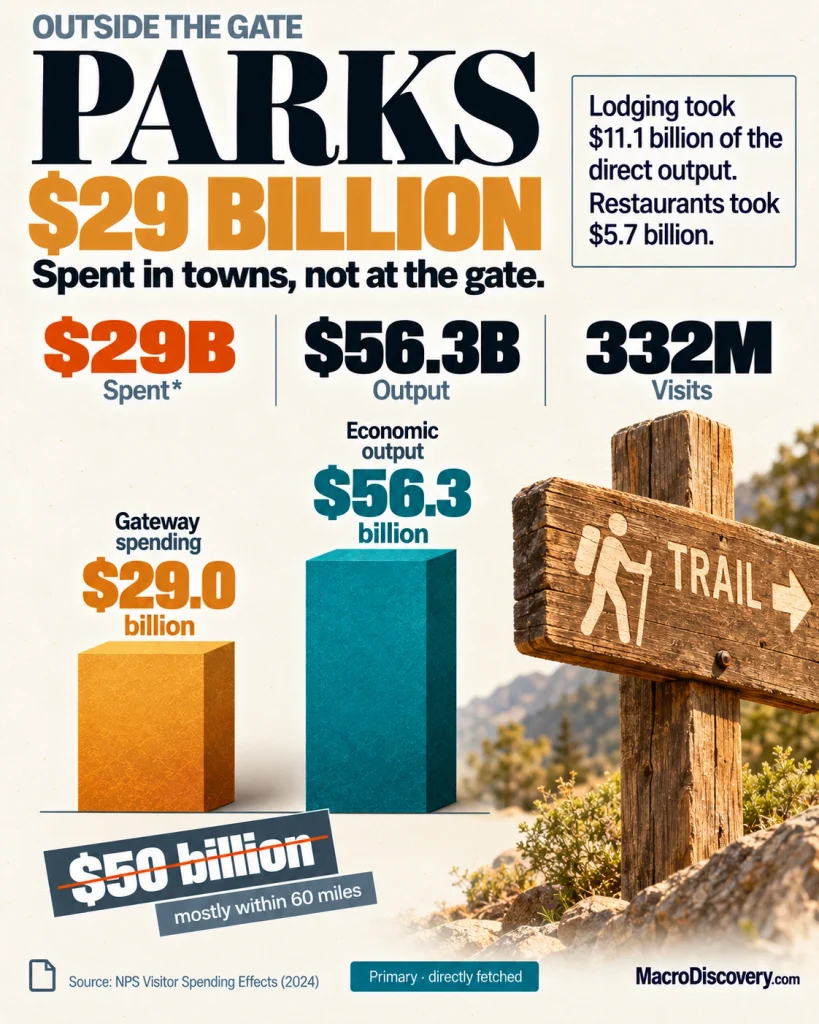
Visitors spent $29 billion in gateway communities in 2024. That supported $56.3 billion of output. The parks did not collect $50 billion.
Three numbers
- $29.0 billion — visitor spending in local gateway regions in 2024. Source: National Park Service.
- $56.3 billion — economic output supported by that spending. $18.8 billion in labor income. Source: NPS.
- 340,100 — jobs supported. 331.9 million recreation visits. Source: NPS.
What the data shows
A common claim is that national parks generate $50 billion a year, and that most of it goes to communities outside the park. The fact is that the parks do not collect $50 billion, and the spending is already measured outside. The 2024 National Park Visitor Spending Effects report recorded 331.9 million recreation visits, up 2% from 2023. Visitors spent an estimated $29.0 billion in local gateway regions, up 10%. That spending supported $56.3 billion in economic output, $18.8 billion in labor income, $33.7 billion in value added, and 340,100 jobs. The $50 billion line is a round number for the output, a year behind the $56.3 billion figure. It is not revenue on a Park Service ledger.
The outside is the definition. A gateway region is typically the counties within about 60 miles of the park boundary. The $29 billion is money spent in those communities on lodging, food, fuel, and recreation. It is not entrance fees. Lodging had the highest direct contribution, $11.1 billion of economic output. Restaurants were next, at $5.7 billion. About 43.7% of the $56.3 billion output was direct, about $24.6 billion. About 56.5% was secondary, about $31.8 billion, when employees and suppliers spent. Most of it goes outside because that is where the measure looks. A claim that the parks generate the money and then send it out has the direction reversed.
Output is not cash left in a town. $29 billion is what visitors spent. $56.3 billion is the modeled circulation of that spending through the economy. The jobs are real in the model: 340,100, the largest counts in California and North Carolina. Inflation-adjusted visitor spending in 2024 was the highest in more than a decade, ahead of $27.2 billion in 2023 and $25.7 billion in 2019. The parks draw the visits. The towns collect the spending. The $50 billion is a rounded output from an older cycle, not a cheque the Park Service writes to the gateways.
Lodging contributed $11.1 billion of direct output. Restaurants contributed $5.7 billion.
| Count | Figure | What it is |
|---|---|---|
| Visitor spending | $29.0 billion | In gateway regions. Not park fees |
| Economic output | $56.3 billion | Includes secondary effects |
| Jobs | 340,100 | Labor income $18.8 billion |
| Lodging direct | $11.1 billion | Largest sector |
| Visits | 331.9 million | Up 2% from 2023 |
How it was measured
The report counts recreation visits and estimates what those visitors spent in gateway regions, usually counties within about 60 miles. An economic model then turns that spending into jobs, labor income, value added, and output. Direct effects are the first round. Secondary effects are the later rounds. Output is not profit and not tax revenue.
Entrance fees and concession fees collected inside the parks are a different and smaller line. They are not in the $29 billion. A $50 billion headline that does not say whether it is spending or output has mixed the two.
What it means
It is settled that visitors spent $29 billion in gateway regions in 2024 and that this supported $56.3 billion of output and 340,100 jobs. It is not settled that the parks generated $50 billion as revenue. Use $29 billion for the spending. Use $56.3 billion for the output. Use 340,100 for the jobs. Do not treat the output as money the Park Service collected.
Common misreadings
- $50 billion is a round number for output. The 2024 figure is $56.3 billion.
- The $29 billion is already spending outside the park. It is not fees sent out.
- Output includes secondary effects. It is not cash left in the towns.
Where the numbers come from
How we built this
- Dataset: 2024 National Park Visitor Spending Effects report.
- Scope: Gateway spending kept apart from park fees. Output kept apart from spending. The $50 billion treated as a rounded older output.
- Figures: $29 billion is spending. $56.3 billion is output. 340,100 is jobs. Park revenue of $50 billion is treated as not this report.