Inflation vs. Wages
Prices rose 20% since 2020. Wages did not keep up. Here is who was left behind.
Prices rose about 26% from February 2020 to September 2025. Real pay fell in 2022, then recovered. The bottom gained more through 2024.
Three numbers
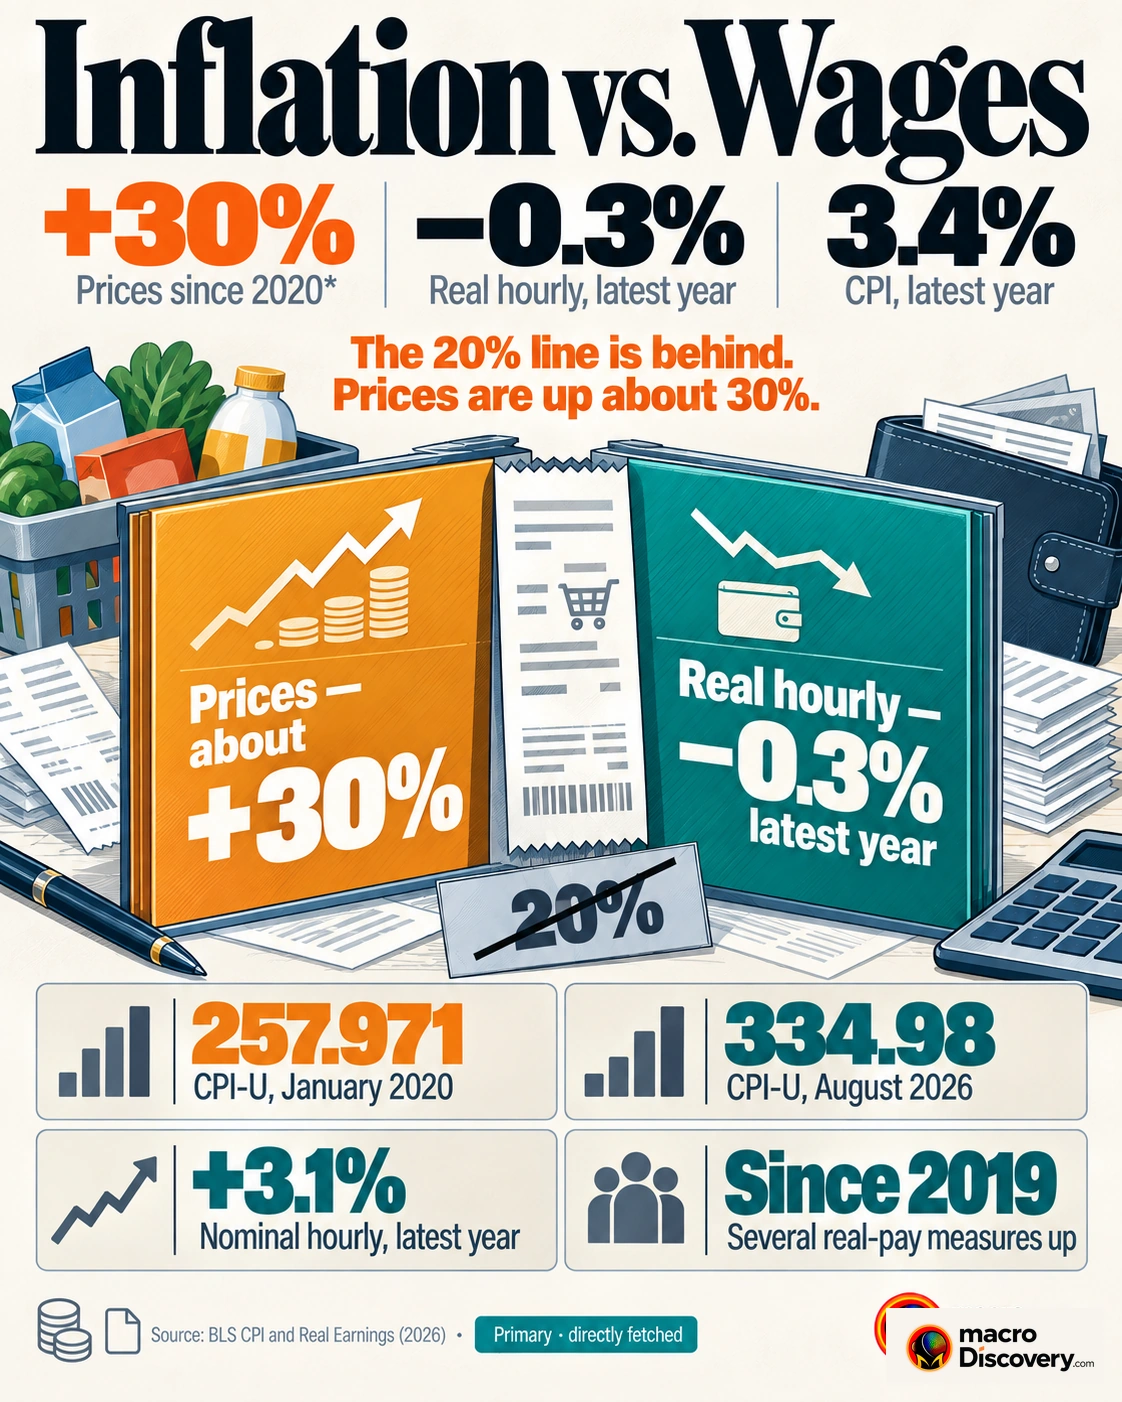
- About 26% — rise in the consumer price index from February 2020 to September 2025. Source: BLS CPI-U.
- 2.4% a year — real wage growth at the 10th percentile, 2019 to 2024. The median was 0.9%. Source: EPI.
- −0.3% — change in real average hourly earnings from August 2025 to August 2026. Source: BLS.
What the data shows
A common claim is that prices rose 20% since 2020, wages did not keep up, and a group was left behind. The fact is that prices rose more than 20%, and the wage gap was a year, not a permanent split. The CPI-U was 258.678 in February 2020, before the shutdowns, and 324.800 in September 2025. That is a rise of about 26%. The August 2026 index used in the Bureau of Labor Statistics real-earnings table was 334.131, about 29% above February 2020. Twenty percent is a low reading of the same index. It is not a second measure.
Wages failed to keep up in 2021 and 2022, when prices jumped and real hourly earnings fell. They did not stay behind. Real average hourly earnings, which deflate pay by the same CPI, recovered the drop over the next two years. From August 2025 to August 2026 they were down 0.3%. Nominal pay in that month was $37.75 an hour. A flat latest year is not the same finding as a gap that never closed. Comparing a nominal wage to a price rise without deflating it is how the claim stays open after the series has caught up.
The bottom was not the group left behind, through 2024. Economic Policy Institute figures put annualized real wage growth from 2019 to 2024 at 2.4% for the 10th percentile, 1.8% for the 20th, and 0.9% at the median. The low end gained more than the middle. In 2025 that gain stalled: about minus 0.3% at the 10th percentile, and still positive through the middle. The people who lost ground were workers who met the 2022 price spike before a raise. That is a timing gap. It is not a class the later data still names.
A price bar is not a pay bar. Real earnings deflate one by the other.
| Count | Figure | What it is |
|---|---|---|
| CPI, Feb 2020 to Sep 2025 | about 26% | 258.678 to 324.800 |
| CPI to Aug 2026 table | about 29% | Index 334.131 |
| Real wage, 10th, 2019–24 | 2.4% a year | Faster than the median |
| Real wage, median, 2019–24 | 0.9% a year | EPI |
| Real hourly, latest year | −0.3% | Aug 2025 to Aug 2026 |
How it was measured
The CPI-U is a price basket for urban consumers. It is not a cost of living for every household. Rent, food, and gasoline have different weights. February 2020 is the last month before the shutdowns. Starting in December 2020 trims the rise. The 20% line does not name its months.
Real average hourly earnings divide private-sector pay by that index. They miss the self-employed and benefits. The EPI percentiles use a different survey, the Current Population Survey, and a different inflation adjustment. A 2.4% annual gain at the 10th percentile is not the same series as the −0.3% latest year in the establishment survey. They should not be added.
What it means
It is settled that prices rose about 26% from February 2020 to September 2025, that real hourly pay fell and then recovered, and that the bottom tenth gained more than the median through 2024. It is not settled that wages never caught up, or that one group was left behind. Use 26% for the price rise. Use 2.4% for the low-end gain. Use −0.3% for the latest year. Do not use 20% as the price rise, or “did not keep up” as the current gap.
Common misreadings
- Twenty percent is low. The index rose about 26% from February 2020 to September 2025.
- A 2022 drop in real pay is not a gap that is still open.
- Through 2024 the bottom tenth gained faster than the middle. “Left behind” names the wrong end.
Where the numbers come from
How we built this
- Dataset: BLS CPI-U from February 2020; BLS real earnings for August 2026; EPI wage deciles for 2019–2024 and 2025.
- Scope: Prices and real pay kept separate. No claim that a named class is still behind after the recovery.
- Figures: 26% is the price rise to September 2025. 2.4% is the low-end real gain. −0.3% is the latest year. 20% is treated as a low reading.