The Global Rice Economy
Rice feeds half the world. Here is the geography and economics behind the world’s most important crop.
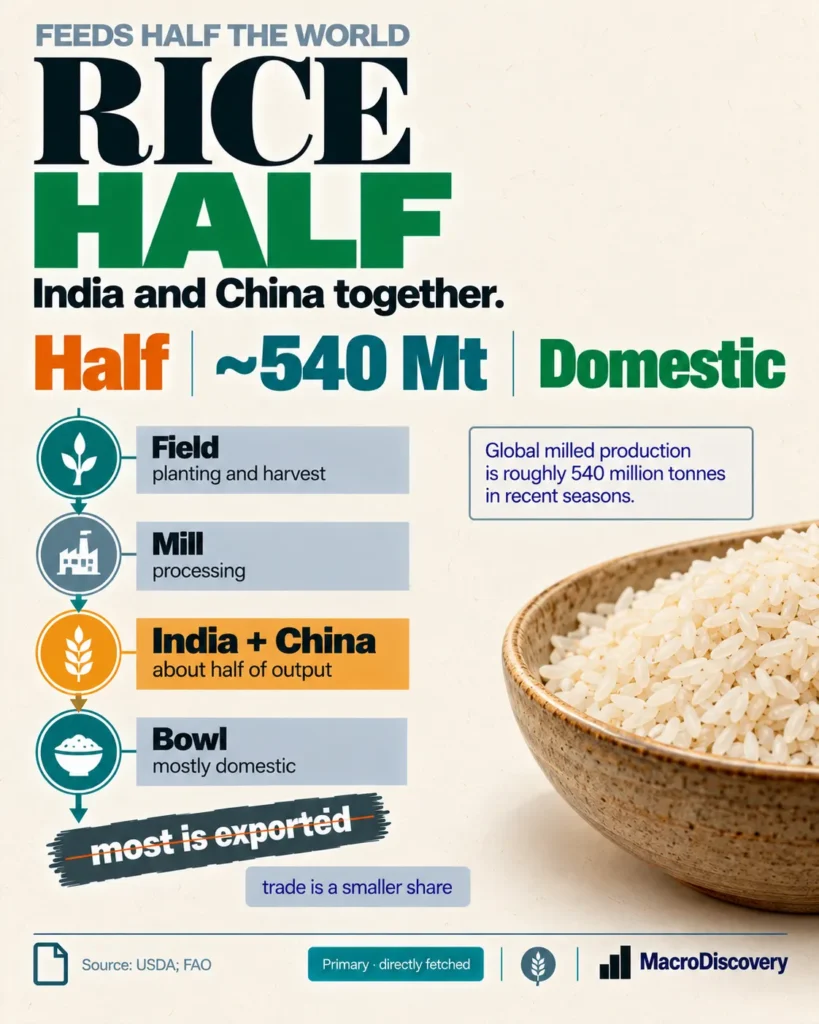
Global milled rice production is around 540–556 million tonnes. India and China are the largest producers. Rice is a staple for more than half the world’s population and supplies roughly one-fifth of global calories. Asia dominates both output and consumption.
Three numbers
- ~540–556 million tonnes — recent global milled rice production. FAO Food Outlook places 2025/26 near 556 million tonnes; USDA figures are in the low-to-mid 540s. Source: FAO and USDA.
- India and China — the two largest producers. India has been the largest in recent seasons, with China close behind. Together they dominate global output. Source: USDA Production, Supply and Distribution; FAO.
- More than half the world’s population — rice is the staple food for over 50 percent of people, mainly in Asia, and supplies roughly 20 percent of global calories. Source: FAO and IRRI-related assessments.
What the data shows
A common claim is that rice is one crop among many. The fact is that it is the primary staple for more than half the world’s population and a central pillar of global food security. FAO and USDA data show recent global milled rice production in the range of about 540 to 556 million tonnes, with successive seasons at or near record levels. Asia accounts for the overwhelming majority of both production and consumption. India and China are the two largest producers. In recent USDA figures India has held the top position, with milled output around 150 million tonnes, while China is near 145–146 million tonnes. Bangladesh, Indonesia, Vietnam and Thailand follow. Most of the harvest is consumed in the country of production; only a fraction enters international trade.
Per capita food use of rice is highest in Asia. FAO places world average food consumption near 53 kilograms per person per year. In several Asian countries the figure is far higher and rice supplies the majority of dietary energy. Globally, rice contributes roughly one-fifth of caloric intake. The geography is therefore concentrated: a handful of Asian countries grow most of the world’s rice and feed the majority of people who depend on it. Trade volumes are smaller than production — typically around 60 million tonnes of milled rice in recent years — but India has become the largest exporter, with Vietnam, Thailand and Pakistan also important. Stocks remain substantial, providing a buffer against short-term shocks.
The economics follow the geography. Because production and consumption are both heavily Asian, domestic policies, weather and input costs in India and China have outsized effects on global availability and prices. Export restrictions or large stock releases from India move world prices. Climate and water constraints are long-term risks because rice is water-intensive and much of it is grown in flood-prone or monsoon-dependent systems. The measured data show a crop that feeds more than half the world, is produced at a scale of roughly 550 million tonnes milled, and is dominated by two countries. The flow is from Asian fields to Asian plates, with a smaller but critical traded surplus.
| Element | Scale |
|---|---|
| Global milled production | ~540–556 million tonnes |
| Top producers | India and China |
| Population relying on rice as staple | More than half the world |
| Share of global calories | Roughly 20 percent |
| Typical trade volume | ~60 million tonnes milled |
Production and trade ranges from FAO Food Outlook and USDA PSD. Staple population and calorie share from FAO and established IRRI-related assessments. Per capita food use from FAO.
How it was measured
Production and trade figures come from FAO Food Outlook and the USDA Production, Supply and Distribution database, both based on official national statistics and field reporting. The “more than half the world” staple claim and the approximate 20 percent calorie share are long-standing assessments from FAO and rice research institutions. The claim that rice is a minor crop is contradicted by these production volumes and the population that depends on it.
What it means
It is settled that global milled rice production is in the mid-500-million-tonne range in recent seasons. It is settled that India and China are the two largest producers. It is settled that rice is the staple for more than half the world’s population and a major source of calories. It is not settled that production will continue to rise at the same pace — weather, water and policy introduce variability. Use the FAO and USDA ranges as the measured scale. Do not treat rice as interchangeable with other cereals in its role as a daily staple.
Common misreadings
- Rice is not a minor grain. It is the staple for more than half the world’s population.
- Most rice is consumed where it is grown. Trade is a smaller fraction of total production.
- India and China dominate output; shifts in either country affect global availability.
Where the numbers come from
How we built this
- Dataset: FAO Food Outlook rice balances. USDA PSD production, consumption and trade. Staple and calorie assessments from FAO and IRRI-related sources.
- Scope: Global milled production. Geographic concentration in Asia. Role as staple and calorie source. Trade versus domestic use.
- Figures: ~540–556 million tonnes. India + China. More than half the world’s population.