The Deep Ocean Economy
80% of Earth’s oceans have never been mapped. Here is what we know is down there.
The latest direct map covers 28.7% of the ocean floor. The 80% line is an older gap, and the rest is estimated, not blank.
Three numbers
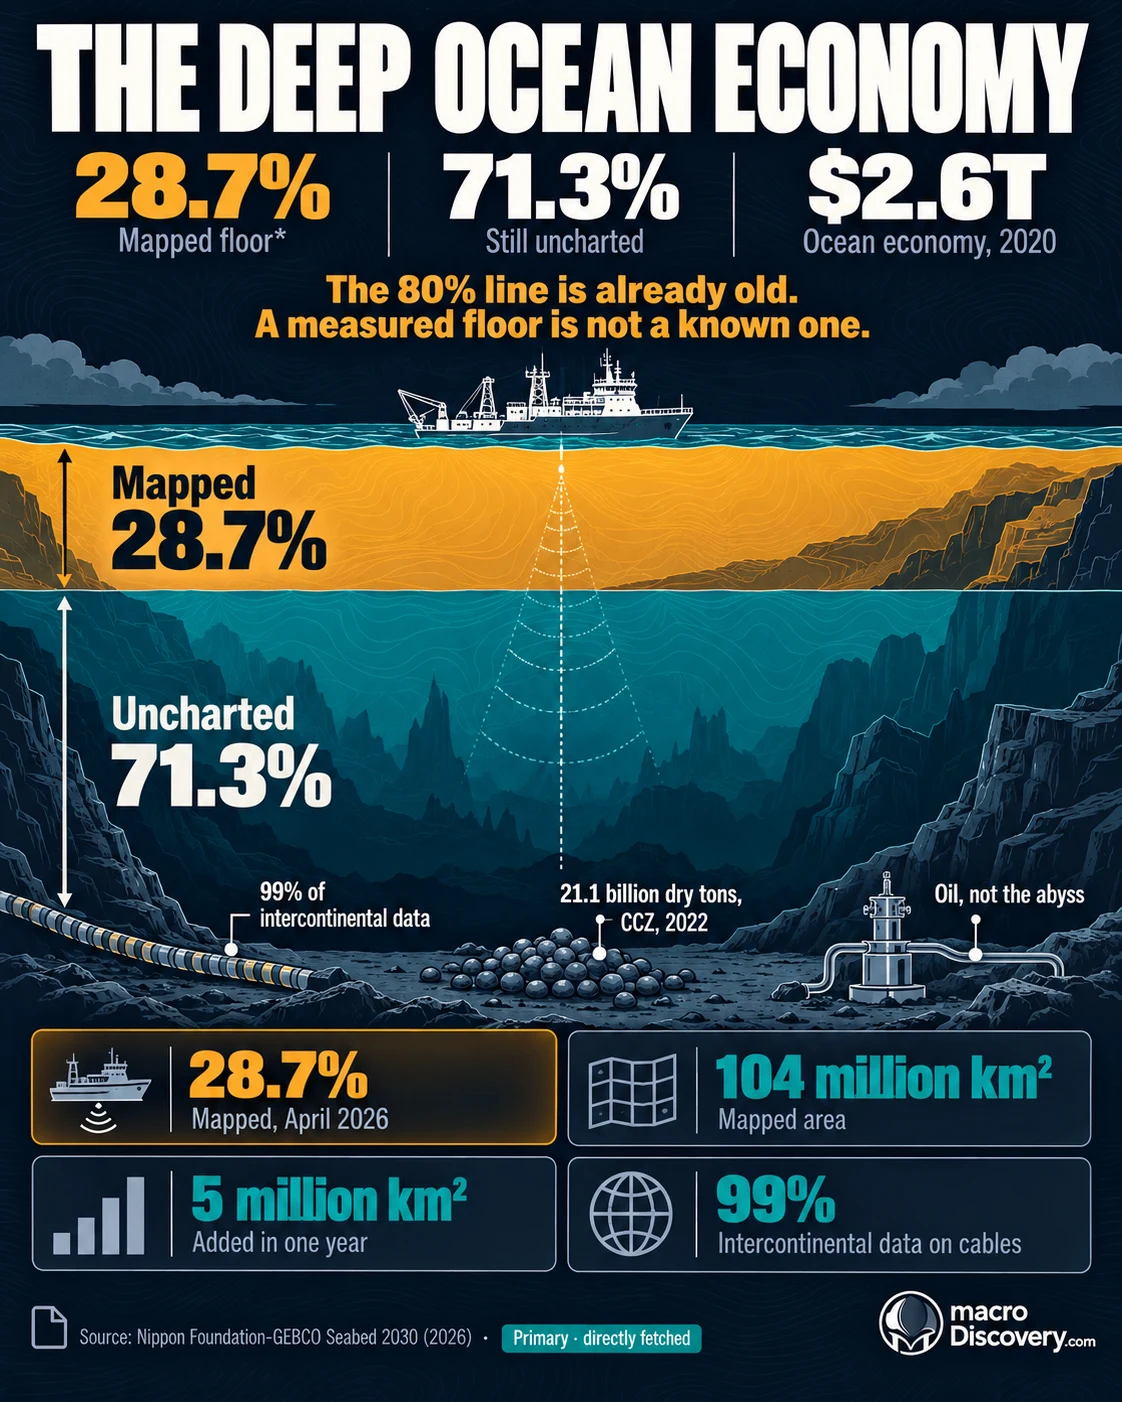
- 28.7% — share of the ocean floor mapped to modern standards by April 2026. About 71% is not directly mapped. Source: Seabed 2030.
- 104 million km² — mapped area in that update, more than two-thirds of Earth’s land surface. Source: Seabed 2030.
- $476 billion — US marine-economy contribution to GDP in 2022. Tourism and defense lead. It is not a deep-sea mining total. Source: NOAA and BEA.
What the data shows
A common claim is that 80% of Earth’s oceans have never been mapped. The fact is that the gap is smaller, and it is a direct-survey gap, not a blank map. The Nippon Foundation-GEBCO Seabed 2030 project said 26.1% of the ocean floor was mapped to modern standards in June 2024, 27.3% in July 2025, and 28.7% by April 2026. The 2026 map covers about 104 million square kilometres. About 71% is still not directly mapped. The 80% line matched an older gap, when the mapped share was near 20%. In 2017, when the project started, the share was about 6%.
The unmapped share is not empty. Satellites estimate the shape of the rest from the sea surface. A ridge pulls water and raises the local sea level. That picture is coarse. Direct surveys have still found seamounts as tall as mountains in zones the satellite map smoothed over. Coverage is uneven. A 2025 review put the Indian Ocean near 17.5% mapped, and the North Atlantic and North Pacific above one-third. Some further area may already be surveyed and not shared.
What is counted as an ocean economy is mostly coastal, not the deep floor. NOAA and the Bureau of Economic Analysis put the US marine economy at $476 billion of GDP in 2022, about 2% of the economy, with $777 billion in sales and 2.4 million jobs. Tourism and recreation were $163 billion. National defense was $149 billion. Offshore minerals were $62 billion. On the deep floor, the International Seabed Authority has exploration contracts for polymetallic nodules, sulphides, and crusts. Commercial mining has not opened. Cables on the seabed carry most intercontinental data. They are a known use of a floor that is still mostly unsurveyed in detail.
Modern standards means a direct depth survey in the GEBCO grid. Satellite estimates of the rest are not in this share.
| Count | Figure | What it is |
|---|---|---|
| Mapped, April 2026 | 28.7% | Direct survey. About 104 million km² |
| Not directly mapped | about 71% | Estimated from satellites, not blank |
| Mapped, June 2024 | 26.1% | Prior Seabed 2030 update |
| Mapped at project start, 2017 | about 6% | Why the 80% line stuck |
| US marine economy, 2022 | $476 billion | GDP. Mostly coastal, not deep mining |
How it was measured
Seabed 2030 compiles direct depth measurements into the GEBCO grid. A cell counts as mapped when a survey has measured it, not when a satellite has guessed it. The April 2026 update added about five million square kilometres in a year. The project’s aim is a full map by 2030. The remaining cost has been put as high as $5 billion, less if uncrewed ships do more of the work.
The NOAA marine-economy account is a satellite account with the Bureau of Economic Analysis. It covers tourism, defense, offshore minerals, transport, living resources, and shipbuilding in the US. It is not a world deep-ocean GDP, and offshore minerals in that account are mostly oil and gas, not nodule mining.
What it means
It is settled that 28.7% of the floor is now directly mapped, and that the US marine economy was $476 billion in 2022. It is not settled that 80% has never been mapped, or that the unmapped share is unknown in every sense. Use 28.7% for the direct map. Use about 71% for the area still estimated. Use $476 billion only for the US marine economy. Do not use 80% as the current gap.
Common misreadings
- This gap is not 80% anymore. The April 2026 direct share is 28.7%.
- Unmapped does not mean blank. Satellites estimate the shape. They miss detail.
- The $476 billion is a US coastal and marine total. It is not deep-sea mining revenue.
Where the numbers come from
How we built this
- Dataset: Seabed 2030 / GEBCO updates for 2024, 2025, and April 2026; NOAA-BEA marine economy for 2022.
- Scope: Direct seabed mapping, not sea-surface area. The US marine economy is shown as the counted ocean economy, not a deep-mining total.
- Figures: 28.7% is the April 2026 direct share. About 71% is the remainder. The 80% line is treated as an older gap.