
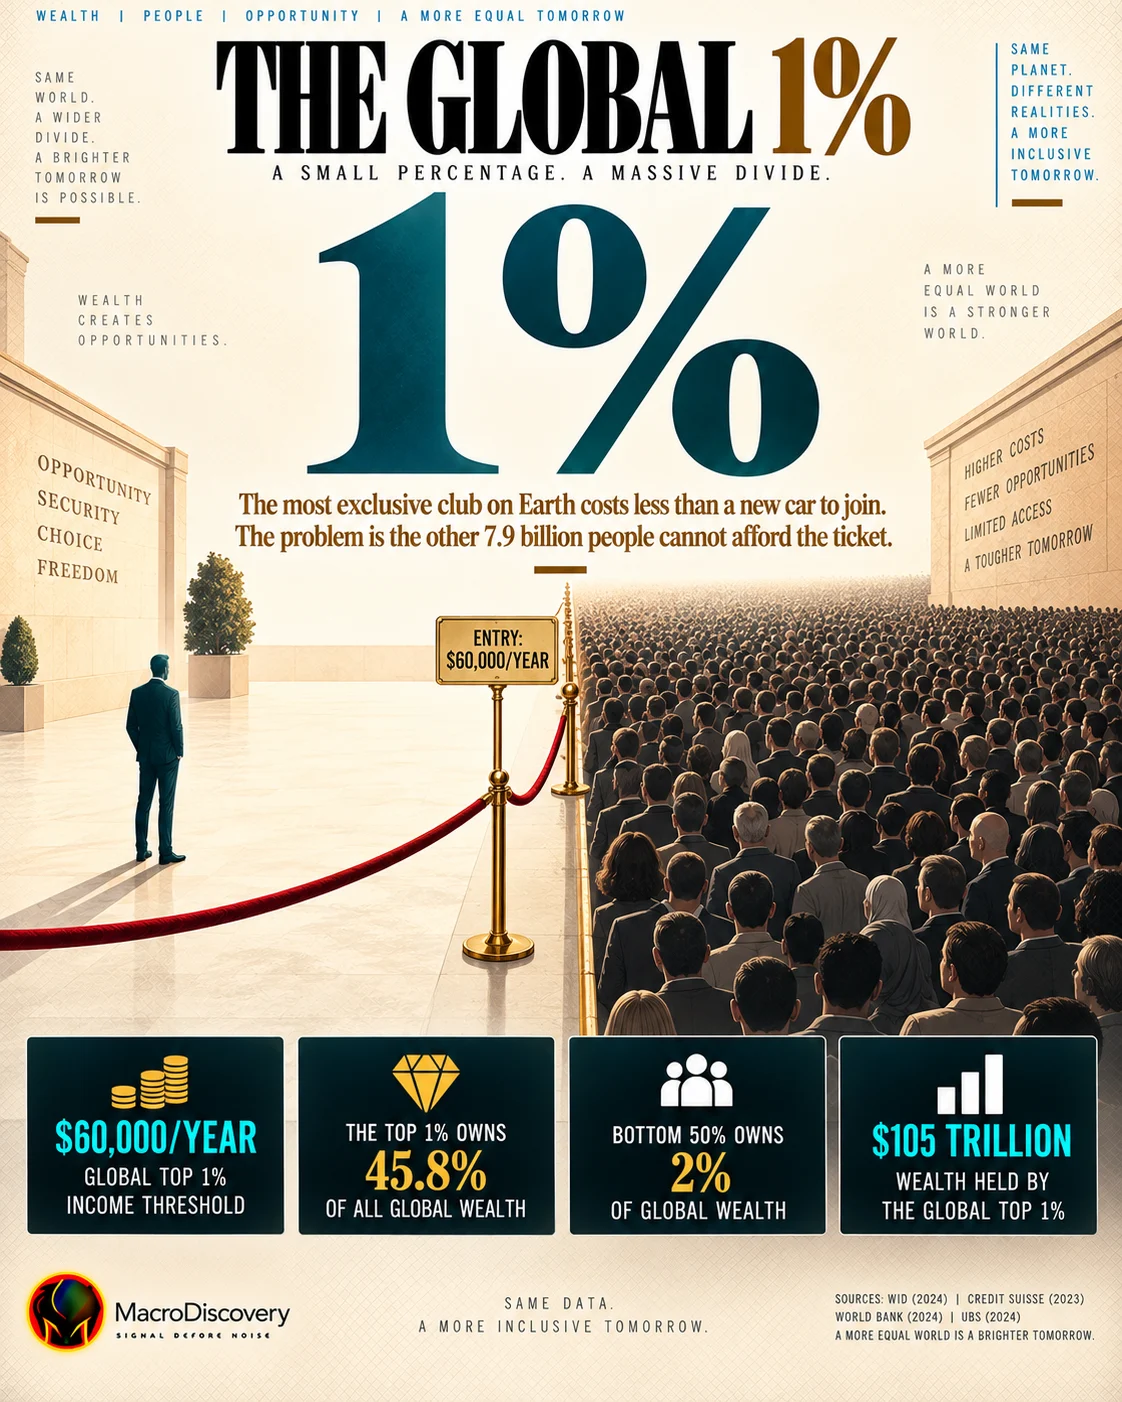
How the World’s Richest 1% Live
You do not enter the global top 1% on $60,000 a year. On the World Inequality Report’s 2025 adult-income map, that door is about €250,000. $60,000 is the neighborhood of the top 10%.
Fifty-six million adults. More income than the entire bottom half of humanity. Most of them live in North America, Oceania and Europe. The yacht is a different percentile.
The $60,000 line is a traveler. It shows up in calculators and LinkedIn posts as the ticket into the global elite. On the World Inequality Report 2026 map of adult incomes in 2025, it is the wrong door. To join the top 1% you need about €250,300 a year. To join the top 10% you need about €65,500. Sixty thousand dollars sits near that second threshold, not the first — and only if you ignore that WID speaks in its own PPP-euro adult unit, not a U.S. W-2.
The top 1% is about 56 million adults, roughly the adult population of the United Kingdom. The report’s punchline is not the lifestyle spread. It is the pile: that group earns more than two and a half times what the entire bottom 50% — some 2.8 billion adults — takes home together. Average income in the bottom half is about €5,100 a year. Average in the top 10% is about €159,300.
$60,000 is a different club
- —Bottom 50% average€5.1k
- —Top 10% door€65.5k
- —$60,000 postcard~$60k
- —Top 1% door€250k
Do not convert these casually into a U.S. salary and call it the same person. WID combines surveys, tax data and national accounts for adults. A household W-2 in Texas is a different object.
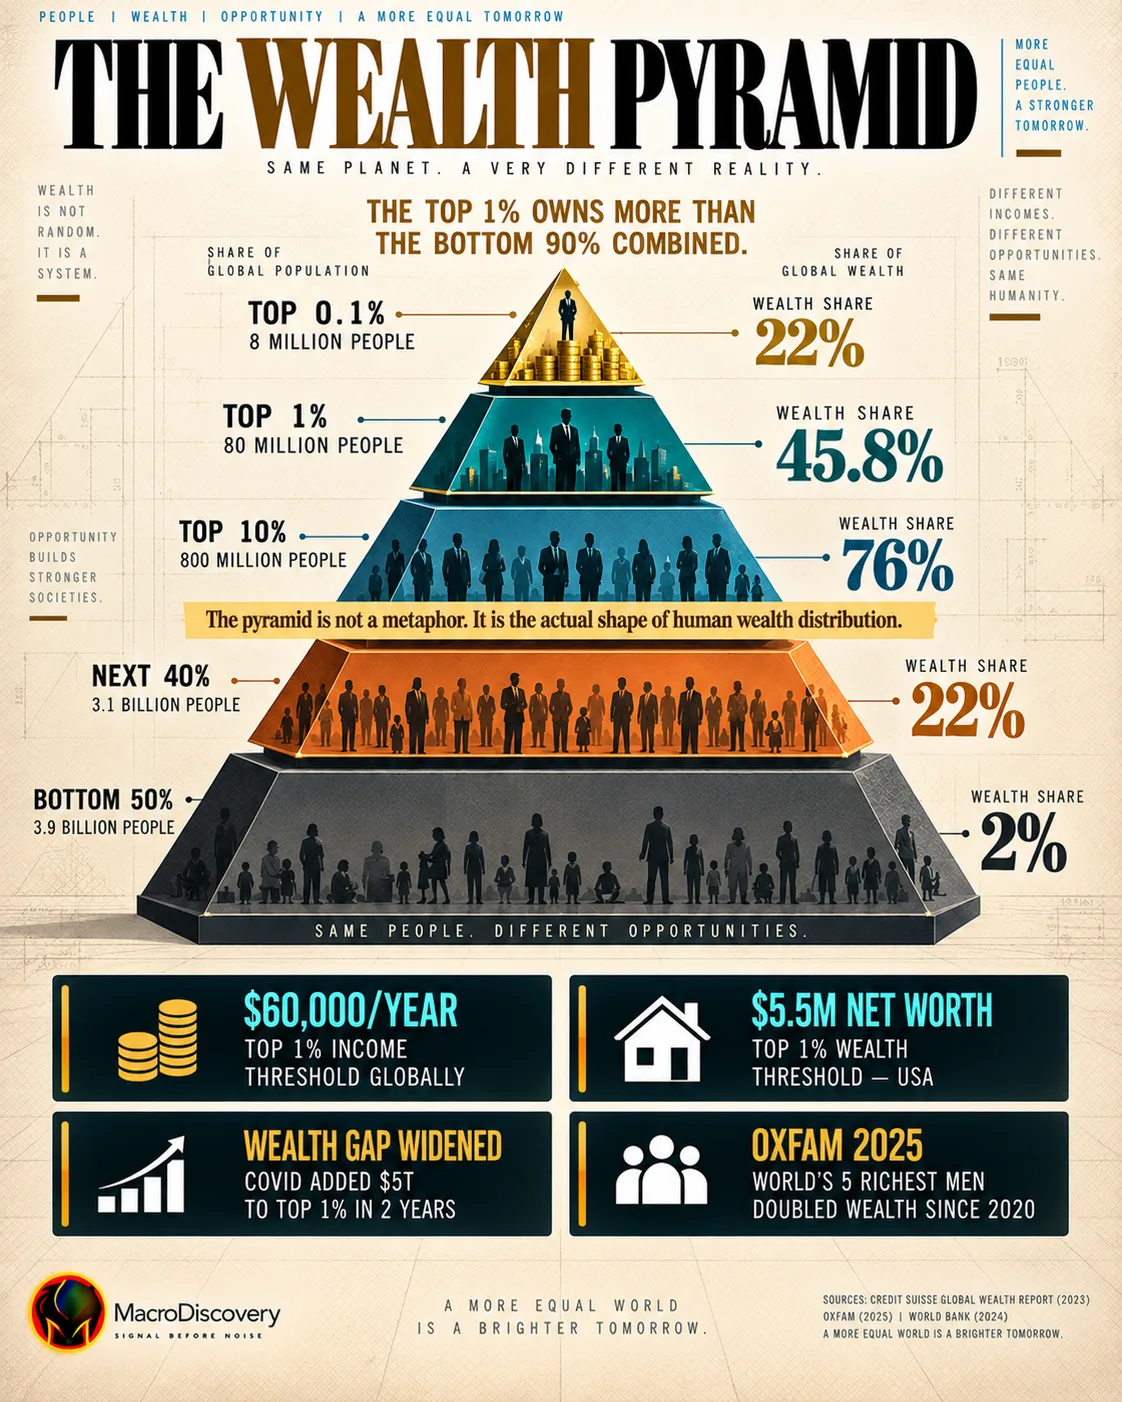
The 1% is still a North Atlantic club
WIR 2026 is blunt about geography. North America and Oceania still dominate the global top 1%. Europe keeps a large share. Other regions have gained some ground since 1980. Latin America’s slice of the elite shrank. “How the richest 1% live” is, for most of that 56 million, a rich-country professional life — not a superyacht. The yacht is the top 0.01% and the wealth distribution, which is a separate map.
WIR 2026 · 2025
About €21,900 a month. Not $5,000 a month.
Where $60k actually sits
556 million adults. Comfortable globally. Not the 1%.
≈ UK adult population
They earn >2.5× the bottom 2.8 billion combined.
Income map only
Global wealth-1% is a million-plus net-worth club. Different door.
$60,000 makes you globally comfortable. €250,000 makes you the 1% on this ledger. A yacht is a third conversation.Macro Discovery reading of World Inequality Report 2026, Figure 1.4
The $60,000 meme flattened three maps into one.
Older World Bank-style percentile posts used a lower, often PPP-dollar, sometimes per-capita threshold and called it the 1%. Giving-What-We-Can era charts did the same useful shock: a Western teacher is rich by Nairobi. That shock is still true at the top 10%. It is not true, on WIR 2026, at the top 1%. Mixing them lets a $60,000 household in Ohio think it shares a class with a $2 million pre-tax adult in the same database. It does not.
“How they live” follows from that. Most of the 56 million are high earners in rich countries — housing, private school, two cars — not the people on the cover of a billionaire magazine. If you want the cover, switch to wealth, or to the top 0.1%. This article stays on the income door the report actually printed.
Editorial reading of WIR 2026 thresholds. The World Inequality Lab did not write this box. Units are the report’s adult-income euros.If you remember two things
Top 1% door ≈ €250,000. Not $60,000.
$60,000 lives near the top 10% door (€65,500). Different club.
A UK-sized adult population out-earns 2.8 billion people
That is the report’s inequality sentence. Lifestyle photography is optional.
Short answers
One report. Two thresholds. One retired meme.
- Primary: World Inequality Report 2026 — 2025 adult incomes. Top 1% threshold ≈ €250,300; top 10% ≈ €65,500; bottom 50% average ≈ €5,100; top 10% average ≈ €159,300; top 1% ≈ 56 million adults; that group earns >2.5× the bottom 50% combined.
- $60,000: treated as a popular older threshold that matches the report’s top 10% neighborhood, not the top 1%.
- Not used as the same unit: U.S. household AGI, Forbes wealth, market-FX salaries without the report’s PPP-adult frame.












