Home AI Technology Gaming Future Automobile Geography Top 10 Trending How To Discover
---Advertisement---

Visualized: The Economics of Longevity

Macro Discovery
On: August 14, 2026 7:49 AM
Follow Us:
---Advertisement---
Economics of Longevity , Which country has the highest life expectancy in the world? , What is the economic impact of an aging population? , Which country is aging the fastest? , What is the longevity economy? , Why does the US spend more on healthcare but have a lower life expectancy than Japan? , economics of longevity aging population life expectancy statistics 2025 2026 , aging population economic impact fiscal pressure OECD pension healthcare cost statistics , life expectancy by country 2025 ranking Japan US Korea Spain highest WHO UN primary data comparison , longevity economy market size healthcare aging spending 2025 2034 growth investment opportunity , hat country has the highest life expectancy in the world 2025 2026 , what is the economic impact of an aging population on government spending pensions healthcare 2060 , which country is aging the fastest dependency ratio Korea Japan 2060 , what is the longevity economy and how big is it 2025 2034 market size , why does the US spend more on healthcare but have lower life expectancy than Japan Spain ,
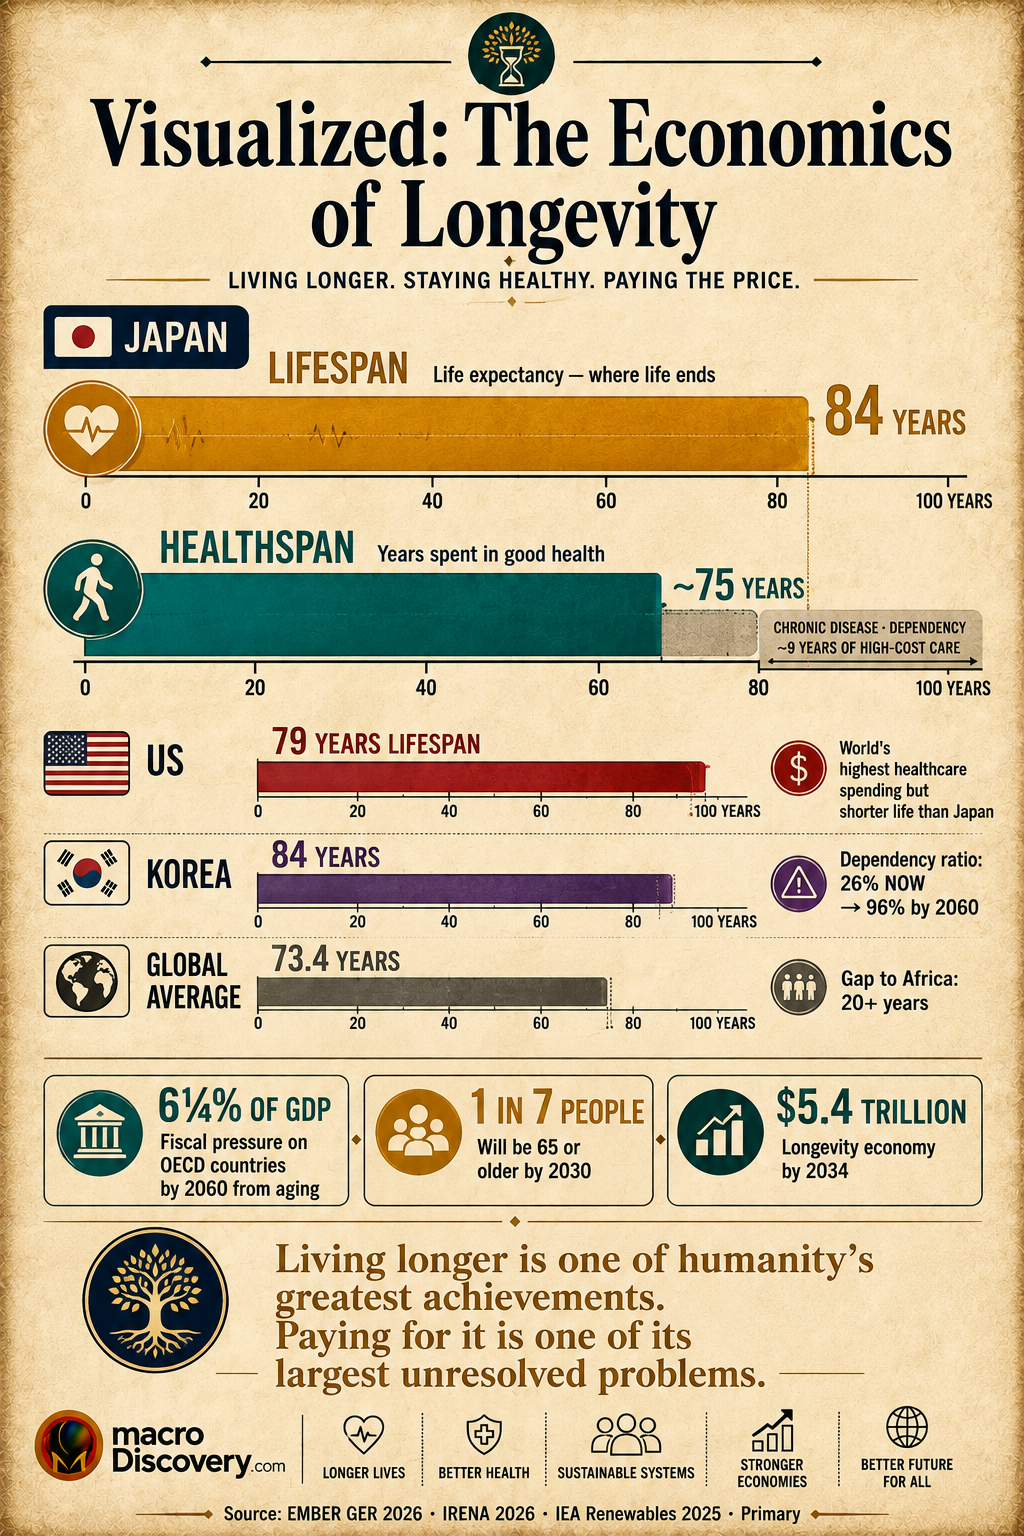
Premium editorial infographic showing
the lifespan-versus-healthspan gap
using Japan as the lead example. Two
horizontal bars are stacked vertically:
the top bar (amber gold) shows Japan's
full life expectancy of 84 years; the
bottom bar (teal) shows healthy life
expectancy stopping approximately at
age 75, with a grey zone labelled
"chronic disease and dependency —
approximately 9 years of high-cost
care." Below, three country comparison
rows show the US at 79 years (with a
red marker noting the world's highest
healthcare spending yet shorter life
than Japan), South Korea at 84 years
with a violet alarm noting its
dependency ratio will rise from 26%
now to 96% by 2060, and the global
average at 73.4 years with a note
on the 20-year gap to sub-Saharan
Africa. Three bold callouts note:
6¼% of GDP fiscal pressure on OECD
countries by 2060, 1 in 7 people will
be 65+ by 2030, and the longevity
economy reaching $5.4 trillion by 2034.
Based on OECD Working Paper No. 1844
(November 2025) and UN WPP 2024. Economics of Longevity.
Economics of Longevity
Visualized: The Economics of Longevity — MacroDiscovery
MacroDiscovery
Demographics & Longevity · 5 min read · OECD Nov 2025 · UN WPP 2024 · Primary
OECD Ecoscope — “The Fiscal Impact of Population Ageing” (PRIMARY · oecdecoscope.blog · directly fetched · November 7, 2025 · Koutsogeorgopoulou & Morgavi · OECD Working Paper No. 1844) · OECD Health at a Glance 2025 (PRIMARY · November 13, 2025) · OECD “Economic Benefit of Healthy Ageing” 2025 · UN World Population Prospects 2024 (PRIMARY)
Demographics · Fiscal Policy · Longevity

Visualized: The Economics
of Longevity

We are living longer. That is one of humanity’s greatest achievements. It is also one of its largest unresolved financial problems. By 2030, one in seven people on Earth will be 65 or older. OECD governments face fiscal pressure equivalent to 6¼ percentage points of GDP by 2060 — just from aging. South Korea’s old-age dependency ratio will nearly quadruple. Half of people over 75 are already on five or more medications. The economics of longevity, visualized.

By MacroDiscovery
Source: OECD Working Paper No. 1844 (primary · Nov 2025) · OECD Health at a Glance 2025 · UN WPP 2024
Coverage: OECD countries · emerging economies · 204 countries (UN)
6¼%
of GDP: fiscal pressure increase in average OECD country 2024-2060 · aging >40% of cause · OECD Working Paper No. 1844
1 in 7
people worldwide will be 65 or older by 2030 · up from 1 in 11 in 2015 · UN World Population Prospects 2024
96%
South Korea’s projected old-age dependency ratio by 2060 · from 26% today · OECD Employment Outlook 2025
$5.4T
projected longevity economy by 2034 · from $3T in 2025 · healthcare, nutrition, finance, travel · Bank of Singapore 2026
Visualization 01 — Life Expectancy & Longevity Drivers · 2025
Who Lives Longest — and What Actually Creates Longevity

Life expectancy at birth, 2025 projections. Bar width scaled to Monaco’s 87 years. The key finding across all data: it is not how much a country spends on healthcare that determines lifespan — it is how well the system is designed and how healthy populations live. Sources: UN World Population Prospects 2024 (PRIMARY · un.org) · OECD Health at a Glance 2025 (PRIMARY · oecd.org · November 13, 2025) · WHO/UN global average 2025.
Longevity leader — diet, healthcare design, prevention
Efficient — high life expectancy at moderate spending
Paradox — high spending, underperforming outcomes
Crisis — aging faster than any other country
🇲🇨 MonacoWorld’s longest-lived
87 years life expectancy at birth (2025, UN WPP 2024) · city-state with exceptional wealth, healthcare access, and Mediterranean climate · high physician density · low poverty rates · note: very small population makes this an outlier — Japan, Spain and Switzerland are more meaningful comparators for large populations
87 yrslife exp. 2025
🇯🇵 JapanWorld’s model for aging
~84-85 years — top 5 globally (UN WPP 2024) · world’s highest ratio of centenarians · OECD: “Japan’s decades of economic stagnation since the 1990s attributed in part to this demographic challenge” — dependency ratio 55.5% now · ikigai (sense of purpose) · traditional diet high in fish, vegetables, fermented foods · universal healthcare since 1961 · very low obesity rates
~85 yrstop 5 globally
🇪🇸 Spain · 🇨🇭 Switzerland · 🇦🇺 AustraliaEfficient longevity
~84 years — consistently top 10 globally (UN WPP 2024) · Spain and Mediterranean diet: estimated +3.2 additional life years vs Western averages · strong primary care infrastructure · OECD: these countries “achieve very high life expectancy with substantially lower spending levels” than the US · active ageing culture
~84 yrstop 10 globally
🇰🇷 South KoreaAging fastest of all
~84 years life expectancy — top 5 globally · BUT: OECD Employment Outlook 2025 identifies Korea as taking the lead in aging speed in coming decades: old-age dependency ratio will rise from 26% (2022) → 96% (2060) · the world’s most extreme demographic transition · historically low fertility rates · among highest student stress (education article crossover)
~84 yrs↑ but aging 26→96%
🇺🇸 United StatesSpending paradox
~79 years — significantly below Japan, Spain, South Korea · US per-capita healthcare spending is the highest in the world yet life expectancy trails many peers · OECD: “high obesity rates, lack of universal coverage, the opioid epidemic, gun violence, and high income inequality all drag down U.S. averages” · system designed for acute care, not prevention
~79 yrs↓ below peers
🌍 Global Average · vs Sub-Saharan Africa20-year gap
WHO/UN 2025: global average life expectancy ~73.4 years — recovering from COVID declines · Sub-Saharan Africa (Chad, Nigeria, Sierra Leone): below 60 years · gap between richest and poorest nations: 20+ years — equal to approximately two full generations of development · access to healthcare before age 5 and after age 60 are the key determinants
73.4 yrsglobal avg · 2025
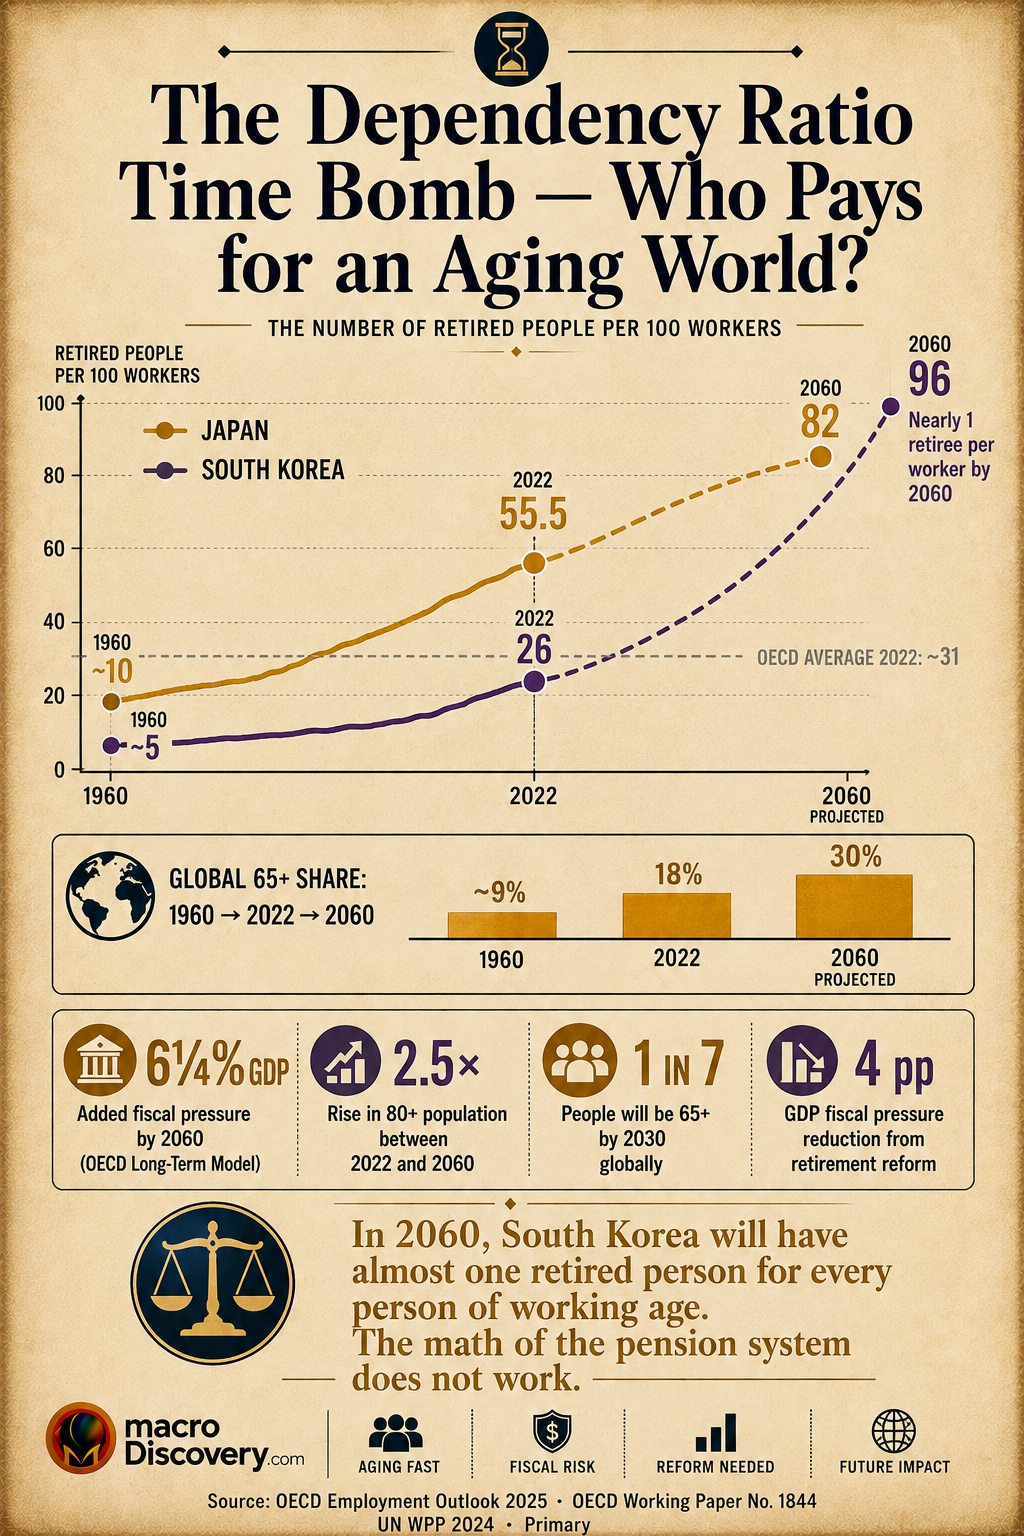
Premium editorial infographic showing a dependency ratio timeline from 1960 to 2060 for Japan (amber gold line) and South Korea (violet line). Japan's line rises from approximately 10 in 1960 to 55.5 in 2022, then projects to 82 by 2060. South Korea's line starts very low (around 5 in 1960), reaches 26 in 2022, then rises steeply to a projected 96 by 2060 — near the top of the chart — with a label noting "nearly 1 retiree per worker by 2060." A grey OECD average reference line sits at approximately 31 for 2022. Below the chart, three bars show the global 65+ share rising from 9% in 1960 to 18% in 2022 to 30% in 2060. Four callout boxes show: 6¼% of GDP added fiscal pressure by 2060 (OECD), 2.5× rise in 80+ population, 1 in 7 people globally will be 65+ by 2030, and retirement reform could reduce pressure by 4 percentage points. Based on OECD Employment Outlook 2025, OECD Working Paper No. 1844, and UN WPP 2024 primary data. Economics of Longevity.
Economics of Longevity
Visualization 02 — The Aging Fiscal Crisis Timeline
From a Manageable Trend to a Structural Fiscal Emergency — How the Math Gets Harder

The fiscal consequences of longevity build slowly, then accelerate. Each milestone below represents a threshold at which the economics of aging shift from gradual to urgent. Sources: OECD Working Paper No. 1844 (primary · Koutsogeorgopoulou & Morgavi · November 2025) · OECD Employment Outlook 2025 (primary) · OECD Health at a Glance 2025 (primary) · UN World Population Prospects 2024 (primary).

1960–2022
The doubling
The 65+ Population Doubled in 60 Years. The Working-Age Population Barely Kept Up.
Between 1960 and 2022, the share of OECD population aged 65 and over more than doubled to around 18%, while the population aged 65+ grew at an annualised rate of 2.2% versus the working-age population’s 0.9%. The old-age dependency ratio — the number of people over 65 per 100 working-age people — more than doubled. This was manageable. Pension systems were designed for a world where people retired at 65 and lived to 70. That world no longer exists.
65+ share doubled to 18%Dependency ratio doubledOECD primary · UN WPP 2024
2030
1 in 7
By 2030: One in Seven People on Earth Will Be 65 or Older. Up from One in Eleven in 2015.
The UN World Population Prospects 2024 projects that by 2030, one in seven people globally will be aged 65 or over — up from one in eleven just 15 years earlier. This is not a Western phenomenon. Emerging economies including China, Brazil, and India are aging rapidly. China’s working-age population is already shrinking. The Bank of Singapore’s 2026 Supertrends report identifies this as one of the defining macroeconomic forces of the coming decade — and the longevity economy as its counterpart opportunity.
1 in 7 = 65+ globallyUp from 1 in 11 (2015)Longevity economy: $3T (2025)
Now
Healthspan gap
Half of People Over 75 Are Already on Five or More Medications. Healthy Life Expectancy Is Not Keeping Pace With Life Expectancy.
The OECD’s 2025 report on healthy ageing found that while life expectancy has been improving, gains in healthy life expectancy (the years spent in good health) have stagnated across OECD countries. Roughly 50% of people aged 75 and over take five or more medications simultaneously across 15 OECD countries with available data — ranging from 21% in Denmark to 89% in Luxembourg. The chronic disease burden of an aging population is the mechanism through which longevity translates into fiscal pressure. Living longer is not the same as living well.
50% of 75+ on 5+ medicationsHLE gains stagnatingChronic disease: key driver
2024–2060
Fiscal bomb
The OECD Projects 6¼ Percentage Points of GDP in Added Fiscal Pressure by 2060. Aging Causes More Than 40% of It. Long-Term Care Is Rising Fastest.
The OECD Working Paper No. 1844 (November 2025) — the most comprehensive recent analysis of aging’s fiscal implications — found that without policy action, the average OECD country faces fiscal pressure equivalent to nearly 6¼ percentage points of GDP by 2060, with aging accounting for more than 40% of the total. Long-term care spending is growing fastest of all — faster than pensions or healthcare — driven by the rapid increase in the 80+ population. Pay-as-you-go pension systems face particular structural pressure as contribution rates fall behind growing retirement cohorts and longer benefit durations.
+6¼% GDP pressureAging: >40% of causeLong-term care: rising fastest
2060
If reformed
Policy Reforms Could Offset 4 Percentage Points of That Pressure. Linking Retirement Ages to Life Expectancy Is the Single Largest Lever.
The same OECD paper found that “changes in retirement policies that reduce early exit pathways and link retirement ages to two-thirds of projected increases in life expectancy, in combination with labour market reforms, would lower the fiscal pressure in 2060 by around 4 percentage points of GDP for the average country.” That leaves roughly 2 percentage points of unavoidable pressure — still significant, but manageable if reforms begin now. The OECD also notes immigration can help in the short term, though it cannot fully offset aging. The longevity economy — worth $3 trillion today — offers a partial economic offset if healthy aging investment grows faster than healthcare costs.
Reform: –4 pp GDP offsetRetirement age: biggest leverLongevity economy: $5.4T by 2034

Living longer is one of humanity’s most consistent achievements. Over the past century, global life expectancy roughly doubled. We eliminated diseases that once killed in childhood. We built healthcare systems that extend the middle years. We made death from infection unusual in rich countries. This is extraordinary. The economics of paying for those extra decades — in a world where populations are aging faster than fiscal systems can adapt — is the defining public finance challenge of the coming generation.

OECD Working Paper No. 1844 · PRIMARY · oecdecoscope.blog · directly fetched · November 7, 2025 · Koutsogeorgopoulou & Morgavi
6¼%
“Fiscal pressure would increase in the average OECD country by nearly 6¼ percentage points of GDP between 2024 and 2060, with ageing accounting for more than 40%.” — OECD Working Paper No. 1844
To contextualise that number: 6¼ percentage points of GDP is larger than the entire defence budgets of most OECD countries. It would require, in the absence of reform, either tax rises of that magnitude or equivalent spending cuts in other areas. Long-term care spending is rising fastest of all — faster than pensions or healthcare — driven by a population aged 80 and over that will almost two-and-a-half times by 2060. The OECD’s paper confirms that “pay-as-you-go pension systems are particularly vulnerable, as contribution rates struggle to keep up with growing retirement cohorts and longer benefit durations.”
Source: OECD Ecoscope — “The fiscal impact of population ageing: How can we afford getting older?” (PRIMARY · directly fetched · oecdecoscope.blog/2025/11/07 · November 7, 2025 · by Koutsogeorgopoulou, V. and H. Morgavi · based on OECD Economics Department Working Paper No. 1844 · “Ageing populations, their fiscal implications and policy responses” · citing UN World Population Prospects: The 2024 Revision throughout)

“Defined-benefit, pay-as-you-go pension systems are particularly vulnerable, as contribution rates struggle to keep up with growing retirement cohorts and longer benefit durations.”

— OECD Working Paper No. 1844 (Koutsogeorgopoulou & Morgavi, 2025) · oecdecoscope.blog (primary · directly fetched)

The Healthspan Gap — Living Longer Is Not the Same as Living Well

The most important distinction in the economics of longevity is between lifespan and healthspan. Lifespan is how long you live. Healthspan is how many of those years you spend in good health. The OECD’s 2025 research on healthy ageing found that while life expectancy has been rising, healthy life expectancy has been stagnating across OECD countries. The extra years we are gaining are disproportionately years of chronic illness, cognitive decline, and dependency. This is not just a personal tragedy. It is the primary economic mechanism through which aging creates fiscal pressure. A person living to 84 who is healthy until 82 costs far less to support than one who needs intensive care from 72. The gap between those two scenarios — multiplied across entire populations — is what the OECD’s 6¼ percentage points of GDP represents.

Why it matters: every year that healthy life expectancy lags behind life expectancy is a year of high-cost medical care that falls on public budgets. Closing the healthspan gap is not just good medicine — it is the single most effective fiscal policy available to aging societies.
OECD — “Economic Benefit of Promoting Healthy Ageing and Community Care” · 2025 · PRIMARY · oecd.org
1 in 7
By 2030, one in seven people worldwide will be aged 65 or older — up from one in eleven in 2015. The share of OECD population aged 65+ reached 18% in 2022 and will hit 30% by 2060.
The scale of the demographic transition is clearest in the 80+ cohort — the group that drives the most intensive and expensive healthcare and long-term care demand. The OECD projects the 80+ population will rise by almost two-and-a-half times between 2022 and 2060. This cohort is already driving the fastest-growing category of public spending: long-term care. Roughly 50% of people aged 75 and over take five or more medications simultaneously. This is the concrete expression of what it costs, in clinical and economic terms, to be very old in 2025.
Source: OECD — “The Economic Benefit of Promoting Healthy Ageing and Community Care” (PRIMARY · oecd.org · 2025) · OECD Ecoscope Working Paper No. 1844 (primary · directly fetched · Nov 2025 · “share of population aged 65+ projected to reach 30% by 2060” · “population aged 80 and over will rise by almost two and half times between 2022 and 2060”) · Bank of Singapore — 2026 Supertrends (3 weeks ago · “by 2030, one in seven people worldwide will be aged 65 or older, compared with roughly one in 11 in 2015”)

The Longevity Economy — $3 Trillion Now, $5.4 Trillion by 2034

There is another side to the economics of longevity. Older populations are not just a cost. They are a market. The Bank of Singapore’s 2026 Supertrends analysis valued the global longevity economy at $3 trillion in 2025 — comparable, it notes, to the top 10 nominal GDPs in the world — growing at a CAGR of 6 to 7% toward $5.4 trillion by 2034. The four growth sectors are healthcare, nutrition, financial services, and travel and leisure. Robotics and AI are identified as key enablers — both helping aging workforces maintain productivity and unlocking new care models. The fiscal challenge of longevity and the commercial opportunity of longevity are two sides of the same demographic shift. The societies that navigate it best will be those that invest in healthy aging rather than just paying for sick aging.


Why it matters: the longevity economy is not a niche. At $3 trillion it already ranks alongside major national economies. Investors, governments, and businesses that understand aging demographics will have structural advantages in the decades ahead.
OECD Working Paper No. 1844 · November 2025 · PRIMARY · Policy Response
4 pp
Retirement reforms linking pension ages to life expectancy — combined with labour market reforms — could offset around 4 percentage points of the 6¼ percentage point fiscal pressure projected by 2060. Reform is not optional.
The OECD’s analysis is unusually direct: without reform, the fiscal math of aging becomes unsustainable for most OECD governments. With comprehensive reform, it remains challenging but manageable. The largest single lever is linking retirement ages to projected increases in life expectancy — something that is politically contentious but economically unavoidable. Immigration helps in the medium term but cannot fully substitute. Investment in healthy aging — reducing the years of chronic illness and dependency — offers the highest return of any longevity policy, because it reduces costs while also sustaining labour force participation and tax contributions from older workers.
Source: OECD Ecoscope / Working Paper No. 1844 (PRIMARY · directly fetched · Nov 7, 2025 · verbatim: “changes in retirement policies that reduce early exit pathways and link retirement ages to two-thirds of projected increases in life expectancy, in combination with labour market reforms, would lower the fiscal pressure in 2060 by around 4 percentage points of GDP for the average country”)
Key Numbers at a Glance
Fiscal · OECD 2024-2060
6¼%
Additional GDP-equivalent fiscal pressure in average OECD country by 2060 from population aging. Aging causes over 40% of it. Long-term care rising fastest.
OECD (primary · directly fetched)
Demographic · 2030
1 in 7
People on Earth will be 65 or older by 2030. Up from 1 in 11 in 2015. The 65+ OECD share will reach 30% by 2060 (from 18% now).
UN World Population Prospects 2024
Korea · Dependency Ratio
96%
South Korea’s projected old-age dependency ratio by 2060 — up from 26% today. Nearly one retired person for every working-age person.
OECD Employment Outlook 2025 (primary)
Market · Longevity Economy
$5.4T
Projected longevity economy by 2034 — from $3T in 2025. Healthcare, nutrition, financial services, travel. CAGR of 6-7%.
Bank of Singapore 2026 Supertrends
Frequently Asked Questions
Which country has the highest life expectancy in the world?
Monaco has the highest life expectancy globally at 87 years (2025 projection, UN World Population Prospects 2024), but as a city-state of about 40,000 people it is an outlier. Among large countries, Japan consistently leads at approximately 84-85 years, along with Spain, Switzerland, South Korea, and Australia in the top 10. Global average life expectancy is approximately 73.4 years in 2025, according to WHO and UN data. The gap between the richest and poorest countries remains more than 20 years.
What is the economic impact of an aging population?
The OECD estimates fiscal pressure will rise by nearly 6¼ percentage points of GDP in the average OECD country between 2024 and 2060, with aging accounting for more than 40% of the increase (OECD Working Paper No. 1844, November 2025). This pressure comes primarily from pensions, healthcare, and long-term care spending — with long-term care growing fastest. Additionally, GDP per capita growth is projected to slow from 1.0% (2010s) to 0.6% as the share of working-age people in OECD populations falls (OECD Employment Outlook 2025).
Which country is aging the fastest?
South Korea — the OECD Employment Outlook 2025 identifies South Korea as “taking the lead in the coming decades,” with its old-age dependency ratio projected to rise from around 26% in 2022 to 96% by 2060. Japan follows, rising from 55.5% to 82% over the same period. By 2030, one in seven people globally will be aged 65 or older (UN World Population Prospects 2024), up from one in eleven in 2015. This demographic shift is now occurring across emerging as well as developed economies.
What is the longevity economy?
The longevity economy refers to the market of goods and services consumed by older populations — healthcare, nutrition, financial products designed for retirement, and travel and leisure for older adults. The Bank of Singapore’s 2026 Supertrends analysis values the longevity economy at $3 trillion in 2025, comparable to the top 10 nominal GDPs in the world, growing at a CAGR of approximately 6-7% toward $5.4 trillion by 2034. Robotics and AI are identified as key enablers, helping aging workforces remain productive and enabling new care models.
Why does the US spend more on healthcare but have a lower life expectancy than Japan?
The US has the highest per-capita healthcare spending in the world but lower life expectancy than Japan, Spain, South Korea, and many other peers. The OECD and UN data attribute this to: high obesity rates, the opioid crisis, gun violence, lack of universal healthcare coverage, high income inequality, and a system designed primarily for acute care rather than prevention. Japan achieves approximately 84-85 years of life expectancy with substantially lower per-capita spending through universal healthcare coverage since 1961, low obesity, a traditional diet high in fish and vegetables, and strong social connections among older adults.
Sources
  • OECD Ecoscope — “The fiscal impact of population ageing: How can we afford getting older?” (PRIMARY · directly fetched · oecdecoscope.blog/2025/11/07 · November 7, 2025 · Koutsogeorgopoulou, V. and H. Morgavi · based on OECD Economics Department Working Paper No. 1844 · citing UN WPP 2024 · KEY VERBATIM CONFIRMED: “fiscal pressure would increase in the average OECD country by nearly 6¼ percentage points of GDP between 2024 and 2060, with ageing accounting for more than 40%” · “share of population aged 65+ more than doubled 1960-2022 to ~18%, projected to reach 30% by 2060” · “population aged 80 and over will rise by almost two and half times between 2022 and 2060” · “dependency ratio more than doubled 1960-2022, 65+ grew 2.2%/yr vs working-age 0.9%” · “defined-benefit, pay-as-you-go pension systems are particularly vulnerable” · “long-term care rising more rapidly than pension and healthcare” · “retirement reforms would lower fiscal pressure in 2060 by around 4 percentage points of GDP”)
  • OECD — “The Economic Benefit of Promoting Healthy Ageing and Community Care” (PRIMARY · oecd.org · 2025 · “life expectancy has been improving but gains have started to stagnate across OECD countries” · “not all years in old age are spent in good health” · “around half of the population aged 75 and above took at least five medications at the same time, ranging between 21% [Denmark] and 89% [Luxembourg]” · “synergistic effect of concurrent mental and physical chronic conditions…dragging down the improvement in healthy life expectancy” · Alzheimer’s and dementias key contributors)
  • OECD — Health at a Glance 2025 (PRIMARY · oecd.org · November 13, 2025 · comprehensive life expectancy and healthy life expectancy data · OECD countries · health spending efficiency comparison)
  • OECD — Employment Outlook 2025 (PRIMARY · oecd.org · October 2025 · “population ageing is set to continue in all OECD countries, even at different speeds, with Korea taking the lead in the coming decades” · “old-age dependency ratio in the country [Korea] is projected to rise from around 26 percent in 2022 to 96 percent in 2060” · Japan: 55.5% (2022) → 82% (2060) · “share of employed persons in the OECD population will fall in most countries, slowing GDP per capita growth from ~1.0% [2010s] to 0.6%”)
  • UN World Population Prospects: The 2024 Revision (PRIMARY · population.un.org/wpp · cited in OECD Working Paper No. 1844 directly · life expectancy 2025 projections: Monaco 87, Japan top 5 ~84-85, Spain/Switzerland/Australia top 10 ~84, US ~79, Sub-Saharan Africa <60 · global average ~73.4 years · women outlive men 4-6 years globally · 2030: 1 in 7 people = 65+ · gap between richest/poorest nations: 20+ years)
  • Bank of Singapore — “2026 Supertrends: The Longevity Economy” (primary industry analysis · bankofsingapore.com · published ~July 2026 · “longevity economy…USD 3 trillion in 2025…USD 5.4 trillion by 2034” · “CAGR of ~6-7%” · “comparable to the top 10 nominal GDPs in the world” · sectors: Healthcare · Nutrition · Financial Services · Travel & Leisure · “robotics and AI are emerging as critical enablers” · “by 2030, one in seven people worldwide will be aged 65 or older, compared with roughly one in 11 in 2015” · citing market studies as basis for market sizing)
  • WHO / UN — World Health Statistics 2025 (PRIMARY · who.int · global life expectancy: ~73.4 years in 2025 · “slight recovery from the declines seen during the height of the COVID-19 pandemic” · “rate of increase has slowed compared to previous decades”)
  • statranker.org citing UN WPP 2024 (April 20, 2026 · citing UN primary data · “United States stands out as a country with very high spending but weaker life-expectancy outcomes than several peers, while places like South Korea, Spain and Japan achieve very high life expectancy with substantially lower spending levels”)
Macro Discovery

Sukh Dhaliwal

Sukh Dhaliwal is the founder of Macro Discovery, an independent digital publication covering AI, technology, science, future trends, and global innovation through visual storytelling and data-driven analysis.

Join WhatsApp

Join Now

Join Facebook

Follow us

Leave a Comment