
The Global Obesity Map —
How the World Got Heavier
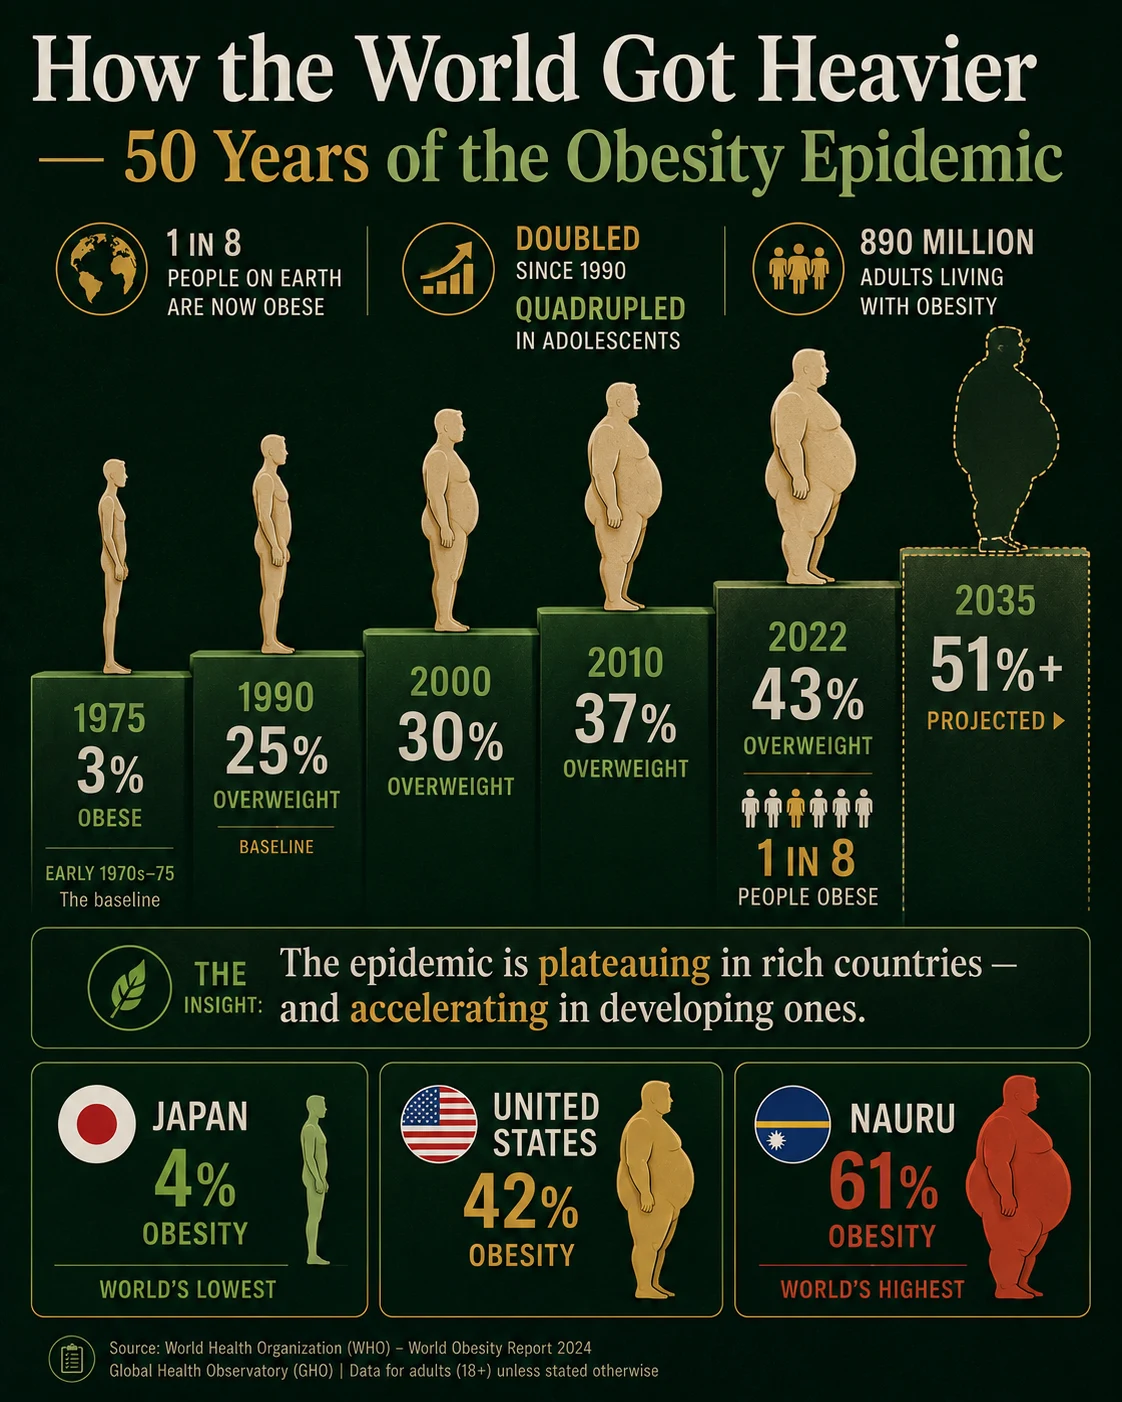
In 2022, 1 in 8 people worldwide was living with obesity. Adult obesity has more than doubled since 1990. Adolescent obesity has quadrupled. The Americas are the most overweight region on earth, with 67% of adults classified as overweight. Pacific island nations have the highest national obesity rates, with Nauru at 61%. And the most significant new development, confirmed by NCD-RisC in Nature (2026): the epidemic is now plateauing in wealthy nations and accelerating in developing ones. The geography of obesity is changing — and the world’s most vulnerable populations are increasingly in its path.
- Adult obesity has more than doubled since 1990, and adolescent obesity has quadrupled. In 1990, approximately 25% of adults were overweight. By 2022, that figure had risen to 43%. Adults with obesity rose from a small fraction to 16% of all adults globally — 890 million people. Among young people aged 5–19, overweight prevalence rose from 8% in 1990 to 20% in 2022, while obesity specifically quadrupled from 2% to 8% (31 million to over 160 million). These numbers are from the WHO Obesity and Overweight Fact Sheet (December 2025, primary, directly fetched).
- The epidemic is no longer primarily a wealthy-country problem. The landmark NCD-RisC study published in Nature in May 2026 — analysing 4,050 population-based studies across 200 countries from 1980 to 2024 — found that obesity is plateauing in developed nations and accelerating in developing ones. The Americas are the most overweight region at 67% of adults, but South-East Asia and Africa, at 31%, are rising fastest. Almost half of all children under 5 who were overweight in 2024 lived in Asia. Africa recorded a 12.1% increase in overweight children under 5 since 2000. The geography of obesity is shifting decisively toward lower-income countries.
- The economic cost is approaching the scale of a permanent global crisis. The global cost of overweight and obesity is projected to reach $3 trillion per year by 2030 and $18 trillion per year by 2060, according to Okunogbe et al. as cited by WHO. The World Obesity Atlas (2023) estimates $4.32 trillion annually by 2035 if trends continue — approximately 3% of global GDP, comparable to the economic impact of COVID-19 in 2020. Without action, more than half of the global population (over 4 billion people) will be living with overweight or obesity by 2035.
- GLP-1 drugs are the most significant treatment breakthrough in decades — but access is deeply unequal. In December 2025, WHO issued its first global guideline on GLP-1 therapies (semaglutide/Ozempic/Wegovy, tirzepatide/Mounjaro/Zepbound) for treating obesity in adults, and added GLP-1s to its Essential Medicines List for managing type 2 diabetes in high-risk groups. The global GLP-1 market is projected to grow from $19.6 billion in 2025 to $104.9 billion by 2035. In the United States, approximately 10 million people were on GLP-1 treatment by 2025, projected to reach 25 million by 2030. But these drugs cost thousands of dollars annually and are largely unavailable in the developing nations where obesity is now accelerating fastest.
- Obesity is a societal condition, not an individual failure. The WHO explicitly frames obesity as “a societal rather than an individual responsibility,” created by “obesogenic environments” shaped by globalisation and industrialised food systems. NCD-RisC research identified rising rural BMI — not urban sprawl — as the main driver of the global obesity epidemic in adults (Nature, 2019), reflecting the penetration of ultraprocessed food into previously rural, traditional-diet communities worldwide. The epidemic is not driven by changing individual choices but by the structural transformation of the global food supply.
Source: WHO “Obesity and Overweight” Fact Sheet (December 8, 2025 · primary · directly fetched). Directly quoted from primary: “Prevalence of overweight varied by region, from 31% in the WHO South-East Asia Region and the African Region to 67% in the Region of the Americas.” Global 1990 figure (25%) and 2022 figure (43%) directly confirmed from WHO primary. Europe and Eastern Mediterranean regional figures are approximate estimates from WHO GHO regional data. ▲ indicates fastest-rising regions per NCD-RisC Nature 2026. Bar lengths proportional to overweight rate, anchored at Americas (100%).
| Country / Territory | Obesity rate (adults) | Data year | Trend | Key context | Rate |
|---|---|---|---|---|---|
🇦🇸 American SamoaUS territory · Pacific |
68.5% | 2025 est. | World’s highest | Pacific genetics, shift from traditional diets to imported processed foods, sedentary lifestyles, and very limited access to fresh produce. | |
🇳🇷 NauruSmallest republic · Pacific |
61% | 2023 | Critically High | Highest obesity rate of any sovereign nation. Also highest obesity-related premature mortality. 97% of land area is phosphate rock — minimal food production possible. Entirely import-dependent for food. | |
🇨🇰 Cook IslandsPacific |
56% | 2023 | Critically High | Second-highest sovereign nation rate. Childhood obesity also highest globally. Traditional diet replaced by canned and processed food imports. Geographic isolation limits fresh food access. | |
🇶🇦 QatarGulf · Middle East |
~40% | 2022–2024 | Very High | Rapid oil-wealth urbanisation. Car-dependent infrastructure. Shift from traditional diets. High air-conditioned sedentary lifestyles in extreme heat. Among highest major-economy rates. | |
🇺🇸 United StatesNHANES · CDC 2017–2020 |
~41.9% | 2017–2020 | Very High | ~7 in 10 adults overweight or obese. Half projected obese by 2030 without intervention. GLP-1 drugs reaching 10M+ users. Biggest absolute numbers of any high-income country. | |
🇬🇧 United KingdomNHS Health Survey 2025 |
27.8% | 2025 | High | Rising: +3.2% from 2024. 1.6M adults in England, Wales, Scotland used weight-loss drugs in past year (UCL study 2026). Sugar tax introduced 2018. | |
🇧🇪 GermanyNational Health Interview Survey |
~25% | 2022–2024 | Moderate | Rising steadily. East Germany historically higher than West. Central Europe has among fastest-rising rates in the EU. High overweight rate (~60%) masks lower obesity metric. | |
🇧🇷 FranceNational nutrition data |
~21% | 2023 | Moderate | One of lowest major European economies. Mediterranean-influenced diet, stronger food culture norms, and earlier sugar tax policies. Rising but from lower base. | |
🇧🇰 Dem. Rep. CongoDRC · Low income |
~4.5% | 2023–2024 | Low but rising | Among lowest rates globally but urbanisation and processed food penetration are creating a “double burden” — undernutrition and rising obesity coexist in same cities. The trajectory NCD-RisC 2026 warns about. | |
🇮🇳 IndiaNational Family Health Survey |
~4–5% | 2019–2021 | Rising fast | Low rate but 1.4 billion population means tens of millions affected in absolute terms. Urban India rising sharply; rural rates rising due to processed food penetration (key NCD-RisC 2019 finding). Fastest-growing diabetic population globally. | |
🇯🇵 JapanNational Health and Nutrition Survey |
~4–5% | 2022–2023 | Very Low | World’s lowest obesity rate among major economies. Traditional diet (fish, vegetables, fermented foods), cultural portion norms, Metabo Law (employers must track waist sizes). Life expectancy also among world’s highest. | |
🇻🇳 VietnamNational surveys |
~3% | 2022 | Rising | Among world’s lowest — but urban Vietnam is westernising its diet rapidly. Ho Chi Minh City overweight rates now significantly exceed national average. Trajectory of concern. |
Sources: WHO Global Health Observatory (GHO) “List of countries by obesity rate” (2024 data · Wikipedia citing WHO 2024 as of July 2026) · Statista/WHO (Nauru 61%, Cook Islands 56%, Qatar 40% · 2023 NCD-RisC basis) · Basarihospital.com citing WHO (US 41.9% · NHANES 2017–2020) · NHS Health Survey for England 2025 (UK 27.8%) · World Obesity Observatory data.worldobesity.org (DRC, India national survey data) · Japan NHNS 2022. Country figures use crude (not age-standardised) prevalence where available. Note: American Samoa is a US territory, not a sovereign state; Nauru is the highest sovereign nation. Click column headers to sort.
How Did the World’s Weight Double in a Single Generation?
In 1990, approximately 25% of adults worldwide were overweight. By 2022, that had risen to 43% — nearly double — and 16% of all adults were classified as obese. This transformation occurred in a single generation, faster than almost any other shift in global health status recorded in the modern era. Understanding why requires looking past individual choices to the structural transformation of the global food system that occurred over the same period.
The WHO frames it precisely: obesity is created by “obesogenic environments” shaped by “globalisation and industrialised food systems” and “shifts in diet, physical activity, and societal and individual behaviour.” The world did not collectively decide to eat more and move less. The food environment changed — ultraprocessed foods became dramatically cheaper, more available, and more heavily marketed than whole foods in virtually every country on earth. Simultaneously, the nature of work and daily movement shifted, with urbanisation reducing the incidental physical activity embedded in agricultural and manual labour.
NCD-RisC’s 2019 Nature paper identified a finding that inverted common assumptions: rising rural BMI, not urban weight gain, was the main driver of the global obesity epidemic in adults. This means the epidemic was not primarily about prosperous city-dwellers eating too much restaurant food. It was about the penetration of ultraprocessed, calorie-dense food into previously rural communities with traditional diets — communities that lacked the infrastructure, income, and access to fresh food alternatives that would allow them to resist the caloric density of industrial food. When a packet of instant noodles is cheaper and more available than vegetables, rural populations shift their diet accordingly. The global food supply changed around them.
Why Are Pacific Island Nations the World’s Most Obese — and What Does That Tell Us?
Nauru, a sovereign island state of roughly 10,000 people in the central Pacific, has an obesity rate of approximately 61% — the highest of any independent country in the world. The Cook Islands follow at approximately 56%. These figures, confirmed by NCD-RisC data via Statista and WHO, reflect a combination of genetic factors and one of the most extreme examples of food environment transformation in the world.
Pacific island populations have a genetic predisposition to store fat efficiently — an evolutionary adaptation to periods of food scarcity in isolated ocean environments. But genetics cannot explain multi-decade obesity trajectories; those require environmental change. For Nauru specifically, the environmental change was catastrophic. The island’s entire interior was mined for phosphate rock through the 20th century, leaving 97% of its land unusable for agriculture. The country became almost entirely dependent on imported processed foods — tinned meat, white rice, instant noodles, soft drinks — with virtually no capacity to grow fresh food locally. Physical activity also declined dramatically as mining mechanised.
The Nauru story is an extreme version of what is happening more broadly across the developing world. When traditional food systems are disrupted — by colonialism, by mining, by rapid urbanisation, by trade liberalisation that floods local markets with cheap processed imports — populations that evolved on whole-food diets encounter a caloric environment they have no cultural, economic, or biological defence against. The Pacific island crisis is not about individual choices. It is about the removal of any food environment in which those choices could be meaningfully exercised.
Why Is Adolescent Obesity the Most Alarming Trend in the Data?
The WHO’s primary fact sheet (December 2025) contains a figure that deserves special attention: while adult obesity more than doubled between 1990 and 2022, adolescent obesity quadrupled over the same period. Among young people aged 5–19, obesity specifically rose from 2% in 1990 (31 million children) to 8% in 2022 (over 160 million children) — a fourfold increase in prevalence representing a fivefold increase in absolute numbers over a period in which the global youth population also grew. Overweight broadly (including obesity) among the same age group rose from 8% to 20%.
The significance is both immediate and generational. Children with obesity face elevated risks of type 2 diabetes, cardiovascular disease, sleep disorders, and musculoskeletal problems in childhood and adolescence — conditions previously rare among young people. In 2025, an estimated 98 million children globally showed early signs of metabolic dysfunction-associated steatotic liver disease (MASLD) linked to high BMI, with that number projected to reach 124 million by 2040. Obesity in childhood has a strong tendency to persist into adulthood — the majority of children with obesity will be adults with obesity. The children gaining weight today are setting the population health trajectory of 2050.
The geographic distribution of child obesity also reflects the NCD-RisC Nature 2026 finding: almost half of all children under 5 who were overweight or living with obesity in 2024 lived in Asia, not the traditionally recognised obesity hotspots of North America and Europe. Africa recorded a 12.1% increase in overweight children under 5 since 2000 (WHO primary). These trends reflect the penetration of ultraprocessed food marketing and availability into the communities raising the next generation — and the near-absence of effective regulatory frameworks to counteract it in most developing countries.
What Is the Economic Cost of Obesity — and Is It Getting Worse?
The economic burden of obesity operates through multiple channels simultaneously: direct healthcare costs for treating obesity-related conditions (type 2 diabetes, cardiovascular disease, 13 types of cancer, sleep disorders, musculoskeletal conditions); productivity losses from reduced workforce participation, disability, and premature mortality; and longer-term human capital costs as obesity in childhood affects educational outcomes and lifetime earning potential. The aggregate impact is large enough that both the WHO and multiple peer-reviewed economic studies have devoted major research efforts to quantifying it.
The WHO, citing Okunogbe et al.’s second-edition analysis of 161 countries, projects global costs of overweight and obesity reaching $3 trillion per year by 2030 and $18 trillion per year by 2060 (WHO primary, December 2025). The World Obesity Atlas 2023 reaches a somewhat different figure using different methodology: $4.32 trillion annually by 2035, equivalent to approximately 3% of global GDP — comparable, as the report notes, to the economic impact of COVID-19 in 2020. A peer-reviewed BMJ Global Health study found current costs at approximately 1.8% of GDP on average across eight countries studied, ranging from 0.8% in India to 2.4% in Saudi Arabia. By 2060, without intervention, these costs are projected to reach 3.6% of GDP on average, with some countries exceeding 4%.
In the United States, obesity adds approximately $1,429 per year to an individual’s medical costs — 42% higher than a person of normal weight — according to NCBI research. Medicaid spending on GLP-1 weight-loss drugs alone rose from approximately $1 billion in 2019 to $8.6 billion in 2024 (Forbes Health), and this is before GLP-1s reach their projected market scale. The economic logic of treating obesity pharmacologically is powerful in wealthy countries: the cost of GLP-1 drugs, while high, can be offset by reductions in spending on treating diabetes, cardiovascular procedures, and cancer. Whether that logic will drive equitable global access is the central question the obesity epidemic now poses.
Which Countries Have Best Managed Obesity — and What Can Be Learned?
Japan’s obesity rate of approximately 4–5% is the lowest of any major economy and has remained consistently low even as the country has become one of the world’s wealthiest and most urbanised. The explanation is structural rather than genetic. Japan has maintained a food culture with strong portion norms, traditional dietary patterns emphasising fish, fermented foods, and vegetables, and lower ultraprocessed food penetration than comparable wealthy countries. It also introduced the Metabo Law in 2008 — legislation requiring employers and local governments to annually measure the waist circumferences of employees aged 40–74 and ensure those above threshold receive dietary guidance. Japan’s life expectancy is among the world’s highest partly because of its weight profile.
Evidence-based policy interventions that have shown measurable results in other countries include sugar-sweetened beverage (SSB) taxes, which have been implemented in the UK, France, Mexico, and several US cities. The UK’s Soft Drinks Industry Levy (2018) has been associated with reformulation of product recipes across the industry, not just reduced consumption. Mexico’s SSB tax reduced soda consumption, particularly among low-income households most exposed to the obesity risk. Front-of-pack nutrition labelling — mandatory in Chile, Ecuador, and Mexico — has been linked to reduced purchases of high-sugar, high-fat products and has driven reformulation.
The WHO’s explicit framing of obesity as “a societal rather than an individual responsibility” carries direct policy implications: interventions that change food environments (taxes, labelling, marketing restrictions, urban planning for active transport) are more likely to achieve population-level change than interventions that target individual behaviour alone. The countries that have done best — Japan, South Korea, France, and Italy by comparison with the US and UK — share strong food cultures, lower ultraprocessed food penetration, and structural features (walking infrastructure, smaller portion norms, less car dependency) that make healthier choices easier by default rather than requiring active resistance to the food environment.
- WHO — “Obesity and Overweight” Fact Sheet (primary · December 8, 2025 · directly fetched · 1 in 8 obese · 890M adults · 2.5B overweight · 43% vs 25% 1990 · adult obesity doubled · adolescent obesity quadrupled · Americas 67% · SE Asia + Africa 31% · $3T/yr 2030 · $18T/yr 2060 · 35M under-5 overweight · Africa +12.1% children · Asia = half child overweight)
- NCD-RisC — “Obesity rise plateaus in developed nations and accelerates in developing nations” (Nature 653, 510–518 · 2026 · primary · 4,050 population-based studies · 200 countries · 1980–2024 data · WHO GHO now uses this dataset)
- NCD-RisC — “Worldwide trends in underweight and obesity from 1990 to 2022” (The Lancet 2024 · 403(10431):1027–1050 · primary peer-reviewed · 3,663 population-based studies · 222 million participants · 880M adults with obesity · 159M children 5–19 · World Obesity Federation basis)
- WHO — “WHO issues global guideline on the use of GLP-1 medicines in treating obesity” (December 1, 2025 · primary · 3.7M deaths 2024 citation · obesity projected to double by 2030 · GLP-1 Essential Medicines List September 2025 · conditional recommendations)
- World Obesity Federation — “Economic Impact of Overweight and Obesity to Surpass $4 Trillion by 2035” (World Obesity Atlas 2023 · $4.32T annually by 2035 · ~3% global GDP · COVID-19 comparison · 51% of population overweight/obese by 2035 · 1 in 4 obese by 2035)
- Statista — “Overweight and Obesity Worldwide — Statistics & Facts” (February 20, 2026 · ILO/NCD-RisC/WHO basis · Nauru 61% · Cook Islands 56% · American Samoa 68.5% · 42% global overweight 2024 · 44% projected 2029 · GBD 2021 burden +11%)
- World Obesity Federation — “Economic Cost to Reach 3.3% of Global GDP by 2060” (BMJ Global Health peer-reviewed basis · current cost 1.8% GDP average · China + US + India largest cost countries · 3.6% GDP by 2060 average)
- JPMorgan — “How Supply and Demand for Weight Loss Drugs Is Playing Out in 2026” (2026 · ~10M Americans on GLP-1 2025 · 25M projected 2030 · oral GLP-1 approval end 2025 · market growth drivers)
- Drug Discovery World — “Obesity Treatment Trends in 2026 and Beyond” (February 2026 · GLP-1 market $19.6B 2025 → $104.9B 2035 · CAGR 18.3% · 1.6M UK users UCL study · FDA Wegovy pill approved end 2025)
- Forbes Health — “GLP-1 Statistics & Trends: Usage, Market Size, Pricing & Research (2026)” (June 2026 · Medicaid GLP-1 $1B 2019 → $8.6B 2024 · 1 in 8 US adults taking GLP-1 · KFF poll · obesity 3.7M deaths WHO citation · SELECT trial semaglutide CVD outcomes)












