The World’s Most Dangerous Jobs
— by Country and Industry
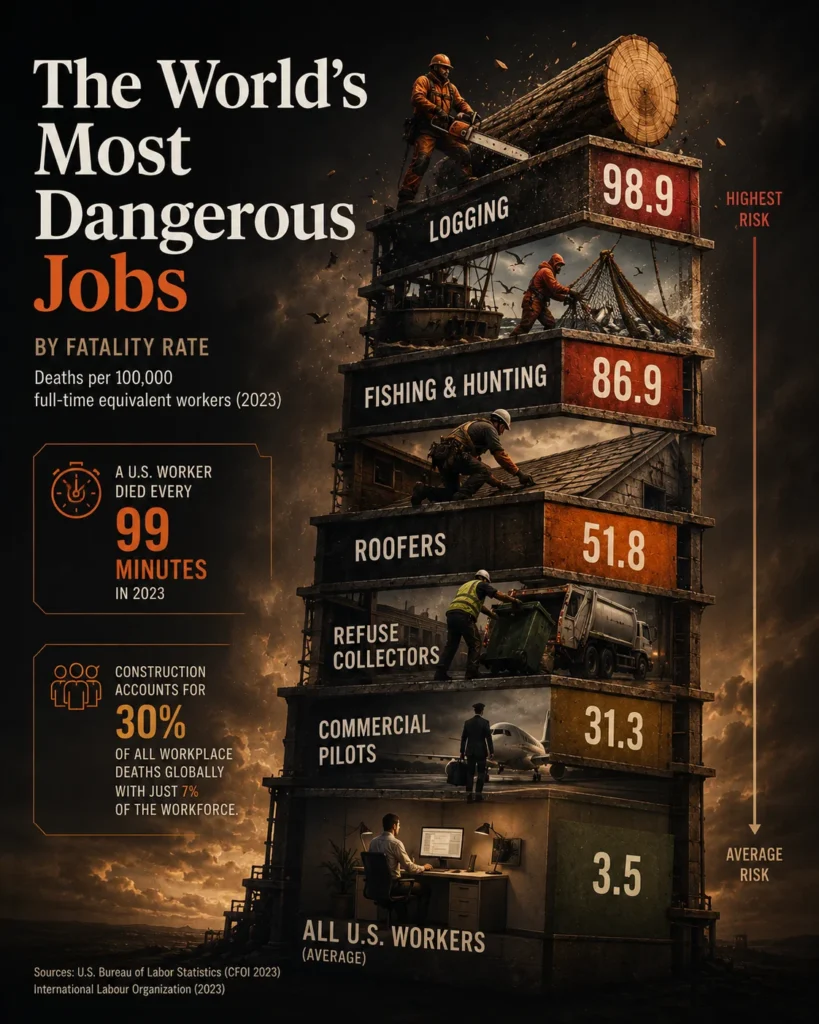
Logging kills 98.9 workers per 100,000 every year — 28 times the average US fatality rate. Commercial fishing kills 86.9. Roofers die at a rate 10 times higher than other construction workers. In the United States in 2023, a worker died every 99 minutes. Globally, construction accounts for 30% of all workplace deaths despite employing just 7% of the workforce. Agriculture kills one-third of all workers who die on the job worldwide. And in parts of Asia and Africa, workplace fatality rates run four to five times higher than in Europe. This is the full picture of occupational danger — by job, industry, and country.
- Logging is the most dangerous occupation in the United States, killing 98.9 workers per 100,000 — 28 times the national average. In 2023, 52 loggers died at work in the US alone. The dangers are structural: workers operate heavy saws and machinery in remote forests, falling timber is unpredictable, emergency services are far away, and individual loggers often work without colleagues nearby. No major technological advancement has yet removed the fundamental hazard of a multi-tonne tree falling in an uncontrolled direction.
- Construction is simultaneously the industry where the most workers die globally and the most structurally preventable. The ILO estimates that construction accounts for approximately 30% of all fatal occupational accidents worldwide despite employing only 7% of the global workforce — a disproportionality that reflects not inherent impossibility but regulatory and enforcement failure. In the UK, 42% of all construction fatalities are caused by falls from height — a hazard that safety equipment and regulation can directly address. In the United States in 2023, construction was the highest total since 2011, with 1,075 industry fatalities.
- The global workplace death toll dwarfs many other causes of preventable death — but 89% of it is invisible. The ILO estimates approximately 2.78 million workers die from occupational causes annually. Only around 330,000 (11%) die from direct accidents — the kind that make headlines. The remaining 89% — approximately 2.6 million deaths — come from occupational diseases: cancers, cardiovascular and respiratory conditions caused by long-term exposure to dust, chemicals, and carcinogens. The largest single occupational risk factor globally is not machinery or falls: it is working more than 55 hours per week, which the WHO/ILO joint estimates link to approximately 745,000 deaths per year.
- Where you live determines your workplace risk more than what you do. Construction sites in developing countries are approximately 10 times more dangerous than those in industrialised countries, according to the ILO. Fatality rates in Africa and Asia are estimated at 4-5 times European rates. In Bhutan, the overall workplace fatality rate is 31.9 per 100,000 workers across all industries — compared to 0.3 in the Netherlands and 0.42 in the UK. A construction worker in Bangladesh or India faces risks orders of magnitude higher than a construction worker in Germany or Denmark doing the same job.
- The hidden victims of workplace danger are often invisible workers. Hispanic and Latino workers in the US suffered 1,250 workplace deaths in 2023, a fatality rate of 4.4 per 100,000 — higher than the 3.5 national average. Foreign-born Hispanic workers accounted for 67.1% of those deaths, concentrated in construction (37.5% of foreign-born Hispanic fatalities). Women accounted for only 8.5% of all workplace fatalities but 18.3% of workplace homicides — a pattern driven by retail and healthcare settings. Workers aged 55-64 had the highest total fatality count of any age group. Sources: BLS CFOI 2023 primary.
Sources: US Bureau of Labor Statistics — Census of Fatal Occupational Injuries 2023 (USDL-24-2564 · primary · directly fetched · December 19, 2024). Specific occupation rates (logging 98.9, fishing 86.9, roofers 51.8, refuse 41.4, pilots 31.3, grounds 20.5, agriculture 20.2, steel 19.8) from BLS detailed supplemental tables (bls.gov/iif/fatal-injuries-tables.htm) as cited by OSHA and occupational safety sources. Occupational group rates (farming/fish/forest 24.4, transport 13.6, construction 12.9, all workers 3.5) directly from BLS CFOI 2023 Table 4 (primary). Total death counts from BLS CFOI 2023 Table 3 (primary). Computer/mathematical: 11 total fatalities in 2023 (Table 3 primary). Bar lengths are proportional to fatality rate; all bars capped at chart width.
| Industry | Global share of fatal accidents | US fatalities 2023 | Primary hazards | Risk level |
|---|---|---|---|---|
🏗 Construction7% of global workforce |
~30% of all global fatal accidents — disproportionate to workforce share by 4× | 1,075 | Falls from height (№1 cause). Struck by objects. Machinery. Electrical. Confined spaces. Highest for any year since 2011 in US. | ⚠ Extreme |
🌾 AgricultureIncl. forestry, fishing, hunting |
~33% of all fatal occupational injuries globally (ILO 2023). Highest industry rate in US at 24.4/100K. | 448 | Tractor overturns. Farm machinery entanglement. Animal-related injuries. Pesticide exposure. Logging (98.9/100K). Fishing (86.9/100K). Remote locations. | ⚠ Extreme |
🚘 Transportation & warehousingTruck, delivery, logistics |
Major contributor globally. US: rate 13.6/100K; total 930 deaths in transport/warehousing sector (2023). | 930 | Roadway collisions (71.7% of sector deaths). Long-haul fatigue. Heavy vehicle incidents. Opioid-related: 162 primary + 144 contributing fatalities in US. | High |
⛏ Mining, oil & gasExtractive industries |
Consistently one of highest-rate sectors. Underground mining: 35.6/100K (US estimates). | 113 | Cave-ins. Gas leaks. Machinery. Explosions. Underground confined spaces. Toxic exposure. Fatigue from remote shift work. | High |
🏭 ManufacturingProduction & processing |
Among top 5 globally per ILO 2023 sector breakdown (with agriculture, construction, forestry, fishing). | 391 | Machinery contact. Chemical exposure. Heat stress. Explosions. Repetitive stress injuries leading to long-term health conditions. Steel: 19.8/100K. | Moderate-High |
🏫 Healthcare & social assistanceHospitals, care facilities |
Lower fatal injury rate but high non-fatal. US: significant homicide risk (retail/healthcare = most workplace homicides). | 99 | Workplace violence. Patient handling (musculoskeletal). Needle-stick injuries. Infectious disease. Women: 18.3% of US workplace homicides in 2023. | Moderate |
💻 Technology / office workComputer, legal, finance |
Lowest fatality sector. US: computer/mathematical 11 total deaths in 2023; legal occupations: 7. | ~20-30 | Primarily sedentary-related chronic conditions (not counted in fatal injury statistics). Traffic commuting. Very low acute fatality risk. Nuclear industry: <1/100K. | Very Low |
Sources: ILO — Safety and Health at Work: A Vision for Sustainable Prevention (2023 review · primary). Global shares (construction 30%, agriculture 33%) confirmed via SmartQHSE (April 2026 · ILO basis) and Briefly.co.za (June 2025 · ILO basis). US fatalities from BLS CFOI 2023 Table 2 (industry sectors · primary · directly fetched): construction 1,075; agriculture/forestry/fish/hunt 448; transport/warehousing 930; mining/quarrying/oil&gas 113; manufacturing 391; healthcare 99 approx. Healthcare homicide share from BLS CFOI 2023 primary (women 18.3% of workplace homicides). Nuclear industry <1/100K from Forbes via Briefly.co.za. Click column headers to sort.
| Country | Fatal rate /100K | Region | Key context | Risk level |
|---|---|---|---|---|
🇧🇹 BhutanArinite/ILO analysis |
31.9 | South Asia | Highest overall average across all industries in Arinite/ILO dataset. Rapidly developing economy with construction and agriculture concentrations. Limited safety enforcement capacity. | Highest in dataset |
🇹🇱 Timor-LesteArinite/ILO analysis |
29.2 | SE Asia | Second highest in Arinite/ILO dataset. Small economy with high concentration of agricultural and construction workers relative to population. | Very High |
🇧🇮 BurundiILO reported data |
13.8 | Sub-Saharan Africa | Highest rate in ILO reported data for 2024 per fatalaccidentclaims.org analysis. Limited industrial regulation and enforcement. Primarily agricultural economy. | Very High |
🇨🌞 ColombiaILO reporting country |
6.5–11.5 | Latin America | Among worst-ranked in ILO reporting countries per Statista/ILO Feb 2026. Range reflects different measurement methodologies. High construction + transport mortality. | High |
🇨🇷 Costa RicaILO reporting country |
9.7 | Latin America | Highest fatal injury rate in ILO reporting countries as of Feb 2026 (Statista/ILO). Also highest non-fatal rate in data. Active industrial economy with enforcement gaps. | High |
🇨🇦 CanadaAWCBC national data |
5.7 | North America | Above US rate. Reflects higher concentration of resource extraction (mining, oil sands, forestry) relative to workforce. Resource-rich provinces (BC, Alberta) have higher rates. | Moderate |
🇺🇸 United StatesBLS CFOI 2023 · primary |
3.5 | North America | 5,283 total deaths. A worker died every 99 minutes. “Among worst-ranked in Western world” (Statista/ILO Feb 2026). Top cause: transportation 1,942 (36.8%). Source: BLS primary. | Moderate |
🇬🇧 United KingdomHSE 2023/24 |
0.42 | Western Europe | 138 worker fatalities 2023/24 (HSE). 42% of construction deaths from falls from height. UK workers face ~8× lower risk than US workers — despite doing the same jobs. Strong regulatory enforcement. | Low |
🇳🇱 NetherlandsEurostat / national data |
0.3 | Western Europe | Among Europe’s best performers. Workers in Bhutan face a risk ~100× higher than Dutch workers. Strong OSH enforcement, worker representation, and safety culture. | Very Low |
🇮🇨 IcelandArinite/ILO analysis |
~0 | Northern Europe | Zero workplace fatalities per 100,000 workers in ILO-basis Arinite analysis. Also Malta and San Marino. Small countries with strong safety cultures and limited heavy industry. | Lowest |
⚠ Important caveat: Cross-country comparisons are limited by major differences in national reporting methodologies, under-reporting (particularly in developing countries), and varying definitions of workplace fatality. ILO explicitly cautions that actual deaths in low-income countries are likely significantly higher than reported. Bhutan and Timor-Leste figures from Arinite Health and Safety Consultancy analysis of ILO data. Burundi from fatalaccidentclaims.org analysis of ILO 2024 data. Costa Rica, Colombia from Statista/ILO (February 19, 2026). Canada from AWCBC national data. UK from HSE Annual Statistics 2023/24. Netherlands from Eurostat. Iceland from Arinite/ILO. US: BLS CFOI 2023 (primary · directly fetched). Click column headers to sort.
Why Is Logging the Most Dangerous Job — and Can It Ever Be Made Safe?
Logging has topped the US occupational fatality rate rankings consistently for decades. In 2023, it killed 98.9 workers per 100,000 — 28 times the national average of 3.5. Of the 52 loggers who died at work that year, most were killed by falling timber, which remains fundamentally unpredictable despite advances in technique and equipment. A mature tree can weigh several tonnes and travel in unintended directions when cut. The force generated is sufficient to kill instantly at significant range, and protective equipment cannot prevent death from direct impact with a falling trunk.
The structural danger compounds the physical one. Logging operations take place in remote forests, often without colleagues immediately nearby. When injuries occur — and the BLS notes that improper equipment operation and inadequate supervision are common contributing factors — emergency medical services may take hours to arrive. Minor injuries that would be survivable in an urban setting become fatal in the backcountry. The combination of inherently unpredictable physical hazards, remote locations, and isolation has resisted all efforts to reduce the fatality rate to anywhere near the national average.
Commercial fishing presents similar structural problems. Its 86.9 fatality rate per 100,000 workers reflects the intersection of heavy machinery, unpredictable seas, physical exhaustion from long shifts, and the impossibility of emergency evacuation when incidents occur miles from shore. Fishers face drowning risks, entanglement in nets and lines, and weather-related instability that no amount of safety training fully mitigates when conditions change rapidly at sea. Both logging and commercial fishing represent industries where the fundamental hazard is not a failure of regulation or equipment but an inherent property of the work environment itself.
Why Does Construction Account for 30% of Workplace Deaths Despite 7% of the Workforce?
The ILO’s estimate that construction accounts for approximately 30% of all fatal occupational accidents globally while employing only 7% of the global workforce is the most striking single statistic in global workplace safety. It implies a fatality rate approximately four times higher than the economy-wide average — meaning a construction worker is roughly four times more likely to die at work than the average employed person worldwide. In the United States in 2023, the construction industry sector recorded 1,075 fatalities — the highest total since 2011, according to the BLS primary report.
The leading cause of death in construction is consistent across most countries: falls from height. In the United Kingdom, 42% of all construction fatalities result from falls, according to HSE data. In the US, construction falls accounted for 421 deaths in 2023, with portable ladders alone causing 109 fatalities. Roofers — the most exposed subgroup — die at a rate approximately 10 times higher than other construction trades, and their 51.8 per 100,000 rate reflects the near-total exposure to fall risk that roofing work involves.
The geographic disparity within construction is where the systemic failure is most visible. The ILO notes that construction sites in developing countries are approximately 10 times more dangerous than those in industrialised countries. A construction worker in Germany or Denmark, doing structurally similar work, faces a risk an order of magnitude lower than a construction worker in Bangladesh or Cambodia. The difference is not the physics of falling — gravity is the same everywhere. The difference is scaffolding standards, fall protection equipment, safety inspection systems, worker training requirements, and the political will to enforce them. Construction deaths are, to a significant degree, deaths that competent regulation could prevent.
Which Countries Have the Most Dangerous Workplaces — and Why Is the Gap So Large?
The workplace fatality rate in Bhutan — 31.9 deaths per 100,000 workers across all industries, according to Arinite’s analysis of ILO data — is approximately 91 times higher than the Netherlands (0.3 per 100,000) and approximately 76 times higher than the UK (0.42). A worker in Bhutan is doing work — construction, agriculture, manufacturing — that is physically similar to work done in Europe. The fatality rate difference of two orders of magnitude is not a difference in the physics of the hazard. It is a difference in regulatory frameworks, enforcement capacity, worker representation, equipment standards, and safety culture.
The ILO’s regional estimates capture this pattern at scale. Fatality rates in Africa and Asia are estimated at 4 to 5 times European rates. Asia accounts for 65% of global work-related mortality despite having approximately 60% of the global workforce — a slight but meaningful overrepresentation reflecting both the industry composition (more agriculture, construction, and manufacturing relative to services) and the weaker safety regulatory infrastructure across most of the region. The economic cost of this gap is enormous: the ILO has estimated that GDP lost to work-related injuries and diseases exceeds the combined GDP of Africa, the Arab States, and South Asia — more than all official development assistance provided to the world’s developing countries.
The US sits in an uncomfortable middle position among wealthy nations. With a rate of 3.5 per 100,000 workers — compared to 0.42 in the UK and 0.3 in the Netherlands — the US is described by Statista/ILO analysis (February 2026) as “among the worst-ranked countries in the Western world” for workplace fatality rates, alongside France and Portugal. The explanation is partly structural (the US has a higher proportion of workers in construction, agriculture, and transportation than most Western European economies) but also regulatory: OSHA, the primary US workplace safety enforcer, has significantly fewer inspectors per worker than European equivalents, and penalty levels for safety violations are lower.
What Causes Most Workplace Deaths in the US — and Has the Rate Been Improving?
Transportation incidents are the leading cause of fatal workplace injuries in the United States by a substantial margin. In 2023, transportation events caused 1,942 of the 5,283 total workplace fatalities — 36.8% of all deaths. Roadway incidents involving motorised land vehicles accounted for the majority of these, with heavy truck and tractor-trailer drivers alone suffering 823 fatalities — the single largest individual occupation by total deaths in the US. The combination of long hours, fatigue, commercial pressure, and the physics of heavy vehicles creates a consistent pattern of fatal incidents that has proved resistant to improvement despite better vehicle technology and driving assistance systems.
Falls, slips, and trips caused 885 workplace deaths in 2023 (16.7% of total). Exposure to harmful substances or environments caused 820 (15.5%). Contact with objects and equipment caused 779 (14.7%). And violent acts — including both homicides and suicides — caused 740 deaths (14.0%), with homicides accounting for 458 and opioid-related deaths sitting in a separate category that contributed an additional 162-306 fatalities depending on methodology. The US workplace fatality rate of 3.5 per 100,000 in 2023 was a modest improvement from 3.7 in 2022 — driven primarily by declines in transportation and service sector deaths. OSHA attributed this improvement partly to doubled enforcement efforts following elevated pandemic-era fatalities.
The long-run trend in US workplace safety is one of genuine improvement. In the early 1970s, when OSHA was created, the US recorded approximately 14,000 workplace fatalities per year in a smaller workforce. In 2023, it recorded 5,283 in a much larger one — a dramatic per-capita reduction attributable to improved safety regulation, better equipment, and structural shifts away from the most dangerous industries. But the improvement has plateaued. OSHA’s own data shows the US fatal injury rate has remained broadly flat for the past decade, and the 2023 construction total was the highest since 2011. Without renewed regulatory investment, including more inspectors and higher penalties, the long-run improvement trend risks stalling.
Is Workplace Safety Getting Better Globally — or Are We Making Progress?
The global picture on occupational safety is mixed. In high-income countries with robust regulatory frameworks, there has been genuine and sustained improvement. The UK’s fatal injury rate of 0.42 per 100,000 workers reflects decades of investment in occupational health and safety regulation, prosecutorial enforcement, and a cultural shift in which large employers treat safety performance as a reputational and legal priority. Countries like the Netherlands (0.3 per 100,000) and the Nordic economies have pushed rates even lower through strong worker representation, high OSHA-equivalent inspection ratios, and serious criminal consequences for safety failures.
Globally, however, the ILO’s ILOSTAT data shows that the number of work-related deaths increased by more than 12% from 2000 to 2019 — though this should be interpreted alongside a 28% increase in the global employed population over the same period, which means the rate per worker likely fell slightly. The absolute number rising nonetheless reflects rapid industrialisation in parts of Asia and Africa where safety regulatory capacity has not kept pace with economic growth. The ILO has identified a specific pattern: industries are being set up in developing countries — often informal and dangerous ones, engaging workers without previous industrial experience — faster than adequate housing, safety infrastructure, and regulatory oversight can be established.
The path to safer workplaces is well-understood from the experience of countries that have achieved it: independent safety regulatory agencies with genuine enforcement power; inspectors with sufficient numbers and authority; penalties for violations large enough to deter risk-taking; worker representation in safety committees; systematic accident investigation and reporting; and a legal framework that holds employers accountable when workers die preventably. None of this is technologically complex. It is politically and economically complex — it requires governments to prioritise worker safety over employer compliance costs, and international buyers of goods to take responsibility for the conditions under which their products are made. The Rana Plaza collapse in Bangladesh in 2013 — which killed 1,134 garment workers in a building that safety inspectors had warned was unsafe — remains the defining example of what happens when those priorities are misaligned.
- US BLS — Census of Fatal Occupational Injuries 2023 (USDL-24-2564 · primary · directly fetched · December 19, 2024 · 5,283 total · all 4 tables · industry/occupation/event breakdowns · demographic data · rate 3.5/100K)
- US BLS — Census of Fatal Occupational Injuries Summary 2024 (primary · February 19, 2026 · construction 1,032 · transport incidents 1,937 · falls 844 · violent acts 733 · homicides 470)
- SmartQHSE — “HSE Statistics 2026: Global Deaths, LTIFR + LTIFR by Industry” (April 2026 · ILO 2023 basis · 2.78M deaths · construction 30%/7% · “one death every 15 seconds” · UK HSE data · OSHA data compiled)
- UN Global Compact — Occupational Safety and Health (ILO basis · 65% mortality in Asia · Africa 11.8% · Americas 10.9% · Africa/Asia 4-5× European rates · manufacturing/construction/transport highest)
- ILOSTAT — “The right to occupational safety and health: Still unrealized” (ILO primary · 89% from diseases · 330,000 accidents · WHO/ILO joint estimates · 745,000 deaths from overwork · 450,000 from particulates · 12% increase 2000-2019)
- Arinite — “The World’s Most Dangerous Countries for Workers” (ILO data basis · Bhutan 31.9/100K · Timor-Leste 29.2 · Iceland/Malta/San Marino ~0 · methodology: ILO data + National Safety Council global trends)
- Elrod Pope — “Most Dangerous Jobs in the US according to OSHA” (January 2026 · BLS-sourced · logging 98.9 · fishing 86.9 · roofers 51.8 · refuse 41.4 · pilots 31.3 · grounds 20.5 · agriculture 20.2 · steel 19.8 · all per BLS CFOI 2023)
- Statista/ILO — “A Global Snapshot of Workplace Safety” (February 20, 2026 · ILO basis · Costa Rica 9.7 · Colombia 6.5-11.5 · US 3.5 · Canada 5.7 · US “among worst Western world” · France + Portugal alongside US)
- YouFactors — “Fatal Accidents at Work by Industry” (ILO/BLS basis · Asia ~13/100K · Europe ~3/100K · US farmers/fishers/forestry 24.4 · construction 12.9 · UK HSE 2023/24 · Eurostat data)
- Briefly.co.za — “11 Most Dangerous Jobs in the World” (June 2025 · ILO/CDC/BLS/WHO basis · agriculture 11.26/100K global · 1/3 fatal injuries in agriculture · Guadeloupe 58.21/100K agriculture · logging 98.9 · nuclear safest <1/100K)