The Rise of the Global South —
The New Economic Power Map
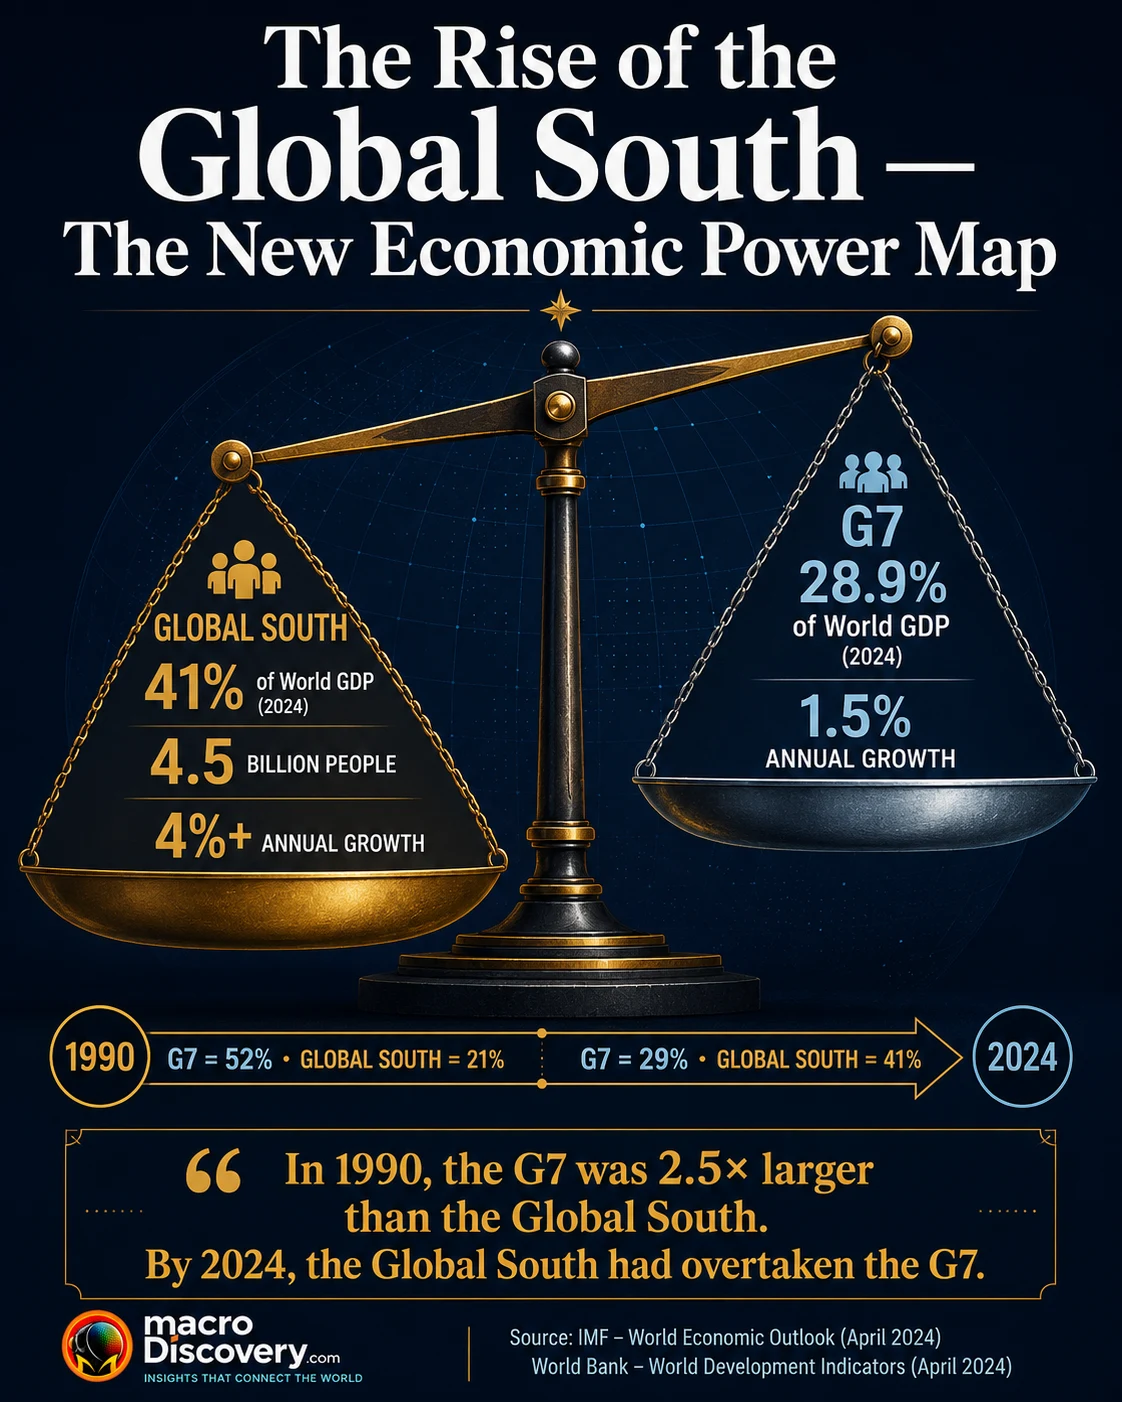
In 2000, the Global South accounted for just 21% of world GDP measured by purchasing power parity. By 2024, that share had risen to 41%. The BRICS group of major emerging economies now outweighs the G7 in the same measure. India is the world’s fastest-growing major economy. South-South trade — countries of the Global South trading with each other — more than doubled to $5.6 trillion between 2007 and 2023. The most consequential economic shift of the 21st century is not a single event. It is a slow, compounding redistribution of the world’s economic weight.
- The Global South’s share of world GDP at purchasing power parity rose from 21% in 2000 to 41% in 2024 — a doubling in economic weight in a single generation. This is the broadest and most important number in the story. It reflects two decades of faster growth in emerging economies compounding into a structural redistribution of global economic output. The IMF projects this share will reach nearly 44% by 2029 even without any acceleration in the current trajectory.
- The BRICS group now outweighs the G7 in purchasing power parity terms. BRICS 10 (the ten full members as of 2025) accounts for 39.2% of world GDP by PPP versus the G7’s 28.9%, according to 2024 IMF data. The G7 represented approximately 52% of world GDP by PPP in 1990. The reversal took about 35 years and compounded from slower but persistent growth differentials between emerging and advanced economies — not from any single shock.
- Emerging market and developing economies (EMDEs) grow at approximately 4% per year versus 1.5% for advanced economies, according to the IMF’s World Economic Outlook of October 2025 (primary, directly confirmed). This 2.5 percentage point annual gap, sustained over decades, produces the power shift visible in the data. The IMF’s 2025 Chapter 2 research found that this resilience reflects genuine policy improvements in monetary and fiscal frameworks — not just commodity price luck.
- India is the world’s fastest-growing major economy at 6.48% in 2026 (IMF WEO April 2026), with a nominal GDP of approximately $4.15 trillion ranking it sixth globally — but third globally by purchasing power parity. India is projected to overtake Japan and the UK in nominal terms by 2027 and become the world’s third-largest economy by 2031. Its fiscal year growth for 2025-26 was revised upward to 7.6% by India’s own statistical agency.
- South-South trade — trade between Global South countries — more than doubled from $2.3 trillion in 2007 to $5.6 trillion in 2023, according to UNCTAD data. This reflects decreasing dependence on traditional Western trade partners and the emergence of new trade relationships across Asia, Africa, and Latin America. The most important single relationship is China-to-Global South: China’s non-financial outbound direct investment reached $143.85 billion in 2024 (+10.5% year-on-year), much of it directed into Global South infrastructure and manufacturing.
Sources: CKGSB Research (November 2025) citing IMF data — “Global South GDP share (PPP): 21.02% (2000) → 41.23% (2024) → projected 43.71% by 2029.” IMF WEO October 2025 (primary, directly confirmed) — EMDEs growing “just above 4%” vs AEs “around 1.5%”. 1990 G7 share (~52%) from RBC Wealth Management (October 2025) citing IMF. 2010 and 2019 figures are approximate interpolations from multiple IMF-based sources. “Global South” / EMDEs defined as in IMF World Economic Outlook classification. Bar lengths represent Global South share of world GDP at PPP.
Joined 2024: Egypt 🇪🇬 · Ethiopia 🇪🇹 · Iran 🇮🇷 · UAE 🇦🇪
Joined 2025: Indonesia 🇮🇩 (full member January 6, 2025)
Note: Saudi Arabia listed on BRICS website as member from Jan 2025; status disputed by unnamed sources per Wikipedia.
Vietnam 🇻🇳 joined as partner June 2025
Russia FM Lavrov, May 2026: “Will not rush further expansion” — BRICS to consolidate before admitting more.
Sources: Wikipedia — BRICS (accessed July 2026, current) · Geopolitical Economy Report (February 2026) — BRICS 20: 43.93% GDP PPP, 4.45B population · EY India (August 2025) — BRICS+ 42.5% PPP / 28.9% nominal in 2024 · RBC Wealth Management (October 2025) — BRICS 10: 39.2% vs G7: 28.9% · brics.br (primary) — 17th BRICS Summit Rio de Janeiro July 6-7, 2025 · theme “Strengthening Global South Cooperation for More Inclusive and Sustainable Governance.”
| Country | Nominal GDP 2026 | GDP Growth 2025 | Global Role | Trajectory | Growth |
|---|---|---|---|---|---|
| 🇨🇳 ChinaWorld’s largest economy by PPP · 19.6% of world GDP PPP |
~$20.9T | ~4.0% | Global South Engine | World’s largest economy by PPP. Growth below earlier expectations (property slowdown). Still the primary engine of Global South expansion. 52% of BRICS+ GDP. | |
| 🇮🇳 India#6 nominal · #3 PPP · fastest-growing major economy |
~$4.15T | 6.48% | Rising Superpower | World’s fastest-growing major economy 2026. Projected #3 globally by 2031. FY2026 growth 7.6% (MoSPI). Lifts 135M out of poverty 2015-2019 (World Bank). $700B forex reserves. | |
| 🇧🇷 BrazilLatin America’s largest economy · world’s largest net food exporter |
~$2.3T | ~3.0% | Agricultural Giant | BRICS host 2025 (17th Summit Rio de Janeiro). World’s dominant food exporter. Fastest growing trade partner with China. Climate exposure = key risk. | |
| 🇮🇩 IndonesiaSE Asia’s largest economy · BRICS full member Jan 2025 |
~$1.5T | 4.7% | SE Asia Anchor | 280M people — 4th most populous. Joined BRICS January 6, 2025 as first SE Asian full member. Key manufacturing destination. “Hotspot for foreign capital” per EY. | |
| 🇷🇺 RussiaEnergy + wheat superpower · BRICS founding member |
~$2.1T | ~3.4% | Resource Power | World’s largest wheat exporter. Major energy supplier to Global South. Under Western sanctions; pivoting to South-South trade. 2024 Kazan BRICS Summit host. | |
| 🇪🇹 EthiopiaAfrica’s 2nd largest economy · fastest BRICS grower |
~$0.2T | 6.6% | Africa’s Fastest | Fastest GDP growth of any BRICS member in 2025 (IMF: 6.6%). Benefiting from infrastructure investment and BRI links. High debt risk. Joined BRICS 2024. | |
| 🇦🇪 UAEGlobal South hub for finance, logistics, talent |
~$0.7T | 4.0% | Gulf Connector | Joined BRICS 2024. Positioned as neutral hub between Global South and West. Top FDI destination for Global South capital. Talent magnet (GTCI 2025: #25). | |
| 🇻🇳 VietnamBRICS partner June 2025 · key manufacturing shift |
~$0.5T | ~6.5% | Supply Chain Star | Joined BRICS as partner June 2025. Major beneficiary of China+1 supply chain diversification. “Independent foreign policy” — refusing US pressure to exclude China. Fast grower. |
Sources: IMF World Economic Outlook April 2026 (primary) — India nominal GDP $4.15T, growth 6.48%. IMF WEO October 2025 (primary, directly confirmed) — global and EMDE growth rates. brics.br (primary) — Ethiopia 6.6%, Indonesia 4.7%, UAE 4.0%, BRICS GDP shares. Geopolitical Economy (February 2026) — Vietnam BRICS partner. RBC Wealth Management (October 2025) — BRICS vs G7 GDP PPP shares. World Bank — India 135M poverty reduction 2015-2019. Vietnam growth approximate from IMF data. Brazil, Russia GDP approximate from multiple IMF-based sources. Click column headers to sort.
What Has Actually Driven the Global South’s Economic Rise — Is It Real?
The numbers showing the Global South’s economic rise can seem almost too large to be real: from 21% of world GDP at purchasing power parity in 2000 to 41% in 2024 — a doubling of relative economic weight in a single generation. The sceptical question is worth asking directly: is this genuine economic development, or does it reflect accounting choices (PPP adjustments that artificially inflate developing country output) or the dominance of China so overwhelming that the rest of the Global South is barely moving?
Both caveats have merit. The IMF’s October 2025 World Economic Outlook — directly confirmed in its primary text — found that emerging market growth differentials reflect genuine policy improvements, not just commodity luck or measurement artefact. Chapter 2 of that report, titled “Emerging Market Resilience: Good Luck or Good Policies?”, concluded that improvements in monetary and fiscal policy frameworks across EMDEs played a critical role in their sustained outperformance. Countries that improved their central bank independence, reduced inflation, and built fiscal buffers were substantially better equipped to absorb the shocks of 2020-2025. This is not just China lifting average EMDE growth figures — it is a broader institutional improvement across dozens of countries that has underpinned faster growth and greater resilience.
The China caveat is real, however, and the article should be read with it in mind. China alone accounts for approximately 52% of BRICS+ combined GDP. Without China and India together, the EMDE growth picture is considerably more varied — many sub-Saharan African and low-income EMDEs face precisely the challenges the World Bank documented in its January 2025 Global Economic Prospects: high debt-service costs, falling FDI, and growth insufficient to catch up to advanced economy living standards. The Global South’s rise is real and structural — but it is not evenly distributed, and it has not yet closed the per-capita income gap that defines the most consequential dimension of global inequality.
How Did BRICS Overtake the G7 — and What Does That Actually Mean?
The G7 — the group of seven historically dominant advanced economies (United States, Germany, Japan, United Kingdom, France, Italy, Canada) — represented approximately 52% of world GDP measured at purchasing power parity in 1990, at the peak of its post-Cold War economic dominance. By 2024, the G7’s share had fallen to 28.9%. The BRICS 10 (the ten full BRICS members as of 2025) simultaneously rose to 39.2%, according to IMF data cited by RBC Wealth Management. By 2030, the IMF projects BRICS will reach 41.8% and the G7 will fall to 26.3%.
The crossover happened gradually — not through any single event but through three decades of differential growth compounding. The original five BRICS (Brazil, Russia, India, China, South Africa) overtook the G7 in PPP terms around 2019, having grown from representing only a fraction of G7 output in the 1990s. The subsequent 2024-2025 expansion of BRICS to include Egypt, Ethiopia, Iran, UAE, and Indonesia further widened the gap in simple aggregate terms — though the new members add population and geopolitical significance more than proportionate economic weight at current income levels.
What the BRICS-G7 crossover actually means in practice is contested. It does not mean that living standards in BRICS countries match G7 levels — they do not, by a wide margin. The EY India (2025) analysis noted that BRICS+ per capita GDP at PPP is approximately 0.8 times the global average, while the G7’s is approximately 3 times the global average. Aggregate GDP reflects the size of economies, not the prosperity of their citizens. What the shift does mean is that the economic decisions of BRICS governments — their industrial policies, trade relationships, currency choices, and development finance priorities — collectively affect the global economy at a scale comparable to or exceeding the G7. The age of Western unilateral economic management is structurally over.
2024 — G7: 28.9% · BRICS 10: 39.2%. The reversal is now decisive in PPP terms. China alone is the world’s largest economy by PPP. India is third. The G7 share has nearly halved in 34 years.
2030 projection — G7: ~26.3% · BRICS: ~41.8%. The IMF’s baseline projection, absent major shocks, shows the divergence continuing to widen. By 2030, BRICS will likely represent more than 15 percentage points more of world output than the G7.
Source: IMF data via RBC Wealth Management (October 2025) · EY India (August 2025).
Why Is India the Most Important Country to Watch in the Global South?
Among all the economies of the Global South, India presents the most consequential combination of scale, speed, and structural trajectory. Its nominal GDP of approximately $4.15 trillion in 2026 (IMF WEO April 2026) makes it the sixth-largest economy in the world. Its GDP growth rate of 6.48% (calendar year 2026, IMF) or 7.6% (fiscal year 2025-26, India’s own MoSPI) makes it the fastest-growing major economy on earth. And by purchasing power parity, it is already the world’s third-largest economy — behind only China and the United States.
India’s nominal ranking slightly declined in 2026 for technical reasons — a revision to the GDP base year reduced estimates in dollar terms, and rupee depreciation against the dollar amplified the effect. These are measurement adjustments, not underlying economic deteriorations. The IMF projects India will overtake Japan and the UK in nominal terms by 2027 and become the world’s third-largest economy by nominal GDP by 2031. At its current pace it adds approximately $300-400 billion to its nominal GDP annually — roughly equivalent to adding a new country the size of Denmark each year. What makes India’s trajectory different from China’s earlier rise is that India is doing it in the context of democracy, rule of law, and with a demographic dividend — a young and growing workforce — that China no longer has.
India’s structural drivers are real and multiple: a services export engine centred on IT and financial services that generates foreign exchange and middle-class income; massive government infrastructure investment (₹11 lakh crore capital expenditure in the 2024-25 budget); a Production-Linked Incentive (PLI) scheme channelling investment into manufacturing; and approximately 135 million people lifted out of poverty between 2015 and 2019 (World Bank) who are now entering consumption. India’s US trade deal of February 2026 — reducing reciprocal tariffs from 25% to 18% — added a modest growth tailwind and supported the rupee. For any investor or policymaker trying to understand where global economic growth will come from in the 2030s, India is the answer most frequently supported by the data.
What Is South-South Trade — and Why Does Its Doubling Matter?
South-South trade — commerce between Global South countries, bypassing the traditional hub-and-spoke model in which developing nations exported raw materials to the West and imported finished goods — grew from $2.3 trillion in 2007 to $5.6 trillion in 2023, according to UNCTAD data. This more-than-doubling over 16 years represents one of the most significant structural changes in global trade architecture of the past generation. It reflects not just larger Global South economies buying more from each other, but the emergence of genuine Global South supply chains, technology transfers, and investment flows that do not require Western intermediation.
The centrepiece of South-South trade is China’s relationship with the rest of the Global South. China’s non-financial outbound direct investment reached $143.85 billion in 2024 (+10.5% year-on-year), with Latin America and ASEAN recording the largest increases. The fastest-growing individual country recipients included Brazil, Vietnam, and Indonesia. China’s Belt and Road Initiative now connects more than 150 countries through trade corridors, energy infrastructure, port facilities, and digital infrastructure including fiber-optic networks and satellite systems. From its own description, it is transitioning from the world’s manufacturer to what CKGSB research calls “the brain of the South” — exporting technological and industrial capabilities alongside physical goods.
The geopolitical implication of South-South trade growth is that the Global South increasingly has an economic alternative to Western trade relationships. When Western governments apply sanctions, impose tariffs, or attach conditions to development finance, the Global South now has enough internal trade volume and Chinese investment supply to sustain economic activity without full Western participation. This does not mean the Global South is decoupling from the West — US-China trade remains enormous, and Western consumption demand drives most Global South export growth. But the asymmetry has changed: the Global South’s negotiating position is stronger when it has genuine alternatives, and South-South trade provides those alternatives.
What Are the Limits and Risks in the Global South’s Rise?
The story of the Global South’s economic rise has genuine limits that an honest reading of the data requires acknowledging. The most important is the per-capita income gap. Despite the Global South accounting for 41% of world GDP at PPP in 2024, the per-capita GDP of BRICS+ members averages approximately 0.8 times the global average — versus the G7’s 3 times the global average. This means the average person in a BRICS+ country earns roughly one-quarter of the income of the average person in a G7 country. Economic weight at the aggregate level does not translate automatically into prosperity at the individual level, and the gap between aggregate GDP share and per-capita living standards is the most consequential limitation of the “rise” narrative.
The World Bank’s January 2025 Global Economic Prospects report introduced a second significant caveat: the pace at which EMDEs are catching up to advanced-economy per-capita income levels is expected to slow in many regions compared with the pre-pandemic period. Sub-Saharan Africa — home to the world’s fastest-growing young population — is particularly at risk of falling further behind, as high debt-service costs, climate shocks, and political instability constrain investment and productivity growth. The Global South’s rise is not uniform: it is primarily an Asian story, concentrated in China, India, and Southeast Asia, with Africa and much of Latin America progressing much more slowly.
Debt is the third structural risk. The World Bank found that since 2010, rising EMDE debt has been associated with increases in sovereign spreads of approximately 110 basis points — a significant premium on borrowing costs that crowds out productive investment. Countries with prior default histories, weak governance, or low credit ratings face even sharper penalties. The same economic growth that has lifted Global South countries relative to the West has also, in many cases, been financed by debt that must eventually be serviced. How this plays out in the 2030s — as climate adaptation costs mount, populations age, and global interest rates normalise — will be the defining test of whether the Global South’s rise is durable or fragile.
- IMF — World Economic Outlook October 2025 (primary · directly fetched · global growth 3.3%→3.2%→3.1% · AEs ~1.5% · EMDEs just above 4% · Chapter 2: EMDE resilience = policy improvements · tariff risks)
- Statistics of the World — “India Economy 2026” (IMF WEO April 2026 basis · India $4.15T nominal · #6 · 6.5% growth · #3 PPP · FY2026 7.6% MoSPI · overtake Japan/UK 2027 · #3 by 2031)
- CKGSB Research — “China and the Rise of the Global South Economy in 2025” (November 2025 · IMF data · Global South PPP: 21.02% (2000) → 41.23% (2024) → 43.71% by 2029 · China ODI $143.85B 2024 · South-South trade)
- RBC Wealth Management — “How BRICS Sees the World” (October 2025 · IMF basis · BRICS 10 = 39.2% vs G7 = 28.9% (2024) · G7 1990 ~52% · 2030 projection BRICS 41.8% vs G7 26.3% · no single BRICS currency)
- EY India — “BRICS+ 2025 Growth and Trade Promoting Initiatives” (August 2025 · BRICS+ 42.5% PPP / 28.9% nominal in 2024 · per capita PPP 0.8× global avg vs G7 3× · merchandise exports BRICS+ 12.9%→27.3% 2000-2024 · BRICS 50%+ by 2030 projection)
- Geopolitical Economy — “BRICS 20: 44% of world GDP, 56% population” (February 2026 · Vietnam joins June 2025 · BRICS 20 = 43.93% GDP PPP · 4.45B population · IMF data basis)
- CGTN / China Diplomacy — “From BRICS to BRICS+: Implications for the Global South” (July 2025 · South-South trade $2.3T (2007) → $5.6T (2023) UNCTAD data · BRICS 17th Summit Rio · FDI inflows doubled)
- Wikipedia — BRICS (accessed July 2026 · current membership · Saudi Arabia status ambiguity · Lavrov May 2026 statement · Indonesia Jan 2025 · Vietnam June 2025 · G7 share 1990 decline · intra-BRICS trade $614.8B 2022)
- brics.br (official) — “BRICS GDP outperforms global average, accounts for 40% of world economy” (IMF April 2025 basis · Ethiopia 6.6% · India 6.2% · Indonesia 4.7% · UAE 4% · China 4% · 2025 IMF WEO)
- World Bank — Global Economic Prospects January 2025 (primary · EMDE per capita catch-up slowing · debt risk · SSA challenges · AI upside/downside · fiscal vulnerabilities)