
The Housing Crisis —
Why Nobody Can Afford to Buy Anymore
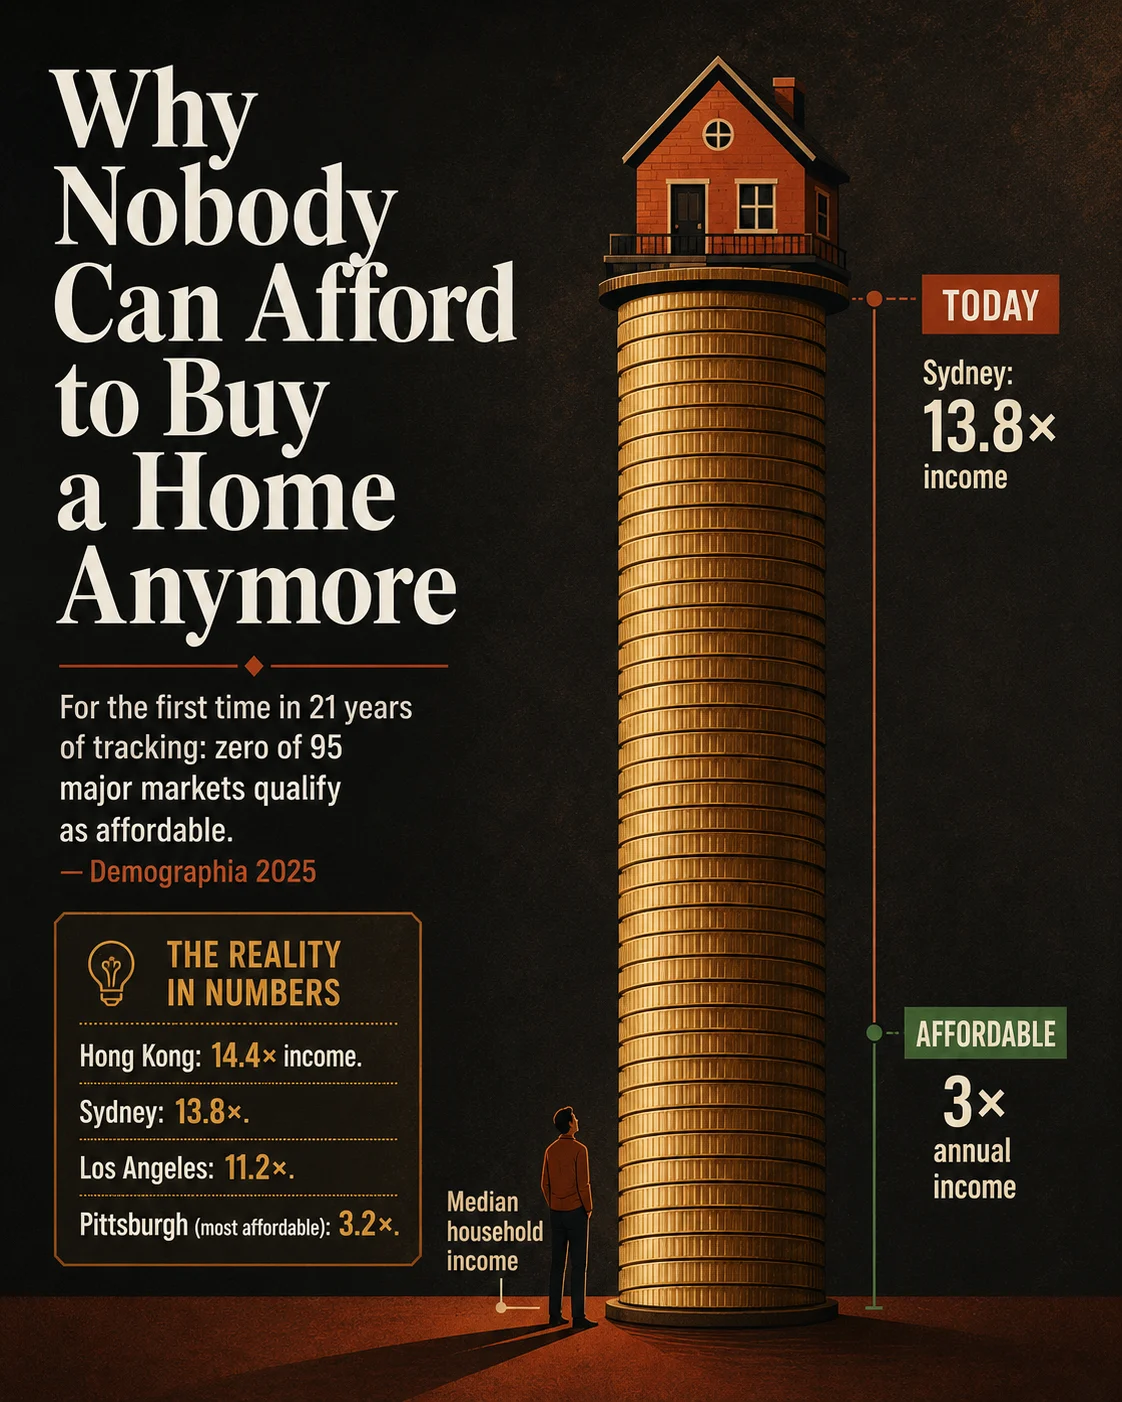
For the first time in 21 years of tracking, not one of 95 major housing markets qualifies as affordable. Hong Kong costs 14 years of household income. Sydney costs nearly 14. Los Angeles costs 11. The US has a shortfall of 4 million homes. And housing is now less affordable than it was during the bubble that caused the 2008 financial crisis. Here is what the data actually shows about how the world stopped being able to buy its own shelter.
- Zero of 95 major housing markets are now affordable — the first time in the 21-year history of the Demographia International Housing Affordability Survey that every single tracked market falls into the unaffordable range. Hong Kong tops the list at 14.4 times household income, followed by Sydney at 13.8 and Vancouver at 11.8. Even the most affordable major market — Pittsburgh, Pennsylvania — requires 3.2 years of household income to purchase, just above the “affordable” threshold.
- Housing is now less affordable than it was during the 2007-08 housing bubble that triggered the global financial crisis. The IMF-BIS Housing Affordability Index for the US plunged from approximately 150 in 2021 to the mid-80s by 2024. A reading above 100 means a household can afford a typical mortgage; the US is now well below that threshold. The UK fell from 105 to the low 70s over the same period.
- The housing crisis is primarily a supply crisis, not a demand crisis. The US ran a housing supply deficit of 4.03 million homes in 2025. Construction of starter homes (under 1,400 sq ft) collapsed from 35% of new homes in 1976 to 7% in 2020. OECD data shows housing investment suffered multiple negative shocks — the GFC, COVID, and energy cost rises — that were never fully reversed. Even a 50% increase in US construction pace would take approximately 7 years to close the gap.
- The generational divide is the sharpest dimension of the crisis. 60% of OECD survey respondents aged 18-39 worry about housing affordability, versus 38% of those aged 55-64. In the US, 1.82 million millennial and Gen Z households have been “delayed” — unable to form independent households because housing costs are too high. Housing has become the primary mechanism by which wealth is transferred across generations rather than created within them.
- The root cause is restriction of land supply, not shortage of money or people. The Demographia report — the most comprehensive English-speaking housing study in the world — consistently finds that markets with the worst affordability share one characteristic: restrictive land-use regulation (urban growth boundaries, greenbelt policies, zoning restrictions) that prevents housing supply from expanding at the periphery. Markets where land supply is genuinely flexible tend to remain affordable even as they grow.
Source: Demographia International Housing Affordability 2025 Edition (Chapman University Center for Demographics and Policy / Frontier Centre for Public Policy · May 14, 2025 · data Q3 2024). Median Multiple = median house price ÷ median household income. “Affordable” = 3.0 or below. 95 markets across 8 nations: Australia, Canada, China (Hong Kong), Ireland, New Zealand, Singapore, UK, US.
| # | City | Median Multiple | Rating | What it means | Severity |
|---|---|---|---|---|---|
| 1 | 🇭🇰 Hong KongChina (SAR) |
14.4× | Impossibly Unaffordable | A median-income household would need 14.4 years of total income (saving 100%) to buy the median home. Land supply structural constraint; global capital demand. | |
| 2 | 🇦🇺 SydneyAustralia |
13.8× | Impossibly Unaffordable | Australia dominates the unaffordable rankings. Sydney’s greenbelt and urban containment policies are primary drivers cited by Demographia. | |
| 3 | 🇺🇸 San Jose, CAUnited States |
12.1× | Impossibly Unaffordable | Silicon Valley tech wealth combines with geographic constraints and restrictive zoning. High incomes haven’t kept pace with home price gains. | |
| 4 | 🇨🇦 Vancouver, BCCanada |
11.8× | Impossibly Unaffordable | Mountain/ocean geography plus high immigration rates and foreign capital demand. Urban containment policies limit peripheral expansion. | |
| 5 | 🇺🇸 Los Angeles, CAUnited States |
11.2× | Impossibly Unaffordable | Pacific coast geography, severe zoning restrictions, persistent demand. Middle-class homeownership now effectively impossible for most new entrants. | |
| 6 | 🇦🇺 AdelaideAustralia |
10.9× | Impossibly Unaffordable | Historically more affordable than Sydney and Melbourne; surged post-COVID as remote workers relocated and supply remained constrained. | |
| 7 | 🇺🇸 Honolulu, HIUnited States |
10.8× | Impossibly Unaffordable | Island geography creates absolute land scarcity. Military, tourism, and mainland migration demand compete with limited residential supply. | |
| 8 | 🇺🇸 San Francisco, CAUnited States |
10.0× | Impossibly Unaffordable | Peninsula geography, aggressive local zoning, landmark protections, and sustained tech demand. Has fallen slightly from recent peaks as remote work reduced pressure. | |
| 9 | 🇦🇺 MelbourneAustralia |
9.7× | Impossibly Unaffordable | Australia’s second-largest city. Urban growth boundary limits supply. Post-pandemic recovery drove prices above pre-crisis highs. | |
| 10 | 🇺🇸 San Diego, CAUnited States |
9.5× | Impossibly Unaffordable | Military-heavy coastal city. Geographic constraints (ocean/Mexico border/mountains) limit land. Military relocation demand from across the US. | |
| ★1 | 🇺🇸 Pittsburgh, PAUnited States · Most affordable |
3.2× | Moderately Unaffordable | Most affordable major market for 5th consecutive year. Legacy rust-belt city with flexible land supply, lower demand, and diversifying economy. Even this is above the “affordable” threshold. |
Source: Demographia International Housing Affordability 2025 Edition (primary — Chapman University / Frontier Centre for Public Policy · May 14, 2025 · directly confirmed · data Q3 2024 · 95 markets · 8 nations). Median Multiple = median house price ÷ median household income. All 12 “impossibly unaffordable” markets have a Median Multiple of 9.0 or above. Note: the “affordable” threshold (≤3.0) was reached by zero markets in 2025 for the first time in the survey’s 21-year history. Click column headers to sort.
| Country | PTI Change 2014–2023 | 2025 PTI Index | Direction | Key driver |
|---|---|---|---|---|
| 🇵🇹 Portugal | +53.1 pp | 130+ | ↑ Still rising | Tourism, golden visa investment, urban migration to Lisbon and Porto |
| 🇨🇦 Canada | +40.8 pp | 130+ | ↑ Still rising | Immigration surge (avg 500K new residents/yr), supply constraints, foreign capital |
| 🇺🇸 United States | +31.4 pp | High | ↑ Still rising | Decade of underbuilding, zoning restrictions, COVID price surge, rate hikes |
| 🇦🇹 Austria | +29.5 pp | High | ↓ Improving | Vienna demand plus limited supply; incomes now catching up in 2023-24 |
| 🇳🇱 Netherlands | +29.0 pp | 130+ | ↑ Still rising | Dense geography, Amsterdam demand, restricted land for new construction |
| 🇩🇪 Germany | +High | Below avg | ↓ 18.3 pp improved | Prices fell 2022-23 as rates rose; incomes grew faster; affordability recovering |
| 🇫🇷 France | Moderate | Below avg | ↓ 14.4 pp improved | Price correction since 2022 rate hikes; modest recovery in incomes |
| 🇰🇷 South Korea | −17.9 pp | Improved | ↓ Improving | Incomes grew ~48% vs house prices +14% over the decade; policy response effective |
| OECD Average | +17.8 pp | 114.7 | Mixed | Prices up 37% in real terms past decade; 33/36 improved in 2023-H1 2024 but structural gap remains |
Source: OECD Analytical House Price Database (accessed July 2025) · Statista citing OECD (OECD average PTI index 114.7 in 2025, 2015=100) · CDP Center analysis based on Eurostat/OECD data (country-level PTI pp changes). PTI index 2015=100; 114.7 means house prices are 14.7% higher relative to incomes than in 2015. The 2023-H1 2024 improvement noted for most countries reflects incomes catching up after the inflationary period — not a structural solution to the affordability crisis.
How Did Housing Go From Affordable to Impossible in One Generation?
The story of housing affordability in most rich countries is a story of two eras separated by a single policy failure: the decision, made city by city over decades, to restrict the supply of land for new housing. For most of the twentieth century, cities grew by expanding outward — new suburbs, new towns on the periphery, new subdivisions on the edge of the existing urban fabric. This expansion kept land costs manageable, and the Demographia survey’s historical data shows that markets with flexible land supply consistently maintained median multiples of 3.0 or below, even through periods of strong population growth.
From the 1970s onward, a wave of land-use regulation swept across the English-speaking world and beyond. Urban growth boundaries in Oregon and Washington. Green belts in the UK that ring cities with land that cannot be developed. Upzoning restrictions in Australian cities. Heritage protections in New Zealand. Each policy, individually, had plausible environmental or aesthetic justifications. Collectively, they reduced the elasticity of housing supply — the ability of construction to respond to demand — and ensured that any surge in population or income translated directly into rising prices rather than rising construction. By the time the pandemic hit in 2020 and brought a surge in demand for more space, the structural constraint had been accumulating for forty years.
The pandemic then delivered the largest single affordability shock in a generation: prices surged in 2020 and 2021 in an unprecedented break from historical recession patterns (housing markets had always weakened in previous downturns, not strengthened). When central banks subsequently raised rates to combat inflation in 2022-2023, they did not deflate house prices — they simply added a mortgage rate burden on top of already-elevated prices, compressing affordability from two directions simultaneously. The IMF’s Housing Affordability Index reached levels below the 2007-08 housing bubble in both the US and UK by 2024.
Why Is Australia the Most Systematically Unaffordable Housing Market in the World?
No single country dominates the Demographia unaffordability rankings as comprehensively as Australia. Four of the ten least affordable markets on earth are Australian cities: Sydney (#2 at 13.8), Adelaide (#6 at 10.9), Melbourne (#9 at 9.7), and Brisbane just outside the top ten. Perth, while lower, is still classified as severely unaffordable. A country of 26 million people, with one of the world’s most abundant supplies of land, has managed to make its cities among the least affordable on earth.
The mechanism is well-documented. Australian cities have consistently applied urban growth boundaries and density restrictions that prevent residential development from expanding at the periphery, where land is cheapest. The result is that land values spike dramatically at the boundary — Demographia research cites studies finding land prices 8 to 20 times higher just inside versus just outside regulatory boundaries. Population growth from immigration has been strong, but construction has not kept pace. Investor tax incentives (negative gearing and capital gains tax concessions) have channeled capital toward existing properties rather than new construction, amplifying demand for existing stock without creating new supply.
The contrast with the US is instructive. California cities like Los Angeles and San Francisco are similarly unaffordable, for similar reasons — restrictive zoning, geographic constraints, and high demand. But US cities in states without urban containment policies — Texas, Tennessee, Ohio, Pennsylvania — remain far more affordable. Pittsburgh’s 3.2 median multiple and Houston’s relative affordability compared to San Francisco’s 10.0 illustrate the same principle: where land is freely available for development, housing remains within reach of median incomes.
Is the Housing Crisis a Buying Problem or a Renting Problem — or Both?
An important nuance in the data: in most OECD countries, the housing crisis is primarily a homeownership crisis, not a rental crisis. The OECD’s Affordable Housing Database, updated July 2025, found that real rent prices actually declined on average in 28 countries between 2019 and 2024. Estonia and Latvia saw the largest declines, of around 17 and 15 index points respectively. In most of Continental Europe, rents fell in real terms as inflation was outpaced by nominal rent stagnation. Only Ireland and Slovenia recorded significant real rent price growth over this period.
This divergence between buying and renting has a mechanical explanation. When interest rates rise sharply — as they did in 2022-2023 — the cost of owning a home with a mortgage rises, but rental prices respond to a different market dynamic: the supply of rental units versus renters. In many countries, the same rate hikes that crushed homeownership affordability actually shifted more people into renting (because they could not afford to buy), increasing demand in the rental market — but not enough to fully offset the income gains that kept real rents from rising.
However, this is not a universal pattern and not a comfort. Ireland, where both buying and renting have become severely expensive, shows what happens when housing supply is constrained across all tenure types. Sub-Saharan Africa presents a different dynamic entirely: the UN and DevelopmentAid data show households spending 43.5% of income on shelter — a figure that reflects not high house prices but low incomes relative to even basic housing costs, often in informal settlements without legal title. The global housing crisis has multiple faces: the unaffordable mortgage in Sydney, the unaffordable rent in Dublin, and the inadequate shelter in Nairobi are related only by the common failure to build enough housing where people need to live.
Who Is Bearing the Brunt — and What Is the Generational Cost?
The housing crisis is not distributed evenly across society. It falls hardest on those who do not yet own — and most of those are young. An OECD survey cited in the IMF’s December 2024 analysis found that 60% of respondents aged 18-39 worried about housing affordability, compared with 38% of those aged 55-64. The generation gap was widest in Ireland, Canada, and the United States — the three countries where the mismatch between house prices and younger household incomes has become most acute. In Ireland, house prices more than doubled in under a decade while wages grew at a fraction of that pace.
In the United States, the scale of the generational displacement is quantifiable. Realtor.com’s 2026 Housing Supply Gap Report found that approximately 1.82 million millennial and Gen Z households are “missing” — they have delayed forming independent households, continuing to live with parents or in shared accommodation, because the housing market has priced them out of their own homes. These are not people who have chosen not to buy; they are people for whom the option has been removed. At current trajectories, this generation will build substantially less housing wealth than their parents did — and since housing wealth is the primary mechanism through which most middle-class families accumulate capital, the long-term inequality implications are profound.
Joel Kotkin, Director of the Center for Demographics and Policy at Chapman University, describing the Demographia 2025 findings, said “Middle-income homeownership is increasingly out of reach in major urban centers. The consequences for generational equity, upward mobility, and regional economies are profound.” High housing prices, relative to incomes, have what the report calls a “feudalising” impact — a society where those who inherited or already own property accumulate wealth through it, while those who do not are permanently excluded from the asset class that has historically been the foundation of middle-class prosperity.
What Would Actually Fix the Housing Crisis — and Is Any Country Doing It?
The Demographia survey and the broader academic literature point to a consistent answer: housing supply must be liberalised. Where land can be developed, housing gets built; where building is permitted at higher densities, more units emerge per acre; where planning approval is fast and predictable, developers respond to demand signals. The countries and cities that have avoided the worst outcomes share one feature — they allow housing to be built where people want to live, at the density and scale that demand requires.
New Zealand is the case study the Demographia 2025 report cites most prominently as a hopeful path forward. Recognising that the crisis is rooted in high land costs driven by supply restriction, New Zealand undertook significant planning liberalisation from 2021 onward — removing single-family-only zoning in major cities, allowing intensification, and streamlining development approvals. It is early, and results take years to materialise in market prices, but New Zealand’s reform represents the clearest national-scale experiment in supply-side housing policy in the English-speaking world.
The OECD’s July 2026 report on affordable housing identified the same structural need: more supply of both market and social housing. Social rental housing has declined as a percentage of total housing stock since 2010 in all but three OECD countries — meaning the safety net for those who cannot afford market-rate housing has been shrinking at precisely the moment the market itself has become most unaffordable. Germany and France, where affordability improved most in 2023-2024 (18.3 and 14.4 percentage points respectively), demonstrate that correction is possible — but it came primarily from falling real house prices after rate hikes, not from supply-side reform. Waiting for price corrections is not a policy. Building homes is.
- Chapman University / GlobeNewswire — Demographia International Housing Affordability 2025 (primary press release · May 14, 2025 · directly fetched · full top-10 rankings · market distribution · 21-year first · Joel Kotkin quote)
- Demographia International Housing Affordability 2025 Edition (full PDF · Chapman University Center for Demographics and Policy · Frontier Centre for Public Policy · data Q3 2024 · 95 markets · 8 nations)
- IMF Finance & Development — “The Housing Affordability Crunch” (December 2024 · Deniz Igan, BIS · US HAI 150→mid-80s · UK 105→70s · worse than 2008 bubble · 60% young worried · mortgage rates 25% of moves)
- IMF Finance & Development — “Housing Costs Mount” (December 2024 · OECD: 37% real price rise past decade · 16% above incomes · intergenerational gap Ireland/Canada/US)
- OECD Affordable Housing Database — HM1.2 Housing Prices (July 2025 · real prices +60 index pts 3 decades · rent declines 28 countries 2019-24 · country-specific PTI scenarios)
- OECD — “Tackling the Affordability Gap Through Increased Supply” (July 2026 · social rental housing declining in all but 3 OECD countries · housing investment negative shocks · supply-side policy needed)
- Realtor.com / PR Newswire — 2026 Housing Supply Gap Report (March 2026 · US gap 4.03M · 1.82M missing young households · 7 years at +50% construction · Danielle Hale quote)
- Congress.gov (CRS) — “Estimates of a Housing Shortage” (December 2025 · Freddie Mac starter homes collapse 35%→7%→10% · NAR inventory analysis · US structural housing context)
- Statista — “House price-to-income ratio in selected countries 2025” (citing OECD · Portugal/Netherlands/Canada 130+ · OECD average 114.7 · 2015=100 base year)
- DevelopmentAid — “Housing crisis: countries at breaking point in 2025” (December 2025 · UN-Habitat: 1.6B with severe constraints · 100K homes/day needed · 31% income on shelter global · 43.5% Sub-Saharan Africa)












