AI Tech Gaming Future Automobile Top 10 Space Innovation Trending How To Reviews Discover

---Advertisement---

Ranked: The World’s 10 Largest Companies — 2000 vs. 2025

Macro Discovery
On: June 27, 2026 3:06 PM
Follow Us:
---Advertisement---
Ranked: The World's 10 Largest Companies — 2000 vs. 2025
Ranked: The World’s 10 Largest Companies — 2000 vs. 2025
The World’s 10 Largest Companies — 2000 vs. 2025 · MacroDiscovery
MacroDiscovery
Wealth & Markets · 4 min read · 2025 Data
NOW — Corporate Power · Market Cap · 2000 vs. 2025
Wealth & Markets

The World’s 10 Largest Companies —
2000 vs. 2025

In 2000, the most powerful companies on Earth were oil, telecoms, and banks. Twenty-five years later, seven of those ten companies no longer appear on the list. What replaced them — and why — is the most important structural shift in global capitalism in a century.

By MacroDiscovery
Sources: Bloomberg · Forbes · Visual Capitalist · S&P Global
Updated: 2025
7 of 10
Companies replaced since 2000
$3.8T
Apple market cap (2025 peak)
0
Oil majors in top 10, 2025
7 of 10
2025 top 10 are US companies
$500B
Largest company in 2000 (GE)
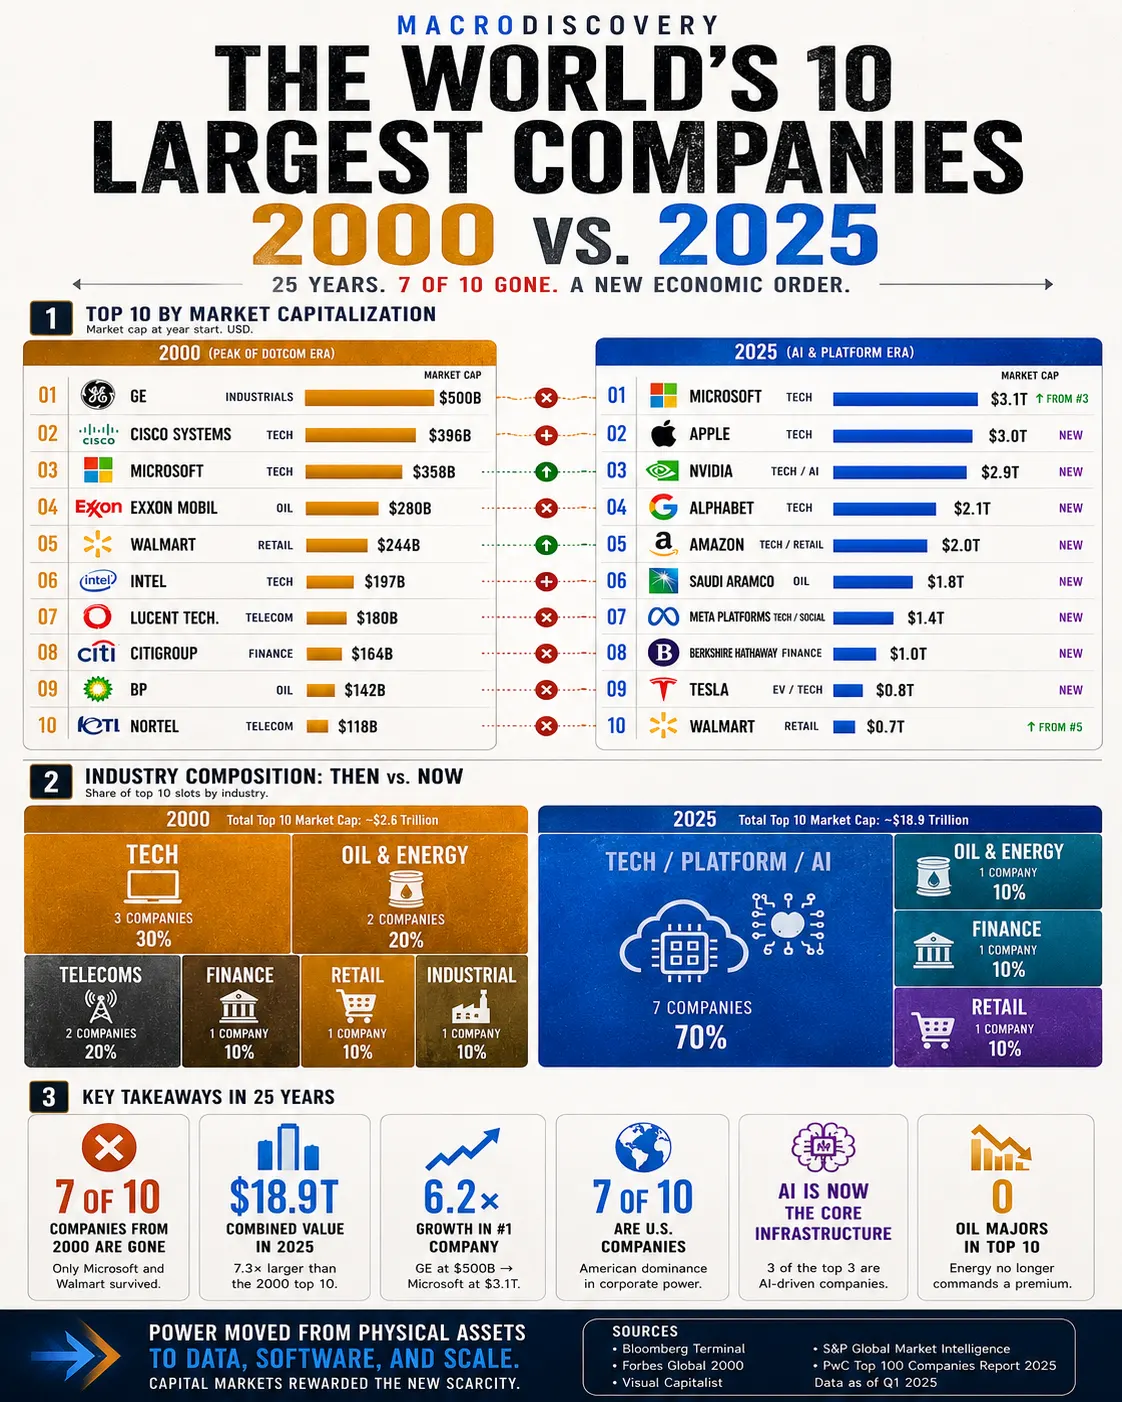
Visualization 01 — Head-to-Head Ranking
Top 10 by Market Capitalization — 2000 vs. 2025

Market cap at year start. 2000 figures in nominal USD. 2025 figures as of Q1 2025. Lines connect companies that appear in both lists. Sources: Bloomberg, Visual Capitalist, S&P Global.

2000 — PEAK OF DOTCOM ERA 2025 — AI & PLATFORM ERA 01 General Electric $500B Industrials 02 Cisco Systems $396B Tech 03 Microsoft $358B Tech 04 Exxon Mobil $280B Oil 05 Walmart $244B Retail 06 Intel $197B Tech 07 Lucent Tech. $180B Telecom 08 Citigroup $164B Finance 09 BP $142B Oil 10 Nortel $118B Telecom Microsoft $3.1T ↑ from #3 Tech Apple $3.0T NEW Tech NVIDIA $2.9T NEW Tech/AI Alphabet (Google) $2.1T NEW Tech Amazon $2.0T NEW Tech/Retail Saudi Aramco $1.8T NEW Oil Meta $1.4T NEW Tech Berkshire $1.0T NEW Finance Tesla $0.8T NEW EV/Tech Walmart $0.7T ↑ from #5 Retail LEGEND Survived (on both lists) NEW — not in 2000 top 10 GONE — fell off the list THE SCALE SHIFT GE at #1 in 2000: $500 billion Microsoft at #1 in 2025: $3.1 trillion → The top spot grew 6.2× in 25 years. The bar didn’t just move — it was rebuilt. Sources: Bloomberg, S&P Global, Visual Capitalist · Market cap at year start / Q1 2025
Visualization 02 — Industry Composition
Which Industries Held Power — Then vs. Now

Share of top 10 slots by industry. Size reflects number of companies in the top 10, not market cap weight.

2000 Total top-10 cap: ~$2.6T
Tech 3 companies
Oil & Energy 2 companies
Telecoms 2 companies
Finance 1 company
Retail 1 company
Industrial 1 company
2025 Total top-10 cap: ~$18.9T
Tech / Platform / AI 7 companies — Microsoft, Apple, NVIDIA, Alphabet, Amazon, Meta, Tesla
Oil 1 co.
Finance 1 co.
Retail 1 co.
Visualization 03 — The Biggest Movers
Who Rose, Who Fell, and Who Didn’t Exist Yet

The most dramatic individual company journeys across the 25-year period.

⬆ Biggest Rises
Microsoft #3 in 2000 → #1 in 2025 · $358B → $3.1T The only company to survive in the top 3. Revived by Satya Nadella’s cloud-first pivot after a lost decade. Azure and OpenAI bet now define its identity.
NVIDIA Not in top 10 in 2000 → #3 in 2025 · ~$8B → $2.9T A GPU gaming company that accidentally built the infrastructure the AI era required. No single company has gained more market cap faster in modern history.
Apple Not in top 10 in 2000 → #2 in 2025 · ~$15B → $3.0T Near bankruptcy in 1997. The iPhone, launched in 2007, rewrote the company’s identity from computer maker to the most profitable consumer hardware and services ecosystem ever built.
Walmart #5 in 2000 → #10 in 2025 · $244B → $700B One of only two survivors. Stayed relevant through e-commerce investment and supply chain scale. Its ability to survive the Amazon era intact is underrated.
⬇ Biggest Falls
General Electric #1 in 2000 → Not in top 100 by 2023 The most admired company on Earth in 2000. Undone by over-diversification into financial services and the 2008 crisis — GE Capital alone nearly sank the entire conglomerate.
Cisco Systems #2 in 2000 → Outside top 30 today The “internet backbone” play. When the dotcom bubble burst, Cisco shed 86% of its value in a year — one of the largest single-year wealth destructions in history.
Nortel Networks #10 in 2000 → Bankruptcy 2009 A cautionary tale in accounting fraud and overexpansion. Nortel filed for bankruptcy in 2009 with $7.3 billion in debt. Its patent portfolio was eventually sold to a consortium including Apple for $4.5 billion.
Exxon Mobil #4 in 2000 → Outside top 10 by 2025 Once the definition of enduring corporate power. The energy transition, ESG pressure, and the rise of electric vehicles structurally eroded the premium markets once placed on oil reserves.
Visualization 04 — 2025 Top 10 with 2000 Context
2025 Rankings — With Their 2000 Market Cap Shown

Amber bar = 2000 market cap (or nearest public value). Blue bar = 2025 market cap. Scaled relative to Microsoft’s $3.1T 2025 peak. Source: Bloomberg, S&P Global, Visual Capitalist 2025.

01
MicrosoftTechnology
’00
’25
$3.1T
02
AppleTechnology
’00
’25
$3.0T
03
NVIDIATech / AI Chips
’00
’25
$2.9T
04
AlphabetTechnology
’00
’25
$2.1T
05
AmazonTech / Retail / Cloud
’00
’25
$2.0T
06
Saudi AramcoOil & Gas
’00
’25
$1.8T
07
Meta PlatformsTechnology / Social
’00
’25
$1.4T
08
Berkshire HathawayFinance / Conglomerate
’00
’25
$1.0T
09
TeslaEV / Energy / Tech
’00
’25
$0.8T
10
WalmartRetail
’00
’25
$0.7T

The rewriting of the top 10 is not primarily a story about companies — it is a story about what kind of asset markets decided to value. In 2000, markets placed premium multiples on physical throughput: barrels of oil, network switching capacity, square footage of retail. The implicit bet was that the world’s scarce resources were physical ones — infrastructure, energy, distribution. Twenty-five years later, the scarce resource turned out to be attention, data, and software at scale. The companies that captured those things rewrote the list entirely.

The collapse of the telecom giants — Cisco, Lucent, Nortel — is the most instructive case. All three were legitimate infrastructure businesses with real revenue. What destroyed them was not competition but valuation mathematics: when the market assigned them peak dotcom multiples, any normalization was catastrophic. Nortel’s bankruptcy was compounded by accounting fraud, but even honest versions of these companies faced the same structural problem — the internet they helped build became commodity infrastructure, and commodity infrastructure does not command trillion-dollar valuations.

“The companies that dominated 2000 owned physical infrastructure. The companies that dominate 2025 own the software layer that runs on top of it — and software has near-zero marginal cost at scale.”

GE’s fall from the #1 position is the clearest signal of a deeper structural shift. Its 2000 valuation reflected the old logic of the diversified industrial conglomerate — a single management system applied across aviation, healthcare, power, and finance. That logic was shattered by the 2008 financial crisis, which exposed GE Capital as a systemic risk embedded inside an industrial company. The market has not re-rated diversified conglomerates since. Focus replaced breadth as the premium corporate strategy.

What is structurally significant about the 2025 list is not just that it is dominated by technology — it is that the technology companies are increasingly undifferentiated from each other in one crucial way: all of them now compete in AI. Microsoft, Apple, NVIDIA, Alphabet, Amazon, and Meta are all deploying capital at scale into models, infrastructure, or applications. The list has become a leaderboard of AI infrastructure investment, and the market is pricing the winner-take-most dynamics that AI economics implies.

Macro Takeaway — The Next 5–10 Years

The composition of the 2030 list will be determined largely by which AI bets pay off — and which companies successfully convert AI capability into defensible revenue. The current risk in the 2025 list is concentration: seven of ten companies are in technology, and all seven are making large, overlapping bets on the same infrastructure cycle. If AI monetization disappoints relative to infrastructure investment — as broadband disappointed relative to fiber build-out in 2000 — the list will be rewritten again, faster than expected.

The one company most likely to enter the top 10 by 2030 that does not currently appear is xAI or another frontier AI lab that successfully converts model capability into platform lock-in at scale. The one company most likely to fall out is Tesla, whose inclusion depends on the market continuing to value it as a technology company rather than an automotive one — a distinction that becomes harder to sustain as EV competition intensifies and its AI narrative requires more evidence.

Sources & Methodology
  • Bloomberg Terminal — Market capitalization data, historical and current 2025
  • S&P Global Market Intelligence — Top global companies by market cap, 2000 baseline
  • Visual Capitalist — “The 100 Largest Companies by Market Cap” (2000–2025 series)
  • Forbes Global 2000 — Annual rankings 2000–2025
  • Financial Times — “GE: The Rise and Fall of a Corporate Icon” 2021
  • SEC / EDGAR — Historical company filings, market cap at reporting dates
  • PwC Global Top 100 Companies — Market capitalization report Q1 2025
Macro Discovery

Sukh Dhaliwal

Sukh Dhaliwal is the founder of Macro Discovery, an independent digital publication covering AI, technology, science, future trends, and global innovation through visual storytelling and data-driven analysis.

Join WhatsApp

Join Now

Join Facebook

Follow us

Leave a Comment