Which G20 Members Grow Fastest
The G20 ranking for this decade is already in. Here is who grew.
A 2026 forecast is not the decade. India leads the year at 6.4% and the 2015–2025 real gain at 77%. Turkey is on only one list.
Three numbers
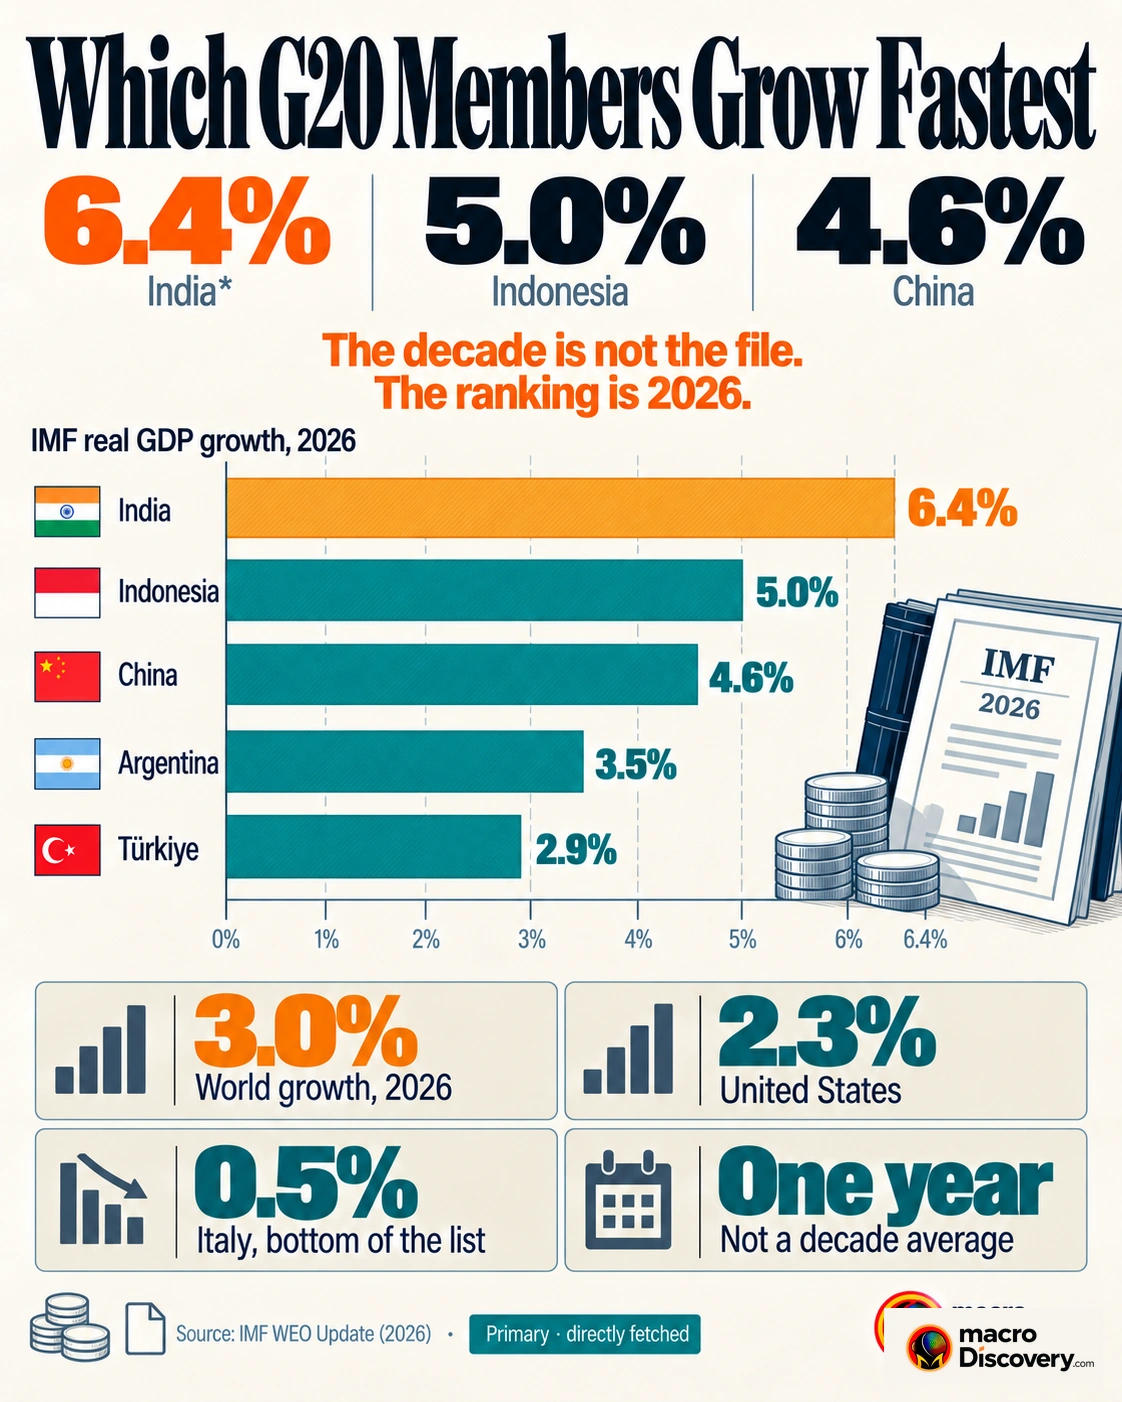
- 6.4% — India’s forecast real growth in 2026, first in the G20. Indonesia 5.0%. China 4.6%. Source: IMF.
- 77% — India’s inflation-adjusted gain from 2015 to 2025. China was about 74%. Source: IMF, via compiled table.
- 59% — Turkey’s real gain over the same window. Its 2026 forecast is near 3%, so it drops off the one-year podium. Source: IMF.
What the data shows
A common claim is that a ranking already shows which G20 members grow fastest this decade. The fact is that the ranking in circulation is one forecast year. The IMF’s 2026 list puts India at 6.4%, Indonesia at 5.0%, and China at 4.6%. The July update kept India at 6.4% and raised China from 4.4% to 4.6%. The United States is near 2.3%. Italy, near 0.5%, is at the bottom. Those are rates for one year. A decade is ten of them, and 2026 is not finished.
The longer window changes the order under the top. From 2015 to 2025, inflation-adjusted output rose about 77% in India and about 74% in China. Turkey rose about 59%. Indonesia rose about 51%. The United States rose about 28%. Turkey is third on that span and absent from the 2026 podium, where its forecast is near 3%. A country can have a fast decade and a middling year. The headline ranking keeps the year and drops the decade.
A quarterly rate is a third object. In the second quarter of 2026, G20 output was 3.1% above a year earlier. India was 8.1%, Indonesia 5.3%, China 4.3%. That is one quarter against the same quarter of 2025. It is not the pace from 2020. A 2020 crash and a 2021 rebound can inflate a decade average if the start year is the trough. The 2015 to 2025 span starts before this decade. It is the available cumulative file, not a finished 2020 to 2029 ranking.
On the 2026 list Turkey is near 3% and off the podium. The decade file keeps it.
| Count | Figure | What it is |
|---|---|---|
| India, 2026 | 6.4% | IMF forecast. One year |
| Indonesia, 2026 | 5.0% | Second on the year list |
| China, 2026 | 4.6% | Raised from 4.4% in July |
| India, 2015–2025 | 77% | Real cumulative gain |
| Turkey, 2015–2025 | 59% | High on the span, not the year |
How it was measured
A forecast rate is the expected change in real GDP in one year. The IMF revises it. China’s 2026 figure moved from 4.4% to 4.6% in one update. A cumulative gain is the change in inflation-adjusted output between two years. It is not an average of the annual rates, and it is not a per-person figure.
The G20 includes the European Union as a member alongside countries. A country rank and a bloc rank should not be mixed. Quarterly year-on-year growth, such as India’s 8.1% in the second quarter of 2026, uses a different base from the annual forecast.
What it means
It is settled that India leads the 2026 G20 forecast at 6.4%, and that India and China led the 2015 to 2025 real gain. It is not settled that the 2026 list is the decade. Use 6.4% for the year. Use 77% and 74% for the span. Use 59% for Turkey’s place on the longer file. Do not rank the decade on one forecast.
Common misreadings
- 6.4% is a 2026 forecast. It is not the decade rate.
- Turkey’s 59% real gain is missing from the one-year podium.
- A quarterly 8.1% is not the ten-year pace. A 2020 trough inflates a rebound.
Where the numbers come from
How we built this
- Dataset: IMF 2026 G20 forecast; IMF real GDP change 2015 to 2025; OECD second-quarter 2026 year-on-year rates.
- Scope: G20 members. The year, the span, and the quarter kept separate. The European Union not mixed into the country rank.
- Figures: 6.4% is the year. 77% is India’s span. 59% is Turkey’s span. The decade ranking is treated as unfinished.