
Home AI Technology Gaming Future Economy Geography Automobile Science Web Stories

The US Stock Market Is 60% of Global Value on 25% of Global GDP

Macro Discovery
On: September 3, 2026 4:25 PM
Follow Us:
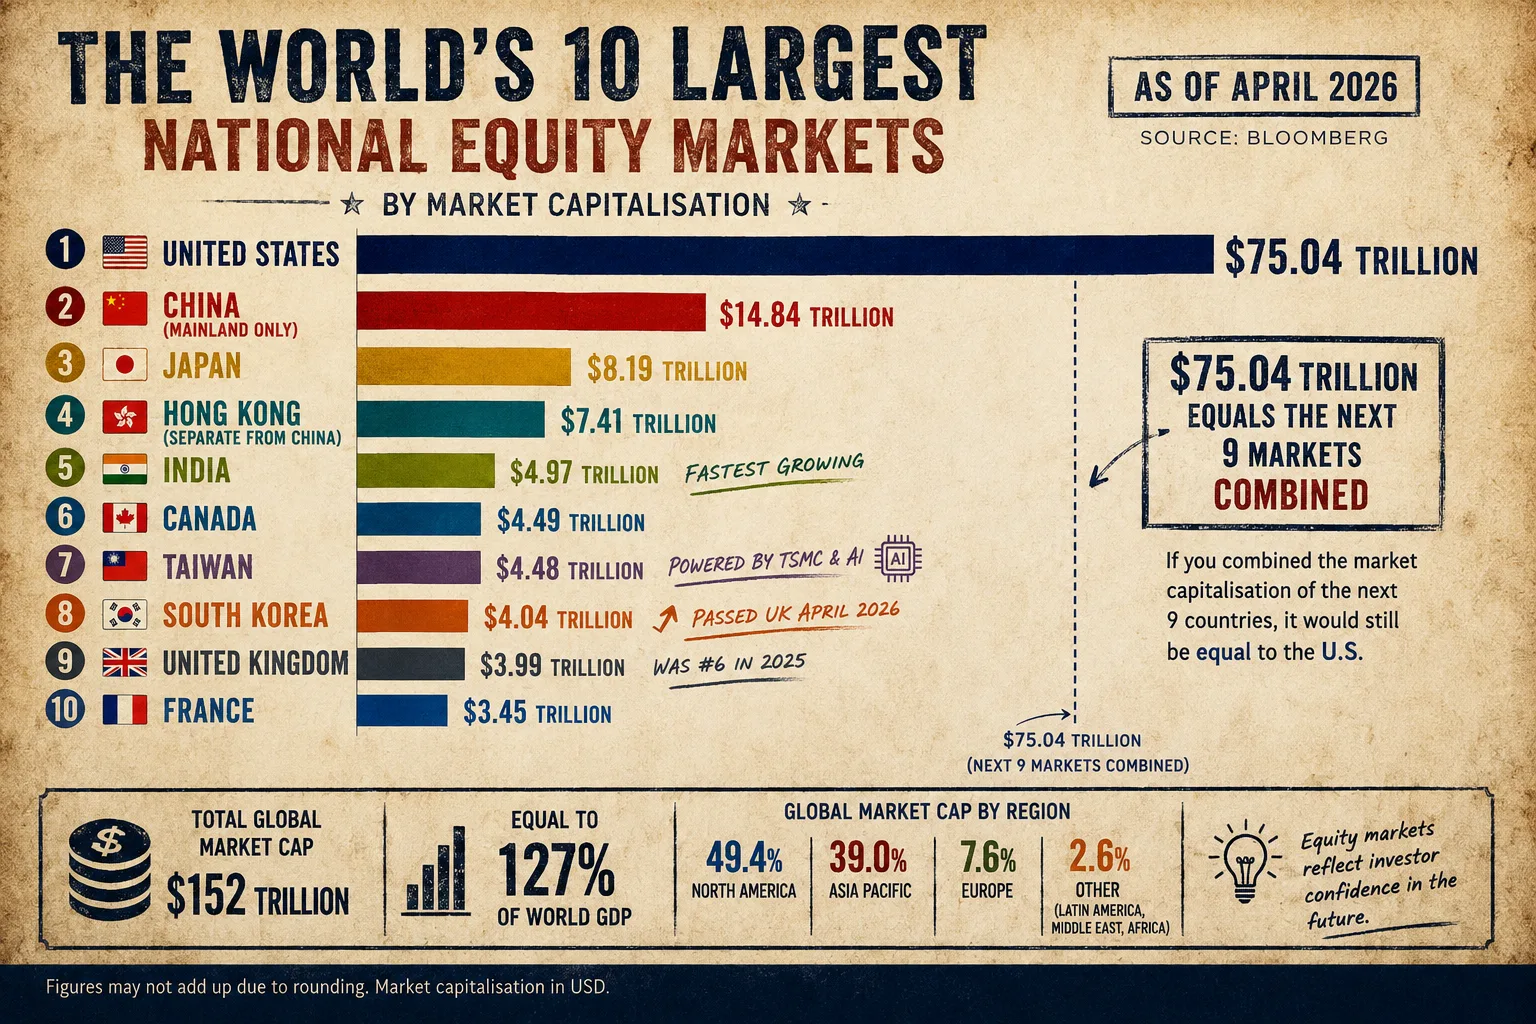
Infographic of the world’s 10 largest stock markets by market capitalization in April 2026, with the United States at $75.04 trillion, followed by China, Japan, Hong Kong, India, Canada, Taiwan, South Korea, the UK, and France. The US Stock Market Is 60% of Global Value on 25% of Global GDP.
Ranked: The World’s Largest Stock Markets — MacroDiscovery
MacroDiscovery
Global Finance & Markets · 5 min read · Bloomberg Apr 2026 · WFE Mar 2026 · Primary
Bloomberg (PRIMARY · April 2026 · via Visual Capitalist May 26, 2026 · directly fetched) · WFE — World Federation of Exchanges (PRIMARY · focus.world-exchanges.org · March 2026 statistics) · BusinessStats (WFE + World Bank · mid-2026)
Global Markets · Country Rankings · 2026

Ranked: The World’s
Largest Stock Markets

U.S.-listed companies are worth more than $75 trillion — exceeding the combined value of the next nine largest equity markets worldwide. That is roughly half of all publicly listed equity value on Earth. South Korea just passed the UK to become the world’s eighth-largest market. Nasdaq surpassed the NYSE as the largest single exchange for the first time ever. Here is where global equity capital is concentrated.

By MacroDiscovery
Source: Bloomberg calculations · April 2026 · via Visual Capitalist (directly fetched)
Breaking: Korea passed UK · Bloomberg April 28, 2026 · South Korea now #8 globally
$75T
US market cap · April 2026 · exceeds the next 9 largest markets combined · Bloomberg primary
$152T
global stock market cap · mid-2026 · = 127% of world GDP · $64T in 2013 → $152T today
$35T
Nasdaq: world’s largest single exchange · March 2026 · WFE primary · first time ever surpassed NYSE
$4.97T
India: #5 global market · world’s fastest-growing major equity market · driven by NSE + BSE · Bloomberg
Visualization 01 — World’s Largest Stock Markets by Country · April 2026
Ranked: The 10 Largest National Equity Markets

Total market capitalization of domestically listed companies by country, April 2026. Bars scaled to the US ($75.04T). Source: Bloomberg (PRIMARY · April 2026 · via Visual Capitalist · directly fetched · May 26, 2026). Note: Hong Kong is listed separately from mainland China as Bloomberg treats them as distinct markets. Where a country has multiple major exchanges, the figure represents combined domestic market cap across all exchanges.

1
🇺🇸 United States
NYSE + Nasdaq · Apple, Microsoft, NVIDIA, Amazon, Alphabet among world’s most valuable companies · ~49% of global equity · Nasdaq surpassed NYSE as largest single exchange in March 2026 (WFE primary)
Half of global equity
$75.04T
Bloomberg · Apr 2026
2
🇨🇳 China (Mainland)
Shanghai Stock Exchange + Shenzhen Stock Exchange · A-shares + B-shares · state-owned enterprises dominate · market has been affected by regulatory crackdowns and property sector stress · does not include Hong Kong (listed separately at #4)
Separate from HK · Regulatory risk
$14.84T
Bloomberg · Apr 2026
3
🇯🇵 Japan
Japan Exchange Group (Tokyo + Osaka) · Nikkei 225 · export-driven: Toyota, Sony, SoftBank, Mitsubishi · yen weakness reduces USD market cap · “China and Japan are the only other countries with stock markets above $8 trillion” — Bloomberg
Only 2 others >$8T
$8.19T
Bloomberg · Apr 2026
4
🇭🇰 Hong Kong
HKEX · financial gateway between mainland China and global investors · H-shares (Chinese companies listed in HK) + international listings from 60+ countries · political and regulatory risks since 2020 National Security Law · still Asia’s key international capital market
Separate from China #2
$7.41T
Bloomberg · Apr 2026
5
🇮🇳 India
National Stock Exchange (NSE) + BSE India · both entered exchange-level top 10 for the first time (WFE March 2026) · world’s fastest-growing major equity market · domestic retail investor boom · Reliance, HDFC, Infosys, TCS among largest listings · mid-2026 GDP growth: ~6.5%
Fastest growing top-5
$4.97T
Bloomberg · Apr 2026
6
🇨🇦 Canada
TMX Group · Toronto Stock Exchange (TSX) · third-largest exchange in North America after NYSE and Nasdaq · heavily weighted toward financial services, energy, and natural resources · TSX Venture Exchange for smaller companies · strong ties to US equity markets through cross-listings
Resource + finance heavy
$4.49T
Bloomberg · Apr 2026
7
🇹🇼 Taiwan
Taiwan Stock Exchange · home to TSMC — which fabricates 92% of the world’s most advanced semiconductors · AI chip demand has driven extraordinary capital inflows · surpassed UK in equity market size driven by TSMC’s valuation growth · geopolitical risk premium vs AI tailwind
AI + chips · passed UK
$4.48T
Bloomberg · Apr 2026
8
🇰🇷 South Korea
Korea Exchange (KRX) · Samsung Electronics, SK Hynix — dominant in AI memory chips (HBM) and global semiconductors · Bloomberg April 28, 2026: “Korea passes UK to become world’s eighth largest stock market” ← the most recent ranking shift · AI-driven capital inflows overtook UK for first time
JUST PASSED UK · Apr 28 2026
$4.04T
Bloomberg · Apr 28 2026
9
🇬🇧 United Kingdom
London Stock Exchange (LSE) + AIM · fell from #6 globally as recently as May 2025 · passed by both Taiwan and South Korea due to AI/semiconductor capital flows · post-Brexit challenges: slower listing growth, some dual-listed companies deregistered from London · internationally connected: 60+ country listings
Passed by KR, TW · Down from #6
$3.99T
Bloomberg · Apr 2026
10
🇫🇷 France
Euronext Paris · largest component of Euronext, Europe’s multi-country exchange spanning 8 nations (France, Netherlands, Belgium, Ireland, Italy, Portugal, Norway, Denmark) · LVMH, TotalEnergies, Airbus among largest listings · France is home to 5 of Europe’s 10 largest banks by assets (S&P Global 2026)
Euronext hub · 8 countries
$3.45T
Bloomberg · Apr 2026
Two ways to rank: This table ranks by country (Bloomberg, April 2026) — the US total ($75.04T) combines NYSE + Nasdaq. By individual exchange (WFE, March 2026), Nasdaq ($35.0T) leads for the first time ever, followed by NYSE — both in the US. India enters the exchange-level top 10 for the first time with both NSE (#9) and BSE (#10). Rankings change daily as prices, exchange rates, and listings shift.
Visualization 02 — How the Global Equity Rankings Shifted · 2013 to 2026
The AI Era Is Redrawing the Global Equity Map

The rankings we see today are not permanent. They reflect a specific historical moment in which AI-related investment is flooding semiconductor-exposed markets and the US technology sector. Sources: BusinessStats (WFE + World Bank data · mid-2026) · Bloomberg (April 28, 2026) · WFE (March 2026 primary) · Visual Capitalist (May 26, 2026 · directly fetched) · EBC Financial Group (May 11, 2026 citing WFE).

2013
Baseline
$64 Trillion Globally. The US Led. NYSE Was the World’s Largest Exchange. China Had Just Overtaken Japan.
Global stock market capitalization was approximately $64 trillion in 2013 — roughly 83% of world GDP at the time. The US was already the clear dominant market, but the gap between it and the next-largest markets was smaller. The NYSE was the world’s largest exchange by a significant margin. China had recently overtaken Japan to become the world’s second-largest equity market. The UK was firmly in the top five. India was well outside the top five. AI was not yet a meaningful driver of equity valuations anywhere.
$64T global totalNYSE = world’s largest exchangeUK: top 5
2020–21
Surge
The COVID Tech Boom. Global Cap Surges Past $100 Trillion. Nasdaq Starts Closing In on NYSE.
The pandemic accelerated digital adoption by five years in two. Technology companies saw extraordinary valuation growth. Nasdaq — home to Apple, Microsoft, Amazon, Alphabet, and Facebook — surged while the NYSE’s more diversified composition grew more slowly. Global market cap crossed $100 trillion for the first time. The ratio of global market cap to GDP exceeded 100% for the first time since the dot-com boom — and kept rising. The seeds of AI investment were planted in the era of near-zero interest rates and easy capital.
$100T global cap crossedNasdaq accelerating vs NYSEMarket cap > world GDP
2022
Crash
$22 Trillion Wiped Off Global Markets — the Steepest Single-Year Fall in a Decade. Rate Hikes Hit Tech Valuations Hardest.
When the Federal Reserve raised rates at the fastest pace since the 1980s, the markets built on low discount rates suffered most. Tech-heavy Nasdaq fell more than 30% in 2022. Global market capitalisation fell by approximately $22 trillion — the steepest single-year decline of the decade. China’s market faced additional pressure from regulatory crackdowns on technology companies and the property sector crisis. The UK briefly saw relative resilience due to its energy and resources exposure. The reset was painful but temporary.
–$22T: steepest single-year fallFed rates: fastest rise since 1980sNasdaq: –30%+
2023–24
AI surge
ChatGPT Changes Everything. NVIDIA Becomes the World’s Most Valuable Company. Taiwan and South Korea Start Rising Fast.
The release of ChatGPT in late 2022 triggered a reappraisal of which companies and which countries would benefit most from the AI era. NVIDIA — which makes the GPUs that train AI models — saw its market cap grow from around $360 billion at the start of 2023 to over $3 trillion by mid-2024. Taiwan’s TSMC and South Korea’s Samsung and SK Hynix — the companies that manufacture the chips and the memory that AI requires — became among the largest beneficiaries. Both countries began to climb the global equity ranking, passing older financial powers as AI capital flooded in.
NVIDIA: $360B → $3T+Taiwan + Korea: rising fastAI reorders the ranking
Apr 2026
Now
$75 Trillion US. Korea Passes UK. Nasdaq Leads All Exchanges for the First Time. Global Total: $152 Trillion.
By April 2026, the AI-driven concentration of equity value in US technology stocks had produced a market capitalization of $75.04 trillion — exceeding the next nine largest markets combined. On April 28, Bloomberg reported that South Korea had passed the UK to become the world’s eighth-largest equity market, at $4.04 trillion versus $3.99 trillion for the UK. At the exchange level, Nasdaq surpassed the NYSE for the first time in history in March 2026, with approximately $35 trillion in domestic market capitalisation, according to the WFE. Global equity now stands at approximately $152 trillion — 127% of world GDP, a ratio exceeded only briefly at the peak of 2021.
US: $75.04T · Bloomberg Apr 2026Korea passes UK · Apr 28 2026Nasdaq: first time #1 exchange$152T global · 127% of GDP

The global stock market is not evenly distributed. It is not even close. One country holds roughly half of all listed equity value on Earth. That country’s stock market is larger than the next nine biggest markets added together. This is not an accident of history. It reflects decades of policy, capital allocation, legal infrastructure, and — increasingly — the concentration of the world’s most valuable technology companies in a single national market.

“America’s stock market is larger than the next nine biggest markets combined.”

— Bloomberg / Visual Capitalist · May 26, 2026 · directly fetched · data: April 2026

The AI Reordering — Why Taiwan and South Korea Passed the UK

The world’s equity rankings are not static. They reflect what investors believe will generate future returns. Between 2023 and 2026, that belief has been overwhelmingly focused on artificial intelligence — specifically on the semiconductor infrastructure that AI requires. Taiwan’s market is now largely a proxy for TSMC, which fabricates 92% of the world’s most advanced chips. South Korea’s market is largely a proxy for Samsung Electronics and SK Hynix, which together dominate global production of the high-bandwidth memory that AI accelerators require. Both countries passed the UK in total equity market cap as AI capital flooded their markets. On April 28, 2026, Bloomberg confirmed South Korea had surpassed the UK to become the world’s eighth-largest equity market. Visual Capitalist noted directly that “Taiwan and South Korea have overtaken older financial powers like the UK as investors pour capital into chip manufacturing and AI infrastructure.” The London Stock Exchange, which ranked sixth globally as recently as May 2025, has now fallen to ninth by country. This is the fastest reshaping of the global equity ranking in decades.

Why it matters: equity market size is not just a scoreboard — it determines the cost of capital for companies in those markets. As Taiwan and South Korea rise, their companies find it easier and cheaper to raise capital globally. As UK-listed companies see relative decline, the cost and availability of capital shifts away from London.
Bloomberg · April 28, 2026 · Korea Exchange (KRX) · WFE March 2026 (PRIMARY)
$4.04T
Bloomberg, April 28, 2026: “Korea passes UK to become world’s eighth largest stock market.” South Korea ($4.04T) overtook the UK ($3.99T) — a gap of $50 billion — driven by Samsung, SK Hynix, and AI chip demand.
At the exchange level, Nasdaq surpassed the NYSE as the world’s largest single stock exchange for the first time in history, with approximately $35 trillion in domestic market capitalisation as of March 2026, according to the World Federation of Exchanges (WFE). Nasdaq’s rise reflects the AI era’s concentration of value in technology, software, semiconductors, biotech, and growth companies — all of which primarily list on Nasdaq. The NYSE remains formidable, home to financial institutions, industrial conglomerates, and energy majors — but Nasdaq’s decade of outperformance has now made it the larger exchange by market cap.
Source: Bloomberg (April 28, 2026 · cited by Visual Capitalist: “Korea passes UK to become world’s eighth largest stock market”) · WFE — World Federation of Exchanges (PRIMARY · focus.world-exchanges.org · March 2026 statistics · cited by EBC Financial Group May 11, 2026 · “Nasdaq is the largest stock exchange in the world by WFE domestic market capitalization, with about $35.0 trillion in March 2026” · “Nasdaq surpassed the NYSE in 2026 to claim the top position globally by domestic market capitalisation” · WFE also confirms India’s NSE (#9) and BSE (#10) both entered exchange top 10 for first time)

The $152 Trillion World — When Markets Are Worth More Than the Global Economy

Global stock market capitalisation has reached approximately $152 trillion as of mid-2026 — equivalent to 127% of world GDP. The last time the ratio exceeded 100% was from 2019 onwards, peaking near 128% in 2021 before the 2022 sell-off. The recovery since 2022 has been remarkable: global market cap fell approximately $22 trillion in 2022, the steepest single-year decline of the period, before recovering and then surpassing its previous record. The implication of a market cap-to-GDP ratio above 100% is that investors are paying more than one year of global economic output for claims on future corporate earnings. Whether that premium is justified depends entirely on whether AI-driven productivity gains materialise at the scale that current equity prices imply. If they do, today’s valuations will look prescient. If they do not, the correction could be severe.


Why it matters: when global market cap exceeds global GDP, equity prices are pricing in growth that has not yet happened. The concentration of that excess valuation in US technology stocks means that if AI productivity gains disappoint, the correction will disproportionately affect the market that has benefited most.
BusinessStats · WFE + World Bank · mid-2026 · Global Market Cap Tracker
$152T
Global stock market capitalisation reached approximately $152 trillion by mid-2026 — 127% of world GDP. In 2013, the global total was $64 trillion. It has more than doubled in 13 years.
The doubling of global market cap from $64 trillion (2013) to $152 trillion (2026) reflects both real economic growth and expanding price-to-earnings multiples — investors paying more for each dollar of corporate earnings. The regional distribution shows the concentration clearly: the Americas hold roughly 49% of global equity value, Asia-Pacific holds 33%, and Europe, the Middle East and Africa hold the remaining 18%. The US alone — at $75.04 trillion — holds approximately 49% of the $152 trillion global total. India and the countries of Southeast Asia represent the most significant growth opportunity in the next decade, as their equity markets remain small relative to their economic size and population.
Source: BusinessStats — “Global Stock Market Cap 2013-2026: $152 Trillion” (WFE + World Bank data compiled by BusinessStats · mid-2026 · “total market capitalization…about 152 trillion dollars in 2026, up from roughly 64 trillion in 2013” · “In 2026 world market capitalization reached about 127 percent of world GDP” · “The Americas hold about 49 percent of global market cap, the Asia-Pacific about 33 percent, and Europe, the Middle East and Africa the remaining 18 percent” · “Rising interest rates and a global bear market cut about 22 trillion dollars off the world total in 2022, the steepest single-year fall of the period”) · World Federation of Exchanges (WFE) statistics cited as primary source
Key Numbers at a Glance
Global Market · Mid-2026
$152T
Total global stock market cap — 127% of world GDP. More than doubled since 2013’s $64T. Americas hold 49%; Asia-Pacific 33%.
BusinessStats (WFE + World Bank)
AI Reordering · April 28 2026
#8 KR
South Korea ($4.04T) passed the UK ($3.99T) to become the world’s 8th largest equity market, driven by Samsung, SK Hynix, and AI chip demand.
Bloomberg (April 28, 2026 primary)
India · Both Exchanges Top 10
$4.97T
India is #5 globally at $4.97T — and for the first time, both NSE and BSE entered the exchange-level top 10 simultaneously (WFE March 2026).
Bloomberg + WFE primary
Frequently Asked Questions
What is the largest stock market in the world?
By country: the United States — with $75.04 trillion in total market capitalisation of listed companies as of April 2026 (Bloomberg). This exceeds the combined value of the next nine largest markets worldwide. By individual exchange: Nasdaq became the world’s largest single stock exchange for the first time in history in March 2026, with approximately $35 trillion in domestic market capitalisation (WFE primary). Nasdaq surpassed the NYSE due to sustained growth in technology and AI-related listings.
What are the top 10 stock markets by country in 2026?
Based on Bloomberg calculations of domestically listed companies as of April 2026: 1. US ($75.04T) · 2. China ($14.84T) · 3. Japan ($8.19T) · 4. Hong Kong ($7.41T) · 5. India ($4.97T) · 6. Canada ($4.49T) · 7. Taiwan ($4.48T) · 8. South Korea ($4.04T) · 9. UK ($3.99T) · 10. France ($3.45T). Note: Hong Kong is listed separately from mainland China. China and Japan are the only countries outside the US with markets above $8 trillion.
How big is the US stock market compared to the rest of the world?
The US stock market ($75.04 trillion) exceeds the combined value of the next nine largest markets worldwide — China, Japan, Hong Kong, India, Canada, Taiwan, South Korea, the UK, and France together total approximately $61.26 trillion. The US holds roughly 49% of global equity value. Total global market capitalization is approximately $152 trillion as of mid-2026 (WFE + World Bank, compiled by BusinessStats). Source: Bloomberg (April 2026), via Visual Capitalist (directly fetched, May 26, 2026).
Why did South Korea pass the UK in stock market size?
AI and semiconductor investment — Bloomberg reported on April 28, 2026 that “Korea passes UK to become world’s eighth largest stock market.” South Korea’s equity market is heavily exposed to Samsung Electronics and SK Hynix, which dominate global production of the high-bandwidth memory chips that AI accelerators require. As AI investment surged globally, capital flowed disproportionately into semiconductor-exposed markets. Taiwan also surpassed the UK for similar reasons (TSMC). Visual Capitalist noted that “Taiwan and South Korea have overtaken older financial powers like the UK as investors pour capital into chip manufacturing and AI infrastructure.”
What is the total value of the world’s stock markets?
Approximately $152 trillion as of mid-2026 — equivalent to 127% of world GDP, meaning listed equity is worth more than the entire global economy produces in a year. This is derived from World Federation of Exchanges (WFE) and World Bank data compiled by BusinessStats. Global market cap was approximately $64 trillion in 2013 and has more than doubled in 13 years. The Americas hold roughly 49% of the global total, Asia-Pacific holds 33%, and Europe, the Middle East, and Africa hold the remaining 18%.
Sources
  • Bloomberg (PRIMARY · April 2026) via Visual Capitalist — “Ranked: The World’s Largest Stock Markets” (directly fetched · visualcapitalist.com/ranked-the-worlds-largest-stock-markets · May 26, 2026 · author: Gabriel Cohen · “As of April 2026, the total market capitalization of U.S.-listed companies stands at more than $75 trillion, exceeding the combined value of the next nine largest equity markets worldwide” · “America’s stock market is larger than the next nine biggest markets combined” · “China and Japan are the only other countries with stock markets above $8 trillion” · “Taiwan and South Korea have overtaken older financial powers like the UK as investors pour capital into chip manufacturing and AI infrastructure” · Complete table confirmed: US $75.04T · China $14.84T · Japan $8.19T · Hong Kong $7.41T · India $4.97T · Canada $4.49T · Taiwan $4.48T · South Korea $4.04T · UK $3.99T · France $3.45T)
  • Bloomberg (April 28, 2026 · cited by Visual Capitalist) — “Korea passes UK to become world’s eighth largest stock market” · South Korea: $4.04T · UK: $3.99T · gap: ~$50 billion · driven by Samsung Electronics + SK Hynix + AI chip demand · Bloomberg’s most recent ranking shift
  • WFE — World Federation of Exchanges (PRIMARY · focus.world-exchanges.org · March 2026 statistics) via EBC Financial Group (May 11, 2026 citing WFE primary): “Nasdaq is the largest stock exchange in the world by WFE domestic market capitalization, with about $35.0 trillion in March 2026” · “Based on the latest WFE data…top 10: Nasdaq, NYSE, Shanghai, Euronext, Japan Exchange Group, Shenzhen, Hong Kong, TMX Group, NSE India, BSE India” · “Nasdaq surpassed the NYSE in 2026 to claim the top position globally…according to the World Federation of Exchanges (WFE)—driven largely by the continued expansion of technology and AI-related listings” (Vantage Markets, 1 week ago, citing WFE)
  • BusinessStats — “Global Stock Market Cap 2013-2026: $152 Trillion” (WFE + World Bank data compiled · June 30, 2026 · businesstats.com · “total market capitalization…about 152 trillion dollars in 2026, up from roughly 64 trillion in 2013” · “In 2026 world market capitalization reached about 127 percent of world GDP” · “Americas hold about 49 percent of global market cap, the Asia-Pacific about 33 percent, EMEA 18 percent” · “Rising interest rates and a global bear market cut about 22 trillion dollars off the world total in 2022, the steepest single-year fall of the period” · Derives from WFE and World Bank primary data)
  • Vantage Markets — “Largest Stock Exchanges in the World: Top 10 by Market Cap” (1 week ago · vantagemarkets.com · citing WFE March 2026 and Statista/WFE · “Euronext: domestic market capitalization stands at approximately $8.7 trillion” · India now places two exchanges in global top 10 for first time — NSE and BSE · London Stock Exchange “slipped outside the top tier [exchange-level top 10]” · “ranked sixth globally as recently as May 2025”)
  • EBC Financial Group (May 11, 2026 · ebc.com · citing WFE primary · “WFE May 2026 statistics page reports market-capitalization data through March 2026” · confirms top 10 exchange ranking · Nasdaq $35.0T · notes India’s NSE #9 and BSE #10 — “India also appears twice because NSE and BSE are separate exchanges” · UK: “The London Stock Exchange ranks below the top 10 exchanges listed here” [exchange level])
  • Visual Capitalist / S&P Global — “Ranked: Europe’s Biggest Banks by Assets” (July 22, 2026 · directly fetched in same session · France home to 5 of Europe’s 10 largest banks · BNP Paribas #1 European bank $3.3T assets · HSBC #2 · context for France’s position as Euronext hub)
Macro Discovery

Sukh Dhaliwal

Sukh Dhaliwal is the founder of Macro Discovery, an independent digital publication covering AI, technology, science, future trends, and global innovation through visual storytelling and data-driven analysis.

Join WhatsApp

Join Now

Join Facebook

Follow us

Leave a Comment










