
The Map of
Global Shipping Chokepoints
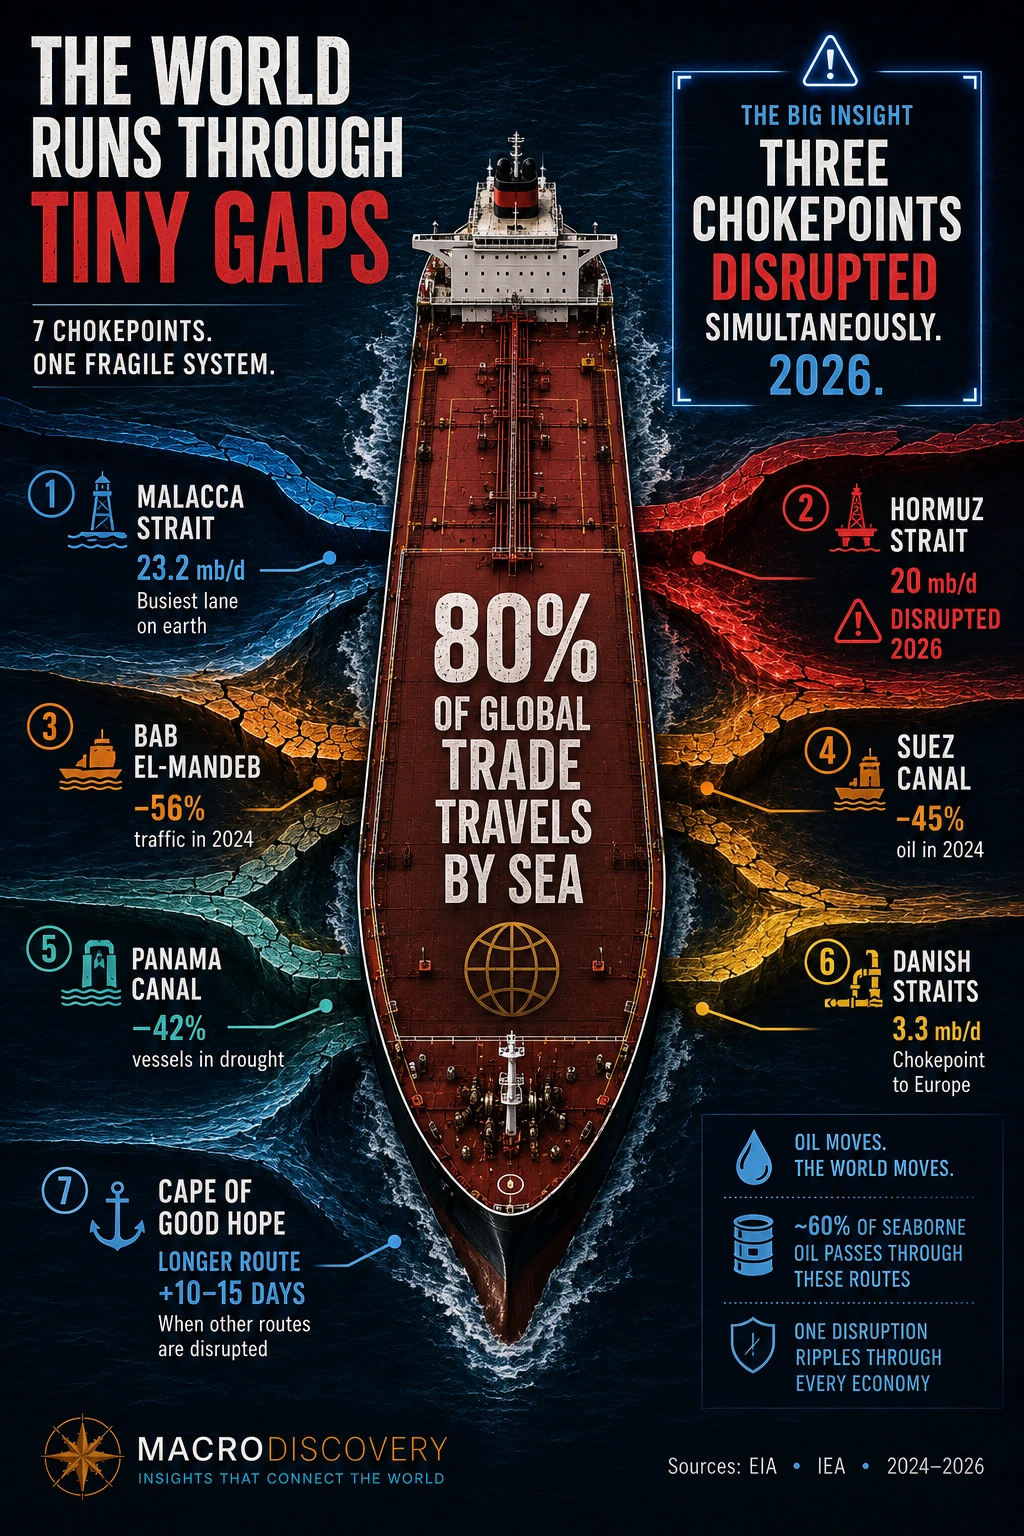
Eighty percent of everything the world buys travels by sea. Nearly all of it passes through fewer than ten narrow straits. The Strait of Hormuz carries 20 million barrels of oil per day. The Strait of Malacca is the busiest shipping lane on earth. The Suez Canal route lost half its traffic when Houthi missiles started falling. Right now, three of these chokepoints are simultaneously disrupted — and the consequences are rippling through energy prices, food supply chains, and the global economy.
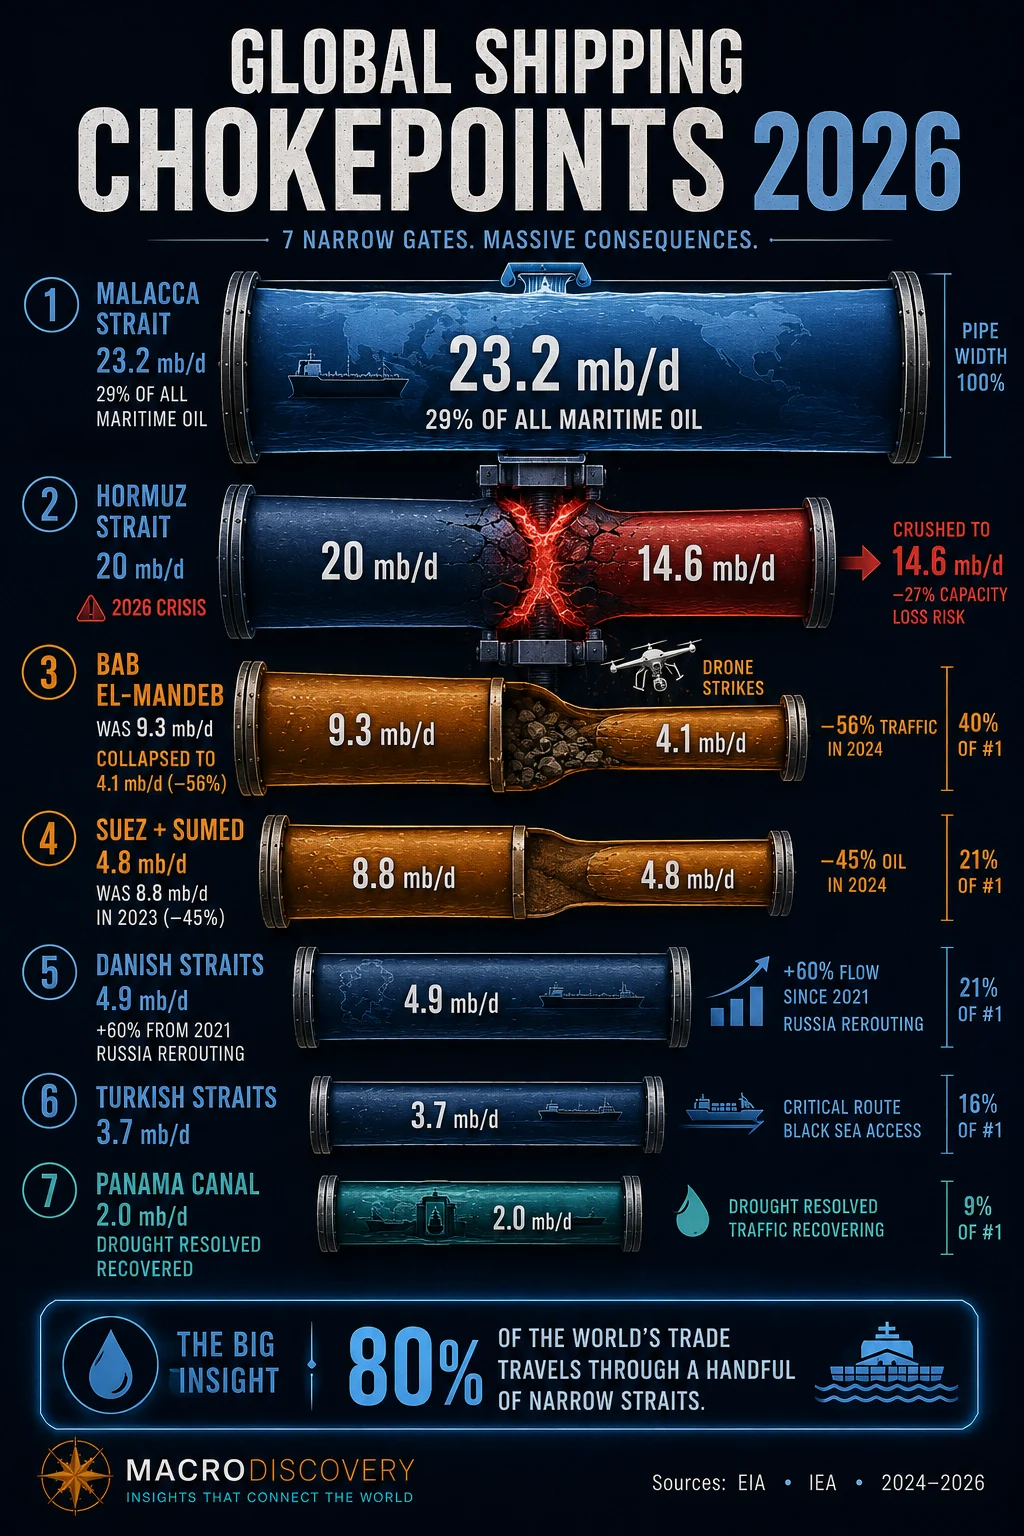
- The Strait of Malacca is the world’s busiest shipping lane by oil volume — carrying 23.2 million barrels per day in the first half of 2025, or 29% of all maritime oil flows. It is also the primary route for China’s imports, with 80% of Chinese oil passing through here. Beijing’s strategists call this vulnerability the “Malacca Dilemma.”
- The Strait of Hormuz is the world’s most critical energy chokepoint by consequence — because it has no real alternative. The only sea exit for five of the world’s top ten oil producers, it carries 20 million barrels per day plus 20% of global LNG trade. Pipeline bypasses exist but cover only ~4.7 mb/d of the 20 mb/d flow. As of Q1 2026, Iran’s partial blockade cut flows by nearly 30%.
- The Red Sea corridor (Suez + Bab el-Mandeb) lost half its oil traffic in 2024 following Houthi attacks. Oil flows through Bab el-Mandeb fell from 9.3 mb/d in 2023 to 4.1 mb/d in 2024 — a 56% collapse. Container traffic through Suez fell from 26,000 vessels in 2023 to ~13,000 in 2024. Most shipping rerouted via the Cape of Good Hope, adding 10–15 days per voyage.
- Three chokepoints disrupted simultaneously in 2024–2026 is historically unprecedented in the modern era. Hormuz (conflict), Red Sea (Houthi attacks), and Panama (drought) were all operating below normal at the same time. The Cape of Good Hope — an open ocean route, not a chokepoint — emerged as the world’s most-used alternative, with oil flows rising from 6.1 mb/d in 2022 to 9.3 mb/d in 2024.
- The Taiwan Strait carries over 20% of global maritime trade by value but receives far less political attention than Hormuz. Nearly half of the global container fleet and almost all advanced semiconductors — including every chip made by Taiwan’s TSMC — pass through this 130-km wide strait. Military tensions between China and Taiwan make it a latent chokepoint of the first order.
| Chokepoint | Oil Flow 2024 (mb/d) | % Maritime Oil | Width | Status 2026 | Flow |
|---|---|---|---|---|---|
Strait of MalaccaMalaysia · Indonesia · Singapore |
22.5 (2024) 23.2 (1H25) |
~29% | 2.7 km narrowest · 900 km long | Active · Elevated piracy | |
Strait of HormuzIran · Oman |
20.7 (2024) 14.6 (Q1 26) |
~25% | 34 km narrowest | ⚠ DISRUPTED Feb 2026 | |
Bab el-MandebYemen · Djibouti · Eritrea |
4.1 (2024) was 9.3 in 2023 |
~5% (2024) | 29 km narrowest · “Gate of Grief” | ⚠ Houthi threat ongoing | |
Suez Canal + SUMEDEgypt · Mediterranean–Red Sea |
4.8 (2024) was 8.8 in 2023 |
~6% (2024) | 225 m narrowest · 193 km long | ⚠ Still ~50% below 2023 | |
Danish StraitsDenmark · Baltic–North Sea |
4.9 (2024) | ~6% | Multiple channels · Baltic access | Normal · Russia rerouting | |
Turkish StraitsBosphorus + Dardanelles |
3.6 (2024) | ~5% | <1 nautical mile narrowest · World’s busiest strait by vessel count | Normal · 45,000+ vessels/yr | |
Panama CanalPanama · Atlantic–Pacific |
2.0 (FY2024) 2.3 (FY2025) |
~3% | 222 m narrowest · 80 km long · Opened 1914 | ✓ Drought resolved FY2025 | |
Cape of Good HopeSouth Africa · Open ocean bypass |
9.3 (2024) | ~11% | Not a chokepoint — open ocean. Primary alternative to Suez. | ↑ Heavy rerouting traffic |
Source: EIA World Oil Transit Chokepoints (primary, March 2026 edition, directly fetched). Oil flows in million barrels per day (mb/d). “% Maritime oil” = share of total seaborne-traded oil (~79.8 mb/d in 1H2025). Suez figures include the SUMED (Suez-Mediterranean) pipeline. Panama FY2025 = fiscal year ending September 2025 (Panama Canal Authority data via EIA). Q1 2026 Hormuz figure from EIA Global Energy Security Data Report (May 2026). Cape of Good Hope is not a chokepoint — it appears here as the primary alternative route. Click column headers to sort.
| Chokepoint | 2020 | 2022 | 2023 | 2024 | 1H2025 | Change 23→24 |
|---|---|---|---|---|---|---|
| Strait of Malacca | 22.8 | 23.0 | 24.0 | 22.5 | 23.2 | −6% |
| Strait of Hormuz | 19.2 | 21.9 | 21.8 | 20.7 | 20.9 | −5% |
| Bab el-Mandeb | 5.7 | 8.0 | 9.3 | 4.1 | 4.2 | −56% ⚠ |
| Suez + SUMED | 5.4 | 7.3 | 8.8 | 4.8 | 4.9 | −45% ⚠ |
| Danish Straits | 3.1 | 4.2 | 5.0 | 4.9 | 4.9 | −2% |
| Turkish Straits | 3.2 | 3.2 | 3.5 | 3.6 | 3.7 | +3% |
| Panama Canal | 1.7 | 2.2 | 2.2 | 2.0 | 2.3 | −9% |
| Cape of Good Hope | 7.9 | 6.1 | 6.2 | 9.3 | 9.1 | +50% ↑ |
Source: EIA World Oil Transit Chokepoints, Table 1 (primary, directly fetched March 2026). All figures in million barrels per day (mb/d). Panama Canal uses US fiscal year (Oct–Sep). The 50% increase in Cape of Good Hope traffic directly reflects rerouting away from the Suez/Bab el-Mandeb corridor. EIA: “The increase in Cape of Good Hope flows of approximately 3 mb/d from 2022 to 2024 reflects ships avoiding the Bab el-Mandeb.”
Why Does the Strait of Malacca Matter More Than Almost Any Place on Earth?
The Strait of Malacca is 900 kilometres long and barely 2.7 kilometres wide at its narrowest point. In the first half of 2025, 23.2 million barrels of oil passed through it every day — more than through any other single maritime passage on earth, according to EIA data. That is 29% of all oil traded by sea, moving through a gap you could swim across in under an hour.
The strategic weight of Malacca goes beyond oil volumes. China receives approximately 80% of its oil imports through this strait — a dependency so alarming to Chinese strategic planners that it has a name: the “Malacca Dilemma.” If a hostile power or natural disaster closed the strait, China’s energy supply would be severed within weeks. India faces the same structural vulnerability on a smaller scale. In 1H2025, China alone accounted for 48% of all import volumes transiting Malacca, with Persian Gulf OPEC producers supplying roughly 60% of the crude flowing through.
Singapore — sitting directly at the eastern mouth of the strait — hosts the world’s second-busiest container port partly because of this geography. Every ship passing between the Indian and Pacific Oceans funnels past its docks. The strait also carries a rapidly growing volume of LNG: 9.2 billion cubic feet per day in 1H2025, up from 7.4 Bcf/d in 2020, as Asian economies expand their gas imports. Piracy has risen alongside: 80 incidents were reported in the Malacca and Singapore straits in the first half of 2025 — the highest rate since 2015, according to the International Maritime Bureau — though none were categorized as serious.
What Makes the Strait of Hormuz the World’s Most Critical Energy Chokepoint?
The Strait of Hormuz is not the largest chokepoint by oil volume — Malacca is. But it is the most critical by consequence, for one reason: there is no viable alternative. The strait is the only sea exit for five of the world’s top ten oil producers — Saudi Arabia, Iraq, the UAE, Kuwait, and Iran. It also carries approximately 20% of all global LNG trade, primarily from Qatar (93% of whose LNG exports transit here) and the UAE (96%). A sustained closure would not merely raise oil prices — it would strand the majority of the world’s spare production capacity, most of which sits in Saudi Arabia.
Pipeline alternatives exist but are wholly inadequate. Saudi Arabia’s East-West pipeline and the UAE’s Abu Dhabi pipeline together provide roughly 4.7 mb/d of bypass capacity — versus 20 mb/d of normal Hormuz flow. In the current 2026 crisis, Saudi Arabia has diverted crude through the East-West pipeline to its Red Sea port at Yanbu, but the combined pipeline capacity covers less than a quarter of what normally flows through the strait.
In 2024, oil flow through Hormuz averaged 20.7 mb/d — equivalent to roughly 20% of all global petroleum consumption and one-quarter of all seaborne oil trade, according to EIA. 84% of that crude was destined for Asian markets, with China, India, Japan, and South Korea collectively receiving 74% of total Hormuz crude exports. In Q1 2026, Iranian action cut flows to approximately 14.6 mb/d — a decline of nearly 6 mb/d — pushing Brent crude above 45% higher than pre-conflict levels, according to EIA’s Q1 2026 Global Energy Security report.
How Did Houthi Attacks Halve Red Sea Trade — and What Went Around Africa Instead?
In November 2023, Yemen’s Houthi movement began attacking commercial vessels in the Red Sea in solidarity with Gaza. By 2024, the consequences were quantifiable and severe. Oil flows through Bab el-Mandeb — the southern gateway to the Red Sea — fell from 9.3 million barrels per day in 2023 to 4.1 million b/d in 2024, a 56% collapse. Suez Canal and SUMED pipeline flows fell from 8.8 mb/d to 4.8 mb/d over the same period. Container traffic through the Suez Canal fell from over 26,000 vessels in 2023 to approximately 13,000 in 2024 — a 50% drop.
The cargo that stopped going through Suez went around Africa instead. Oil flows through the Cape of Good Hope rose from 6.2 mb/d in 2023 to 9.3 mb/d in 2024 — a 50% increase in a single year. The Cape route adds 10 to 15 days to journeys between Asia and Europe, requires thousands of additional nautical miles, burns more fuel, and commands higher insurance premiums. War-risk insurance premiums for Red Sea transits rose to 4–5 times their previous level. The Bab el-Mandeb disruption effectively added a permanent surcharge to Europe-Asia trade for the duration of the crisis.
LNG was hit even harder than oil. LNG flows through the Suez Canal fell from 4.1 billion cubic feet per day in 2023 to just 0.5 Bcf/d in 2024 — a 90% collapse. LNG via Bab el-Mandeb fell to near zero. European buyers had to source LNG from alternative markets or reroute existing contracts around Africa, adding to European energy costs at a time when the continent was already managing the aftermath of Russian gas cutoffs.
The Red Sea corridor is also significant for food trade. Before the crisis, according to Chatham House data, the corridor carried approximately 20% of global rice exports and 15% of global wheat exports. The disruption of fertilizer, rice, and wheat shipments worsened food inflation and food insecurity in importing nations in Africa and the Middle East.
Why Did the Panama Canal Drought Shock Global Supply Chains in 2023–2024?
The Panama Canal does not carry large volumes of oil — EIA estimates roughly 3% of global maritime petroleum flows in FY2024. But it carries something arguably more strategically complex: a concentrated stream of high-value manufactured goods, US grain exports, LNG from the US Gulf Coast to Asia, and automobiles. It handles approximately 40% of all US container traffic and is the primary route for US LNG exports to Asian buyers, according to Al Jazeera and EIA data.
In 2023 and 2024, the worst drought on record in the Panama Canal watershed caused water levels in Gatún Lake — the freshwater reservoir that feeds the canal’s lock system — to fall sharply. The Panama Canal Authority restricted vessel numbers and reduced draft limits, cutting daily transits by more than 50% at the peak of the drought. Total vessel transits fell 42% from their 2023 level. The EIA fiscal year data shows oil flows dipped from 2.2 mb/d in FY2023 to 2.0 mb/d in FY2024.
By FY2025, rainfall returned to average and Panama Canal oil flows recovered to 2.3 mb/d. But the drought exposed a structural vulnerability that climate projections suggest will recur. The canal depends entirely on rainfall in a tropical watershed. The IPCC projects increased drought frequency in Central America under most warming scenarios. A canal that periodically loses half its capacity is a different asset than one that operates reliably year-round — and the global supply chains built around it are priced accordingly.
What Is the Taiwan Strait — and Why Is It a Hidden Chokepoint?
The Taiwan Strait is 130 kilometres wide at its narrowest — far broader than Malacca or Hormuz — but it handles more than 20% of global maritime trade by value annually, according to Al Jazeera, and nearly half the global container fleet transits it. Unlike Hormuz (oil) or Malacca (oil and bulk goods), the Taiwan Strait is primarily a container and semiconductor trade chokepoint.
Almost all advanced semiconductors in the world — including every chip manufactured by Taiwan’s TSMC at cutting-edge nodes — pass through this strait on their way to the global supply chain. A military conflict or naval blockade in the Taiwan Strait would not primarily affect oil prices. It would affect the global production of smartphones, cars, aircraft, data centres, and military hardware. The PMC peer-reviewed paper on chokepoint economic risk estimates the Taiwan Strait’s annual economic exposure at $37.3 billion — the highest of any individual chokepoint.
The EIA’s seven-chokepoint analysis does not include the Taiwan Strait because EIA focuses on energy trade. But by the metric of total trade value, the Taiwan Strait rivals or exceeds Hormuz in systemic importance. The difference is that Hormuz’s disruption would cause an immediate, visible price spike in petrol stations around the world within days. Taiwan Strait disruption would manifest more slowly — in production lines that run out of chips, in months-long delays to electronics manufacturing, in a global recession driven not by energy but by the absence of silicon.
What Changed in the Danish and Turkish Straits After the Ukraine War?
Two chokepoints that rarely appear in global headlines have been significantly reshaped by the war in Ukraine: the Danish Straits and the Turkish Straits (Bosphorus and Dardanelles).
The Danish Straits — a series of channels connecting the Baltic Sea to the North Sea — carried 4.9 mb/d of oil in 1H2025, roughly 60% more than in 2021. The surge reflects Russia’s rerouting of Baltic oil exports away from European buyers and toward Asia (primarily India and Turkey), combined with the replacement of Russian pipeline gas with US LNG into Northern and Central Europe. Russia is now the largest single exporter through the Danish Straits. US LNG tankers are the largest supplier of gas to countries east of the straits — a complete reversal of the energy geography that existed before 2022.
The Turkish Straits — the Bosphorus and Dardanelles connecting the Black Sea to the Mediterranean — carried 3.7 mb/d in 1H2025. The Bosphorus is less than a nautical mile wide at its narrowest point, passing directly through the city of Istanbul — one of the world’s most complex navigation environments. Over 45,000 vessels transited in 2024. Turkey, under the 1936 Montreux Convention, controls transit rights, and has restricted warship passage during the Ukraine conflict. Kazakhstan and Russia are the dominant oil exporters through the Turkish Straits; Turkey has become the primary transit hub for Russian oil reaching global markets outside of Europe.
- EIA — World Oil Transit Chokepoints (primary, March 2026 edition, directly fetched · complete data tables for all 7 chokepoints + Cape · 2020–1H2025 figures)
- EIA — “Amid regional conflict, the Strait of Hormuz remains critical oil chokepoint” (June 2025 · 20 mb/d 2024 · Saudi Aramco 38% of Hormuz crude · Asian destinations 84% · primary)
- IEA — Strait of Hormuz (primary · 20 mb/d in 2025 · Qatar 93% LNG via Hormuz · UAE 96% · 20% of global LNG trade · pipeline alternatives 2.6 mb/d)
- IER citing EIA Global Energy Security Data Report Q1 2026 — Hormuz Q1 2026: 14.6 mb/d · −28% from Q4 2025 · Brent up 45%+
- Wikipedia — “2026 Strait of Hormuz crisis” (Iran blockade Feb 28, 2026 · IRGC attacks · Maersk/CMA CGM/Hapag-Lloyd suspended · Houthi threat resumes · pipeline alternative capacities)
- Council on Foreign Relations — “Another Hormuz? The Red Sea’s Threat to the Global Economy” (June 2026 · 12-15% of global maritime trade via Red Sea · Houthi timeline · Bab el-Mandeb oil 9.3→4.1 mb/d)
- The Conversation — “From the Strait of Hormuz to Malacca, global trade relies almost entirely on these five narrow waterways” (April 2026 · academic analysis · Malacca 24% all trade · China 80% oil · Malacca Dilemma · Suez 26,000→13,000 vessels)
- Andaman Partners — “The World’s Trade Choke Points” (October 2025 · citing UNCTAD Review of Maritime Transport 2025 · Panama transits −42% · Bosphorus 40,000+ transits · 8.7% trade share figures)
- Baker Institute — “Maritime Chokepoints and Risks to Global Shipping” (March 2026 · Malacca 24 mb/d oil+gas · Panama 4-6% all trade · US LNG via Panama · Rystad energy data)
- PMC — “Systemic impacts of disruptions at maritime chokepoints” (peer-reviewed · Taiwan Strait $37.3B EVTD · economic risk $10.7B/year · Suez/Bab el-Mandeb/Malacca dominant risk)












