
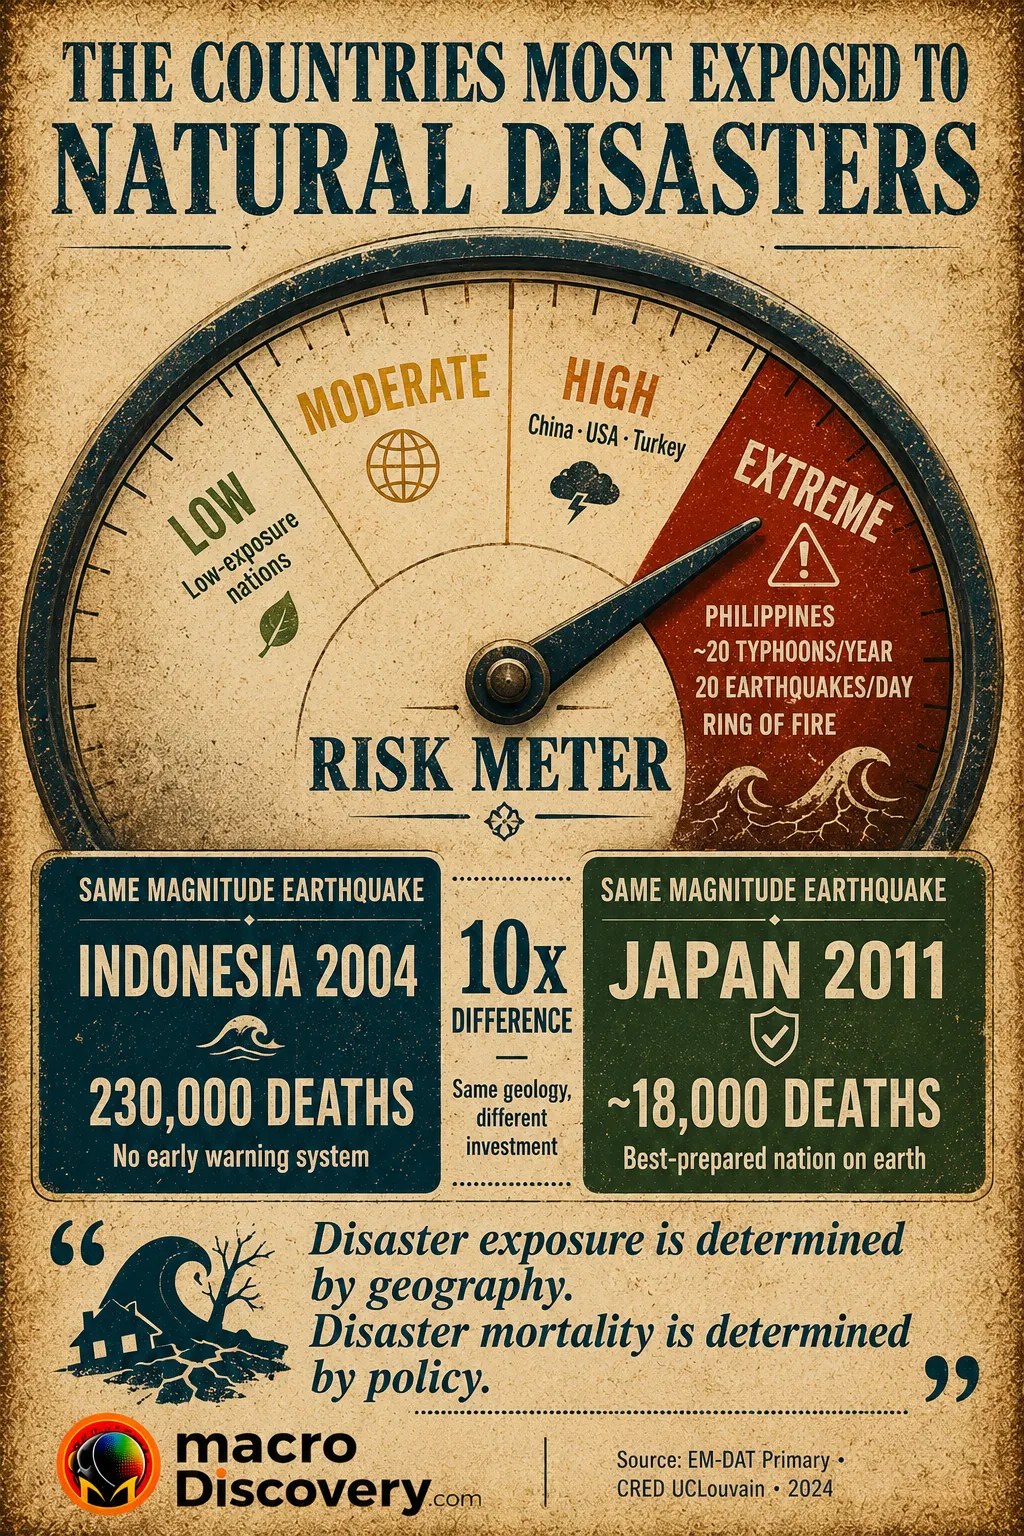
The Countries Most Exposed to Natural Disasters —
Mapped
The Philippines experiences approximately 20 typhoons per year — more than any other country — and records roughly 20 earthquakes every single day. Japan sits on the same Ring of Fire and faces equivalent geophysical exposure. But Japan’s investment in early warning systems, building codes, and evacuation drills means its disaster death tolls are dramatically lower. The 2004 Indian Ocean tsunami killed 230,000 people across 14 countries from a single event — largely because no early warning system existed in that ocean. The data tells a clear story: disaster exposure kills less than disaster unpreparedness.
| Country | Primary hazards | Exposure level | Preparedness | Outcome |
|---|---|---|---|---|
| 🇵🇭 Philippines | Typhoons (~20/yr) · earthquakes (~20/day) · volcanic eruptions · tsunamis | Extreme | Improving: risk reduction spending up since 2015. Deaths declining since Haiyan 2013. | Haiyan 2013: ~7,000 deaths. 2024: 43B pesos damage. 2025: 23 cyclones hit country. |
| 🇯🇵 Japan | Earthquakes · tsunamis · typhoons · volcanic eruptions | Extreme | “Best-prepared system in the world.” (PBS/Science News). Seismic monitoring, K-12 drills, GIS alerts, sea walls, ductile building codes. | 2011 Tohoku: ~18,000 deaths vs Indonesia 2004: 230,000 — same magnitude event. |
| 🇮🇩 Indonesia | Earthquakes · tsunamis · volcanic eruptions · floods | Extreme | Indian Ocean warning system built after 2004. Regional cooperation improved. Still significant capacity gaps. | 2004: epicentre of 230,000-death tsunami. 2018 Palu: 4,000+ deaths from localised tsunami with no warning. |
| 🇨🇳 China | Floods · typhoons · earthquakes · droughts | Very High | Significant infrastructure investment. Historically suffered highest absolute disaster death tolls; improving rapidly. | 2024: severely affected by Typhoon Yagi. Flood losses consistently among world’s largest. |
| 🇹🇷 Turkey | Earthquakes (North Anatolian Fault) | High | Building codes exist but enforcement gaps. 2023 quake revealed widespread non-compliance with seismic standards. | February 2023: magnitude 7.8 + 7.7 doublet killed 50,000+ in Turkey and Syria despite prior knowledge of risk. |
| 🇭🇹 Haiti | Earthquakes · hurricanes · floods | High | Severely limited capacity. Poorest country in Western Hemisphere. No meaningful earthquake preparedness in 2010. | 2010: magnitude 7.0 killed at least 100,000. Japan’s 9.0 in 2011 killed ~18,000 — smaller quake, far greater death toll. |
| 🇺🇸 United States | Hurricanes · tornadoes · wildfires · earthquakes · floods | High | Advanced warning systems. High absolute economic losses due to asset density. Low death rates relative to exposure. | 2024: Hurricanes Helene, Milton, Beryl among world’s costliest. Deaths low relative to storm intensity. |
Sources: EM-DAT primary (emdat.be, CRED UCLouvain, directly fetched) · CRED 2024 Disasters in Numbers (primary, files.emdat.be, April 2025) · Philippines: Statista citing PAGASA + Philippine authorities · Japan 2011: FIU Extreme Events Institute citing EM-DAT · Turkey 2023: multiple news sources · Haiti 2010: Earth Magazine citing USGS · US 2024: CRED 2024 annual report (primary).
Why the Philippines Experiences More Typhoons Than Any Country on Earth
Geography is the explanation. The Philippines sits directly in the main typhoon track of the western Pacific, the world’s most active tropical cyclone basin — and it occupies the most exposed position within it. Approximately 20 tropical cyclones enter the Philippine Area of Responsibility each year on average; in 2025, PAGASA recorded 23 by December. The archipelago also sits on the Pacific Ring of Fire, giving it an earthquake risk index of 9.7 out of 10 and a tsunami risk of 9.4 (Statista/Philippine authorities, June 2025) — and records roughly 20 earthquakes every single day. No other inhabited territory faces this specific combination of cyclonic, seismic, and volcanic exposure simultaneously. The 2013 Typhoon Haiyan (Yolanda) — one of the most powerful tropical cyclones ever recorded at landfall — killed approximately 7,000 people. Fatality rates have declined since as government risk-reduction spending increased.
Why it matters: the Philippines is the clearest case study of a country where geography makes disaster unavoidable — and where preparation determines whether it is survivable.
The 2004 Indian Ocean Tsunami: Why 230,000 People Did Not Have to Die
At 07:58 on December 26, 2004, a magnitude 9.1–9.3 earthquake off the west coast of Sumatra generated a tsunami that killed at least 230,000 people across 14 countries — the figure cited in EM-DAT (primary, emdat.be) and confirmed by the FIU Extreme Events Institute. The Indian Ocean had no deep-ocean tsunami warning system. No DART buoys, no automated alert network, no coordinated response. Tsunami waves travel at the speed of a jet aircraft in open ocean — fast enough to cross the Indian Ocean in hours — meaning coastal populations in Sri Lanka, India, Thailand, and ten other countries had no warning before walls of water destroyed entire coastlines. One-third of Banda Aceh, with a population of over 250,000, was washed away. The Pacific Ocean had possessed an early warning system since 1948. The Indian Ocean got one after 2004.
Why it matters: 230,000 deaths from a single preventable information failure is the clearest argument for investing in early warning infrastructure before disasters, not after.
The Japan Paradox: Why a Magnitude 9.0 Earthquake Killed 18,000 People Instead of 230,000
On March 11, 2011, a magnitude 9.0 earthquake — the same order as the 2004 Sumatra event — struck off the Tohoku coast of Japan, generating a devastating tsunami. It killed approximately 18,000 people. The 2004 event killed 230,000. Both were triggered by comparable earthquakes at similar offshore distances. The difference was preparation. Japan had seismic monitoring networks, mass mobile alerts, clearly marked evacuation routes, K-12 disaster drills, coastal sea walls, and building codes requiring ductile concrete construction. Scientists describe Japan as “arguably the best-prepared system in the world” (PBS NewsHour, Science News). The 2011 event remains catastrophic — no preparedness system removes all risk — but it demonstrates that the relationship between disaster exposure and disaster mortality is not fixed. It is a policy variable.
Fourteen months later, on March 11, 2011, a magnitude 9.0 earthquake — releasing roughly 250 times more energy than Haiti’s — struck Japan off the Tohoku coast. It killed approximately 18,000 people.
The geological difference does not explain the casualty difference. The last comparable earthquake in Haiti had occurred more than 200 years earlier — so no institutional memory of seismic risk had been built into the country’s building stock, governance, or population behaviour. Haiti is also the poorest country in the Western Hemisphere; investing in earthquake resilience competes with nutrition, medicine, and basic infrastructure.
Japan had spent decades preparing specifically for this scenario. The result was not the same outcome: it was 10 to 17 times fewer deaths from a far larger earthquake.
The gap between Haiti and Japan is not a gap in bad luck. It is a gap in institutional investment.
Sources: EM-DAT (primary) · Earth Magazine (March 2012, citing USGS) · PBS NewsHour · FIU Extreme Events Institute.
Why it matters: the size of the earthquake does not determine the size of the death toll — the level of preparedness does.
The Inequality of Disaster: Why Poor Countries Die More From the Same Events
The EM-DAT long-run data reveals a persistent pattern: rich countries suffer the highest absolute economic losses from natural disasters; poor countries suffer the highest death rates. The United States regularly records among the world’s largest disaster-related economic losses — Hurricanes Helene, Milton, and Beryl were among the costliest global events of 2024 — but its death tolls are low relative to storm intensity. The 2023 Turkey–Syria earthquake killed over 50,000 people from a magnitude 7.8 event, not because the earthquake was unpredictable — the North Anatolian Fault is one of the most studied seismic hazards in the world — but because building code enforcement had failed systematically for decades. Deaths from natural disasters have fallen dramatically over the 20th century (Our World in Data, EM-DAT basis): once exceeding a million per year, they now average 10,000–20,000 annually. That reduction is almost entirely the result of early warning systems, better infrastructure, and coordinated response — investments that are distributed as unequally as income itself.
Why it matters: disaster deaths are not natural — they are the result of policy choices about who receives the protection that preparedness provides.
- The Philippines averages approximately 20 typhoons per year entering its Area of Responsibility — more than any other country — plus roughly 20 earthquakes every single day (PAGASA + Philippine authorities).
- EM-DAT recorded 393 disasters globally in 2024, killing 16,753 people and affecting 167.2 million (CRED 2024 Disasters in Numbers, primary).
- The 2004 Indian Ocean tsunami killed 230,000 people across 14 countries from a single earthquake — the Indian Ocean had no early warning system at the time (EM-DAT primary, cited by FIU EEI).
- Japan’s 2011 magnitude 9.0 earthquake killed ~18,000 people; Indonesia’s comparable 2004 earthquake killed 230,000 — a 10x difference attributable to preparedness.
- Haiti’s 2010 magnitude 7.0 earthquake killed at least 100,000 people; Japan’s 2011 magnitude 9.0 killed ~18,000 — the smaller quake caused far more deaths.
- Deaths from natural disasters have fallen from over 1 million per year in the 20th century to approximately 10,000–20,000 annually — almost entirely due to early warning systems and better infrastructure.
- Rich countries suffer the highest economic losses; poor countries suffer the highest death rates — the same disaster has systematically different consequences depending on the resources available to prepare for it.
The Philippines cannot move off the Ring of Fire. Japan cannot stop earthquakes. The difference between 230,000 deaths and 18,000 deaths from the same magnitude event is not geology — it is governance, investment, and institutional memory. The 2004 Indian Ocean tsunami killed 230,000 people partly because no one built an early warning system for that ocean, even though the technology existed. The data from EM-DAT, accumulated since 1900, tells the same story across thousands of events: disaster exposure is determined by geography; disaster mortality is determined by policy. One of those is fixed. The other is a choice.
- EM-DAT — The International Disaster Database (primary · directly fetched · emdat.be · “over 27,000 mass disasters from 1900 to present” · CRED at UCLouvain Belgium · established 1988 with WHO · open access for non-commercial use)
- CRED — 2024 Disasters in Numbers (primary · directly retrieved PDF · April 2025 · “A Hot and Stormy Year: 393 Reported Disasters, 16,753 Deaths, 167.2 Million Affected” · Typhoon Yagi Myanmar 460/Vietnam 345 deaths · Brazil floods $7B · US hurricanes Helene/Milton/Beryl among costliest)
- FIU Extreme Events Institute — Indonesia vs Japan (EM-DAT basis · 2004 Indian Ocean tsunami: “at least 230,000 people (EM-DAT)” · 14 countries · “Indian Ocean lacked DART buoys” · $10B+ damage · one-third of Banda Aceh washed away · 2011 Japan vs 2004 comparison)
- Columbia Earth Institute — Tsunami Early Warning Systems (August 7, 2025 · “The 2004 Indian Ocean tsunami… claiming over 230,000 lives across 14 countries” · Japan 2011 ~18,000 deaths confirmed · 27-country Indian Ocean system created after 2004 · Japan preparedness features)
- Statista — Natural Disasters in the Philippines (June 2025 · citing Philippine authorities · “around 20 tropical cyclones enter the Philippine Area of Responsibility” each year · “20 earthquakes every single day” · earthquake risk 9.7/10 · tsunami 9.4/10 · Haiyan ~7,000 deaths)
- Philippine Daily Inquirer citing PAGASA — 2025 Natural Disasters (December 2025 · 23 tropical cyclones in 2025 confirmed · 20+ million Filipinos affected by cyclones · Uwan, Crising, Dante, Emong, Nando, Opong confirmed · NDRRMC data)
- Our World in Data — Natural Disasters (EM-DAT basis · deaths fell from millions/year in 20th century to 10,000–20,000/yr average last decade · disaster damages ~0.2% global GDP · storms dominate economic losses · rich countries: highest costs; poor: highest death rates)












