The Global Tea Economy
Tea is the second most consumed beverage on Earth after water. Here is how it gets from field to cup.
Global tea production reached about 7.3 million tonnes in 2025. China grows roughly 54%. About 72% of the crop is consumed inside the countries that produce it. Most of the value is captured after the leaf leaves the farm.
Three numbers
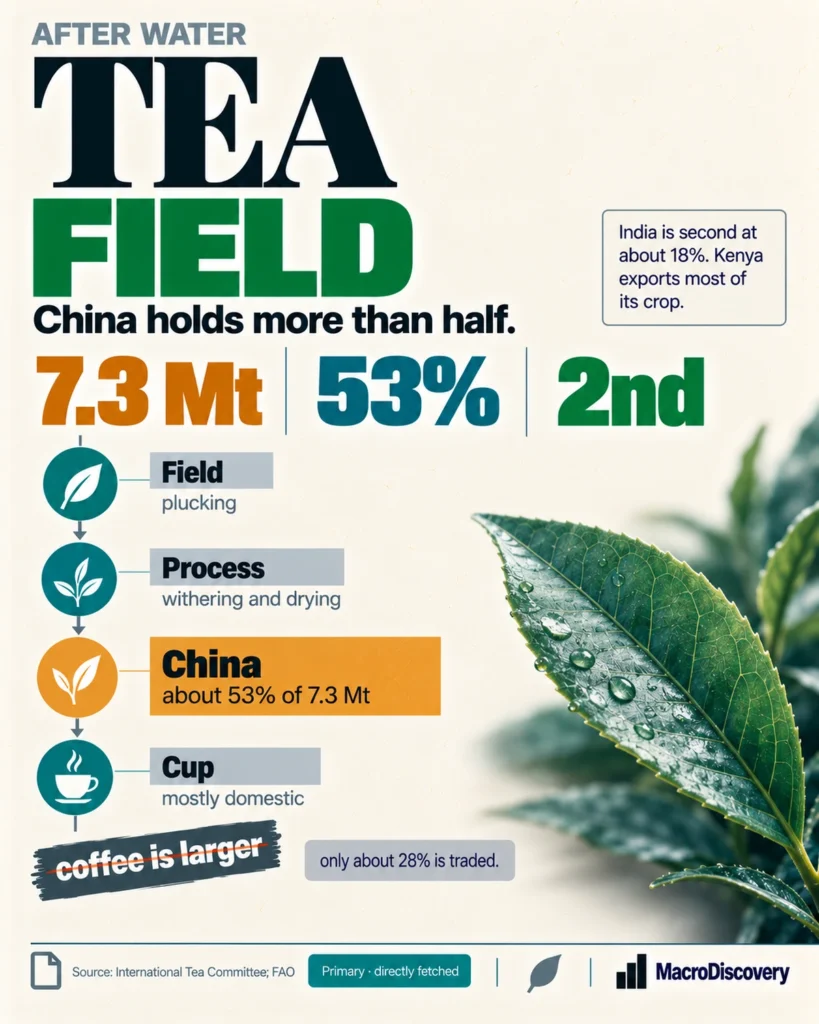
- 7.3 million tonnes — global made-tea production in 2025. Source: International Tea Committee.
- 54% — China’s share of world production. India is next at roughly 19%, Kenya at about 8%. Source: ITC / industry reports.
- 72% — share of global production retained for domestic consumption inside producing countries. Source: Tea & Coffee Trade Journal / ITC.
What the data shows
A common claim is that tea is a globally traded commodity whose value is set at the farm gate. The fact is that most tea never leaves the country that grows it, and most of the retail price is captured after the leaf is processed, blended, packed and branded. Global production reached about 7.3 million tonnes in 2025. China accounts for roughly 54%, India about 19%, and Kenya about 8%. The top producers dominate volume, but the economics of the final cup are decided further down the chain.
Roughly 72% of the crop is consumed inside the producing countries. China’s green-tea output is largely retained for its domestic market. India consumes most of its black tea at home. Only about 28% is exported. Kenya is the largest exporter by volume and supplies much of the traded black tea that ends up in bags sold elsewhere. Auction prices for commodity CTC tea remain low relative to the price of a finished packet or a cup in a café. Processing, blending, packaging, marketing and retail margins absorb the larger share of the final price.
The path from field to cup therefore runs through several stages: plucking, withering, rolling or CTC processing, drying, auction or direct sale, blending, packing, and retail. Each stage adds cost and captures margin. The leaf itself is a small fraction of the retail price of a branded tea bag. High-end orthodox and single-estate teas can escape the low auction band, but the bulk of global volume moves through the commodity channel. The second-most-consumed beverage after water is grown in a handful of countries and priced mostly after it leaves the farm.
| Stage | What happens |
|---|---|
| Field | Plucking of two leaves and a bud. Concentrated in China, India, Kenya. |
| Factory | Withering, rolling or CTC, oxidation (for black), drying to made tea. |
| Auction / trade | Bulk sale. Kenya is the largest exporter by volume. |
| Brand / packer | Blending, packaging, marketing. Captures most of the retail margin. |
| Cup | Retail or café. The leaf is a small share of the final price. |
Production figures from International Tea Committee and industry reports for 2025. Domestic retention share from ITC summaries. Value-chain margins vary by market and product grade.
How it was measured
Production totals and country shares come from the International Tea Committee’s statistical bulletin and related industry reports for 2025. Domestic retention is calculated as production minus exports for the major producers, then aggregated. Value-chain observations are drawn from auction price comparisons and retail margin studies. The claim that tea is primarily an export commodity is contradicted by the retention share: most volume is consumed where it is grown.
What it means
It is settled that global production is about 7.3 million tonnes, that China produces roughly half, and that most tea is consumed domestically. It is settled that commodity auction prices are low relative to retail. It is not settled that every producer or every grade captures the same share of the final price. Use 7.3 million tonnes for production. Use 54% for China’s share. Use 72% for domestic retention. Do not treat the farm-gate price as the main determinant of the price of a cup.
Common misreadings
- Most tea is not exported. About 72% is consumed inside the countries that grow it.
- China is the largest producer, but Kenya is the largest exporter by volume of black tea.
- The leaf is a small fraction of the retail price of a branded tea bag.
Where the numbers come from
How we built this
- Dataset: International Tea Committee for production and trade volumes. Industry reports for domestic retention shares.
- Scope: Made tea (processed leaf). Commodity channel distinguished from high-end orthodox. Value capture after the farm noted as the dominant margin.
- Figures: 7.3 million tonnes is 2025 production. 54% is China’s share. 72% is domestic retention. The leaf is a small fraction of the final retail price.