Ultra-Processed Food
60% of calories in the American diet come from ultra-processed food. Here is what that does to the body.
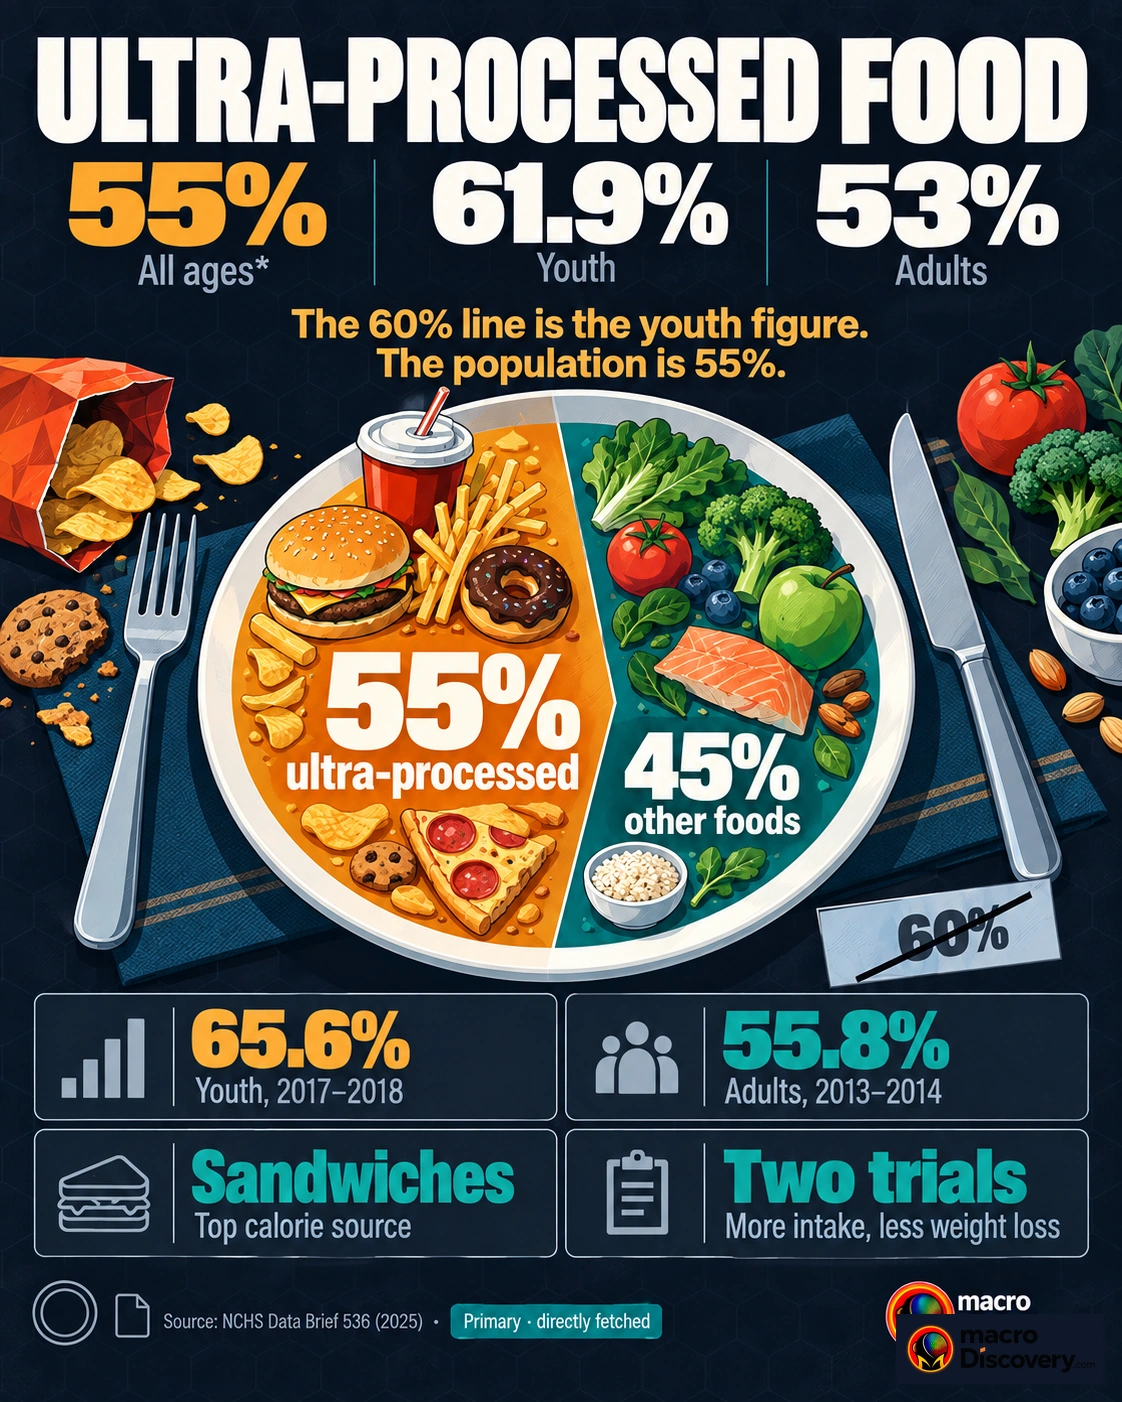
The 60% line is the youth figure. Adults were at 53%. The causal body result is a two-week trial in 20 people.
Three numbers
- 53.0% — mean share of calories from ultra-processed food in US adults, August 2021 to August 2023. Source: CDC.
- 61.9% — the same share for youth ages 1 to 18. Overall, age 1 and older, 55.0%. Source: CDC.
- 508 calories — extra eaten per day on an ultra-processed menu, in a 20-person inpatient trial. Weight gain 0.9 kg in two weeks. Source: NIH, Hall and others, 2019.
What the data shows
A common claim is that 60% of calories in the American diet come from ultra-processed food, and that this is what it does to the body. The fact is that 60% is the youth figure, and the body evidence is a two-week trial. CDC data from the National Health and Nutrition Examination Survey, for August 2021 to August 2023, put the mean at 55.0% of calories for people age 1 and older. Adults age 19 and older were at 53.0%. Youth ages 1 to 18 were at 61.9%. Children ages 6 to 11 were at 64.8%. The share has edged down. Youth fell from 65.6% in 2017–2018. Adults fell from 55.8% in 2013–2014. The 60% line is a rounded youth number, used as the national diet.
The causal result is narrower than the headline. In 2019, Kevin Hall and colleagues admitted 20 adults to the National Institutes of Health and fed each person an ultra-processed diet and a minimally processed diet for two weeks, in random order. The meals were matched for presented calories, sugar, fat, salt, fiber, and macronutrients. People could eat as much as they wanted. On the ultra-processed menu they ate about 508 extra calories a day and gained 0.9 kg. On the other menu they lost 0.9 kg. That is overeating and weight in a closed ward. It is not a map of cancer, heart disease, or the gut. Those links come from surveys that cannot separate the food class from income, smoking, and exercise.
The class is a recipe rule, not a nutrient. Both the CDC and the trial use NOVA. A food is ultra-processed if industrial ingredients dominate, such as hydrogenated oils, flavorings, and emulsifiers. A packaged bread and a soda can sit in the same class. The calorie share is a class share. It does not say every item in the class does the same thing to a body. Income did not change the youth share. Among adults, the highest income group was lower, at 50.4%, against about 55% in lower income groups.
The 60% bar is the claim. It matches youth, not adults.
| Count | Figure | What it is |
|---|---|---|
| Adults, 2021–2023 | 53.0% | Calories from ultra-processed food |
| Youth, 2021–2023 | 61.9% | The neighborhood of the 60% line |
| Age 1 and older | 55.0% | Combined mean |
| Extra calories, trial | 508 a day | 20 adults, two weeks |
| Weight change, trial | 0.9 kg | Gain on ultra-processed, loss on the other |
How it was measured
NHANES asks people what they ate, then codes the foods. A recall is not a weighed plate. The CDC mean is a share of reported calories, not a count of packages. The same person can under-report a snack and over-report a meal. The trend compares survey waves. A fall from 55.8% to 53.0% in adults is a small move, not a new diet.
The Hall trial locked 20 people in a ward for 28 days and switched the menu at two weeks. Presented calories were matched. Eaten calories were not, because people could take more. Twenty people and two weeks cannot rank diseases. A survey link between the food class and illness is not this trial.
What it means
It is settled that adults got 53% of calories from ultra-processed food in the latest CDC window, youth 61.9%, and that 20 inpatients ate about 508 extra calories a day on the ultra-processed menu. It is not settled that 60% is the American diet, or that the class has a known effect on every organ. Use 53% for adults. Use 61.9% for youth. Use 508 for the trial. Do not use 60% as the national figure.
Common misreadings
- 60% is the youth share, rounded. Adults were at 53%.
- The trial shows two weeks of overeating and 0.9 kg. It is not a disease map.
- NOVA is a recipe class. A bread and a soda can sit in the same bar.
Where the numbers come from
How we built this
- Dataset: CDC NHANES ultra-processed calorie shares, August 2021–August 2023; Hall and others, 2019 inpatient trial.
- Scope: Calorie share and the one randomized overeating result. Disease associations from surveys are not treated as causal.
- Figures: 53% is adults. 61.9% is youth. 508 is the trial. 60% is treated as a rounded youth figure.