Home AI Technology Gaming Future Automobile Geography Top 10 Trending How To Discover
---Advertisement---

Ranked: The Countries Winning the Green Energy Race

Macro Discovery
On: August 14, 2026 7:20 AM
Follow Us:
---Advertisement---
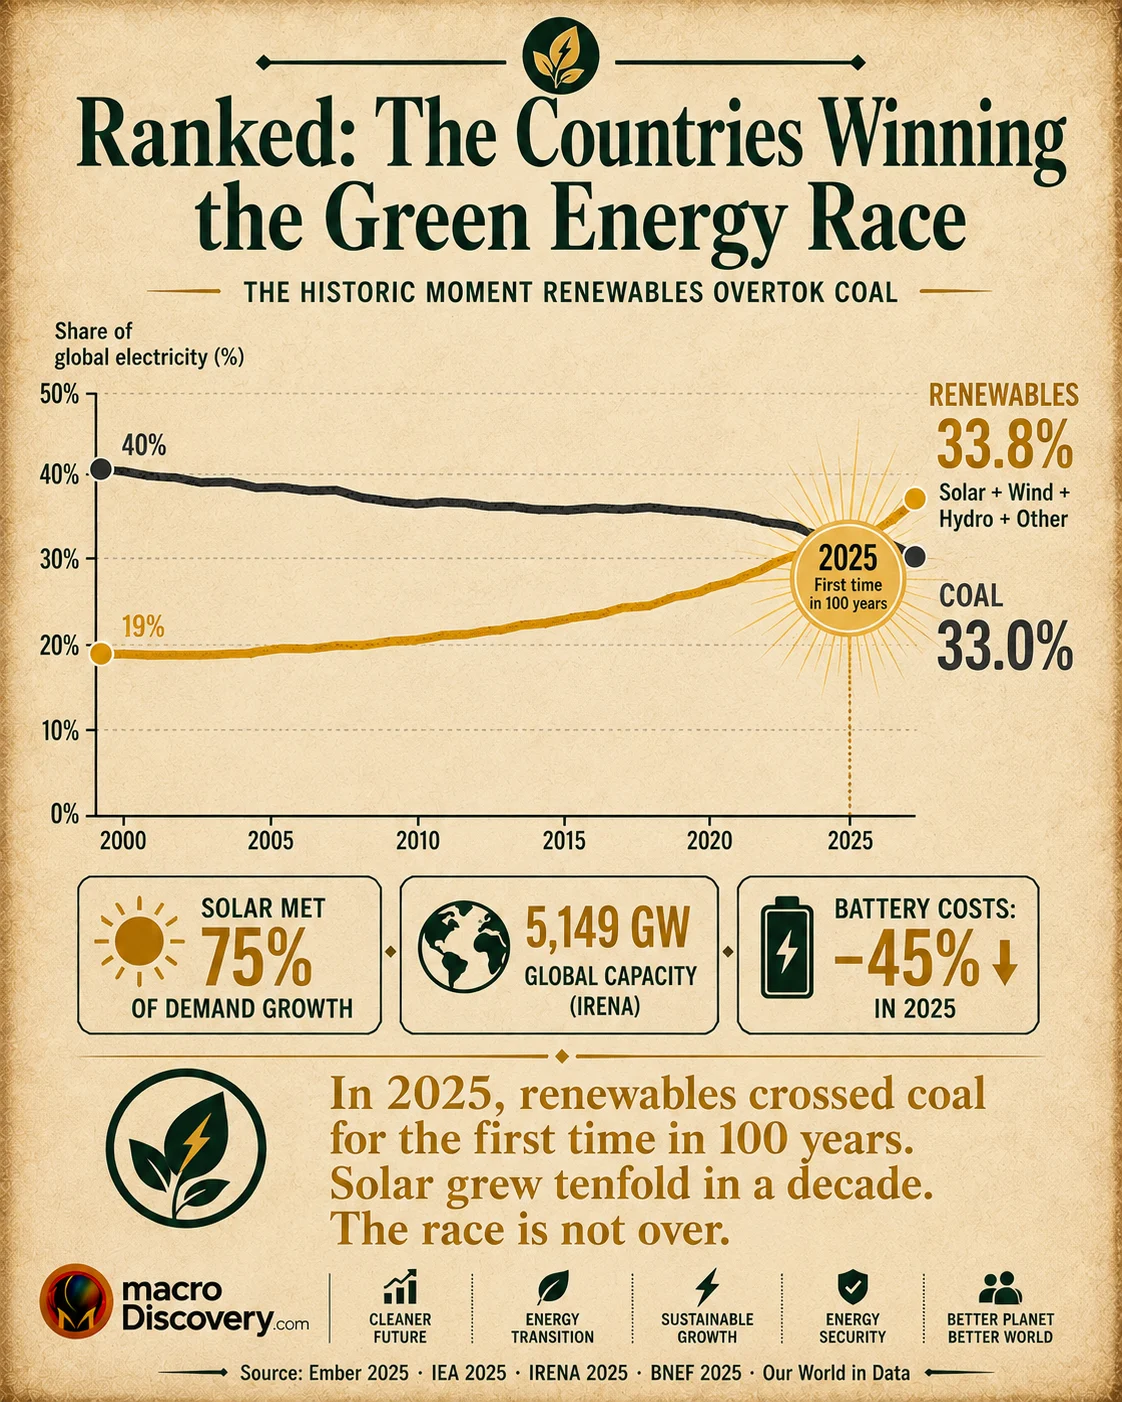
Premium editorial infographic showing
a crossed-lines chart of two percentage
lines tracking shares of global
electricity from 2000 to 2025. The
renewables line (solar gold) rises from
approximately 19% in 2000, accelerating
sharply from 2015 onward to reach
33.8% in 2025. The coal line (dark
grey) falls from approximately 40% in
2000 to 33.0% in 2025. The two lines
cross in 2025, highlighted with a gold
starburst labelled "2025 — First time
in 100 years." Below the chart, three
callouts show: solar met 75% of demand
growth, global capacity reached 5,149
GW (IRENA), and battery costs fell 45%
in 2025. Based on EMBER Global
Electricity Review 2026 (primary,
ember-energy.org, April 21, 2026) and
IRENA Renewable Capacity Statistics
2026 (primary, March 31, 2026). Countries Winning the Green Energy Race.
Countries Winning the Green Energy Race
Countries Winning the Green Energy Race , Which country has the most renewable energy in the world? , What percentage of the world’s electricity comes from renewable energy? , What country is growing renewable energy the fastest? , Has renewable energy overtaken fossil fuels? , Will the world reach the COP28 renewable energy tripling target by 2030? , Renewable Energy by Country 2025-2026 — Who’s Winning , which country has most renewable energy 2025 2026 China India US solar wind installed capacity GW , renewable energy percentage world electricity 2025 statistics EMBER IRENA solar overtook coal primary , COP28 renewable energy tripling target 2030 progress gap 11TW current pace insufficient data , which country has the most renewable energy in the world 2025 2026 , what percentage of the world’s electricity comes from renewables solar wind 2025 2026 statistics , has renewable energy overtaken fossil fuels globally coal 2025 data , will the world meet the COP28 renewable energy target by 2030 , what country is growing renewable energy the fastest solar China India ,
Ranked: The Countries Winning the Green Energy Race — MacroDiscovery
MacroDiscovery
Energy & Climate · 5 min read · EMBER Apr 2026 · IRENA Mar 2026 · IEA · Primary Sources
EMBER — Global Electricity Review 2026 (PRIMARY · ember-energy.org · directly fetched · April 21, 2026 · 215 countries · 93% of global electricity demand) · IRENA — Renewable Capacity Statistics 2026 (PRIMARY · irena.org · March 31, 2026 · end-2025 data) · IEA — Renewables 2025 (PRIMARY · iea.org)
Renewable Energy · Global Rankings · 2025 Data

Ranked: The Countries Winning
the Green Energy Race

For the first time in 100 years, renewables overtook coal in the global electricity mix in 2025 — 33.8% to 33.0%. Solar alone met 75% of all demand growth on Earth. China built 58% of the world’s new solar and 72% of new wind in a single year. India surpassed the US in solar installations for the first time. Global renewable capacity reached 5,149 gigawatts. Here is the full ranking.

By MacroDiscovery
Source: EMBER Global Electricity Review 2026 (PRIMARY · April 21, 2026) · IRENA Renewable Capacity Statistics 2026 (March 31, 2026)
Milestone: “First time in 100 years” — renewables overtook coal · EMBER verbatim
33.8%
renewables’ share of global electricity in 2025 · overtook coal (33.0%) for first time in 100 years · EMBER primary
5,149 GW
total global renewable capacity end-2025 · +692 GW record addition · IRENA Renewable Capacity Statistics 2026
75%
of global demand growth met by solar power alone in 2025 · solar + wind met 99% · EMBER primary
11 TW
COP28 target: triple global renewable capacity to 11 TW by 2030 · current: 5.149 TW · pace still insufficient · IEA/IRENA
Visualization 01 — Country Rankings · 2025 Data
Who Is Winning the Green Energy Race

Ranked by total renewable energy installed capacity and 2025 additions. Bar width scaled to China’s 2,340 GW total. Power is measured in gigawatts (GW) of installed capacity — the maximum potential output of all renewable power plants combined. Sources: IRENA Renewable Capacity Statistics 2026 (primary · irena.org · March 31, 2026 · end-2025 data) · EMBER Global Electricity Review 2026 (primary · ember-energy.org · April 21, 2026) · China National Energy Administration (primary · end-2025).
Dominant — building >50% of global additions
Strong — major capacity and investment
Rising fast — accelerating beyond expectations
Clean grid — high renewable share of electricity
🇨🇳 China58% of global solar · 72% of wind
2,340 GW total renewable capacity (60% of national power) · Wind+solar: 1,840 GW — surpassed China’s coal capacity in 2025 for the first time · solar+wind share: 22% of Chinese electricity, surpassing the OECD average · fossil generation fell 56 TWh (-0.9%) — first fall since 2015 · Xi’s 1,200 GW wind+solar 2030 target: achieved roughly five years early
2,340 GWtotal renewable
🇺🇸 United StatesDistant #2
~420 GW+ total renewable capacity · Added 34.0 GW solar (+19.2%) in 2025 · Inflation Reduction Act driving record private investment · ~26% of US electricity from renewables · North America added 42.1 GW in 2025 (+7.4%) · India surpassed the US in solar capacity additions in 2025 for the first time
~420 GW+incl. wind, solar, hydro
🇮🇳 IndiaRising faster than expected
Added 37.0 GW solar + 6.3 GW wind in 2025 — exceeding the US in solar additions for the first time ever (EMBER primary) · fossil generation fell 52 TWh (-3.3%) — 4 consecutive years of fossil growth reversed · 196 GW of wind+solar under construction · third-largest fossil power country turning clean fastest
~230 GW+43.3 GW added 2025
🇪🇺 European UnionPolicy leader
934 GW total renewable capacity (+76.8 GW / +9.0% in 2025) — 18.1% of global renewable total · Germany: +20.5 GW, largest single-country adder in Europe · In June 2026, a quarter of EU power came from solar for the first time · EU’s entire electricity demand now matched by global solar generation in scale
934 GW+76.8 GW in 2025
🇧🇷 BrazilCleanest major grid
Wind+solar: 27% of Brazil’s electricity — well above the global average of 17% and Latin America’s 19% · ranked 4th globally in wind generation, 6th in solar generation · vast hydro base makes Brazil one of the world’s cleanest major electricity systems · 10 GW solar + 2 GW wind added in 2025
27%wind+solar share
🇦🇺 Australia · 🇨🇱 ChileBattery front-runners
Both installed enough grid-level battery storage in 2025 to shift over 50% of new solar generation from midday to other hours (EMBER primary) · already seeing “benefits in lower power prices and reduced curtailment” · leading the world in demonstrating that “anytime solar” works at grid scale
>50%solar generation shifted
🌍 Middle East & AfricaFastest growth rates
Middle East: +28.9% (+12.7 GW), led by Saudi Arabia · Africa: +15.9% (+11.3 GW) — “the highest in the continent’s history” · led by Ethiopia, South Africa, and Egypt · IEA forecasts Africa and South/Central America to see the majority of their energy supply growth from renewables through 2030
+28.9%Middle East growth
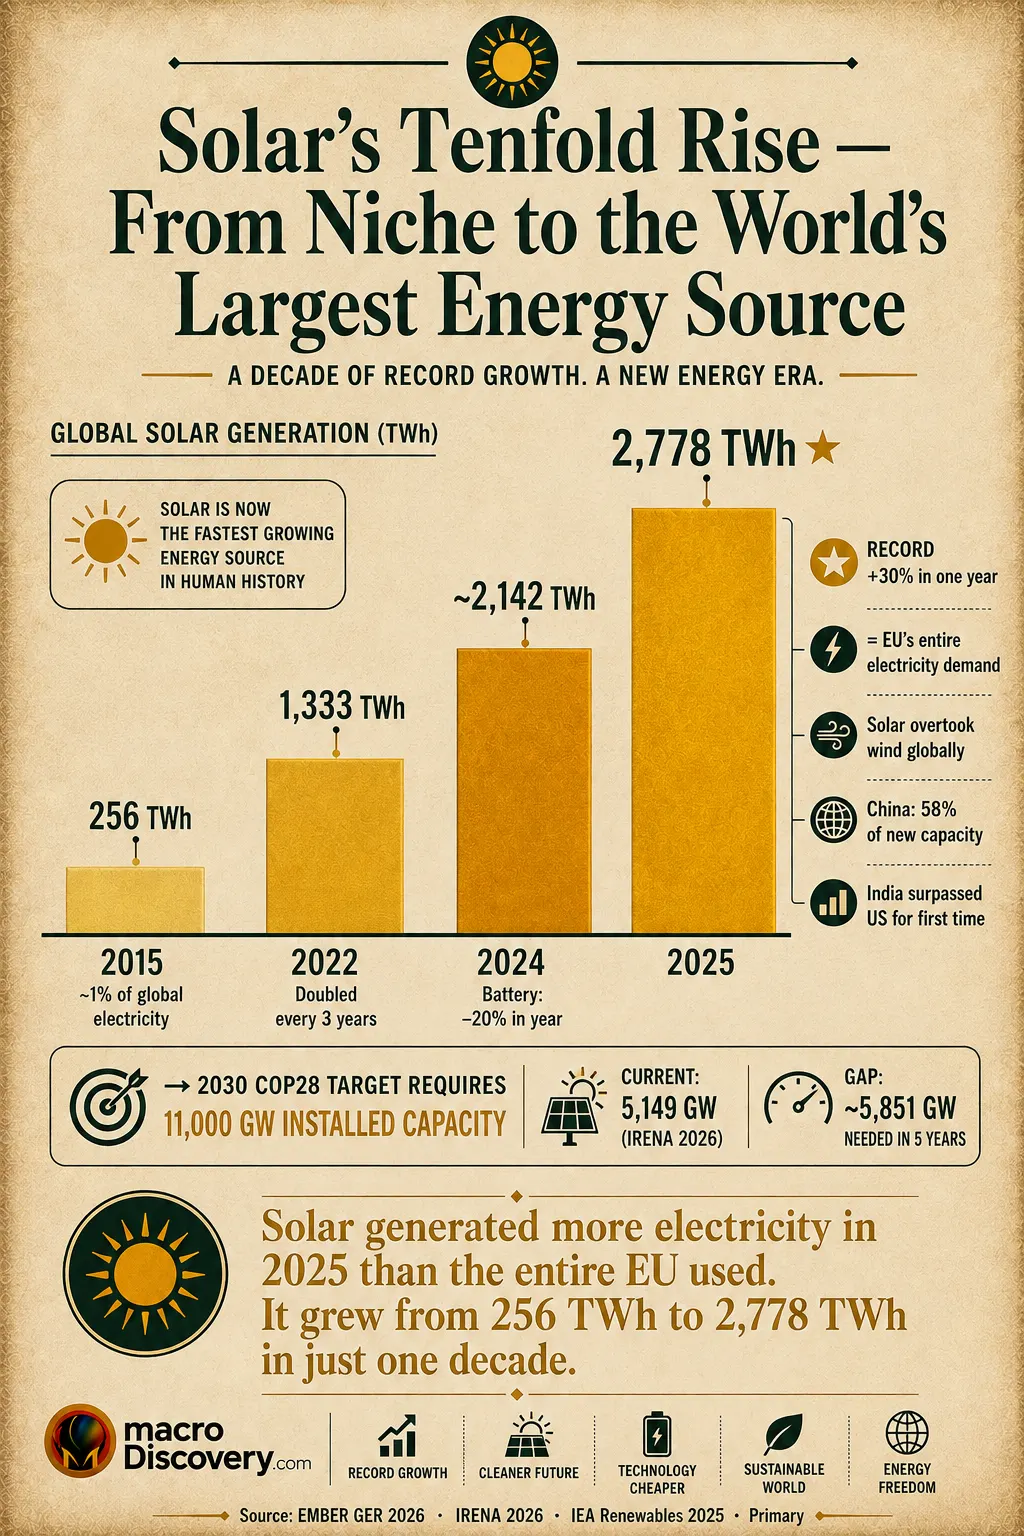
Premium editorial infographic showing four horizontal bars of increasing width representing global solar power generation from 2015 to 2025. The 2015 bar (pale gold, very short) shows 256 TWh — approximately 1% of global electricity. The 2022 bar shows 1,333 TWh, illustrating solar's tendency to double roughly every three years. The 2024 bar shows approximately 2,142 TWh alongside a note that battery costs fell 20% in that year. The 2025 bar (vivid bright gold, full width) shows 2,778 TWh — marked with a star as a record +30% annual increase. Annotations on the 2025 bar note: equals EU's entire electricity demand; solar overtook wind globally; China built 58% of new solar capacity; India surpassed the US for the first time. Below the bars, a horizontal target line shows the COP28 2030 target of 11,000 GW installed capacity versus the current 5,149 GW, highlighting the gap of approximately 5,851 GW needed in five years. Based on EMBER, IRENA, and IEA primary data.
Countries Winning the Green Energy Race
Visualization 02 — The Solar Decade · 2015 to 2026
From 256 Terawatt-Hours to a Third of Global Electricity — How Fast Solar Actually Grew

Solar power has grown more than tenfold in a decade. Each step in this timeline represents a milestone in what EMBER calls the world’s fastest-scaling energy technology. Source: EMBER Global Electricity Review 2026 (primary · ember-energy.org · directly fetched · April 21, 2026). A terawatt-hour (TWh) is one billion kilowatt-hours — enough to power roughly 90 million average US homes for a month.

2015
Niche
Global Solar Generation: 256 TWh. A Rounding Error in the World’s Electricity System.
In 2015, solar power generated 256 terawatt-hours of electricity globally. That sounds large but it represented roughly 1% of global electricity generation. Wind was already far larger. Coal was utterly dominant. Solar panels were getting cheaper but still considered niche — a technology for rooftops in California and Germany, not a force that would reshape the global energy system within a decade. The IRENA projection at the time for 2025 solar generation was considered optimistic. Reality would blow past it.
256 TWh globally~1% of electricityCoal still unchallenged
2022
Doubling
Solar Doubles to 1,333 TWh. China Begins Its Extraordinary Build-Out. Battery Costs Start Falling Fast.
Solar crossed 1,000 TWh for the first time in 2022. The technology was no longer niche — it was the fastest-growing energy source in human history. China had become the world’s dominant solar panel manufacturer, making panels cheaper for everyone. Russia’s invasion of Ukraine forced European governments to accelerate renewable deployment for energy security. The IRA passed in the US, redirecting hundreds of billions in private investment to clean energy. Solar had been doubling roughly every three years — and showed no sign of slowing.
1,333 TWh — doubledChina: dominant manufacturerIRA passed · US
2024
Acceleration
Battery Costs Fall 20% in a Single Year. The Transition from Daytime Solar to “Anytime Solar” Begins.
The energy transition entered a new phase in 2024. Battery storage costs fell 20% in a single year — the steepest decline in a decade. For the first time at scale, solar-plus-storage was outcompeting fossil fuels on cost without subsidy in many markets. China’s wind and solar capacity combined surpassed 1,400 GW. The US added a record 45 GW of solar. The structural dynamics of the global power system were visibly shifting. Coal generation began its first meaningful decline in emerging markets.
Battery costs: –20%China: 1,400 GW wind+solarUS: 45 GW solar record
2025
Milestone
The Year Everything Changed. Renewables Overtook Coal. Solar Reached 2,778 TWh — Equal to the EU’s Entire Electricity Demand.
In 2025, solar generation reached 2,778 TWh — a 30% increase in a single year, and more than tenfold its 2015 level. Solar overtook wind for the first time globally. Together, solar and wind met 99% of all new global electricity demand growth, keeping fossil generation essentially flat for the first time since the pandemic. For the first time in 100 years, renewables (33.8%) overtook coal (33.0%) in the global electricity mix. Battery costs fell a further 45%. India surpassed the US in solar additions for the first time. China’s fossil generation fell — for the first time since 2015.
2,778 TWh (+30%)33.8% > 33.0% coal“First time in 100 years”Battery: –45%India > US solar
2026
Next
Solar and Wind Expected to Overtake Nuclear in 2026. EU: 25% of Power from Solar in June. COP28 Tripling Target Still Out of Reach.
EMBER projects both solar and wind to overtake nuclear in 2026 — a symbolic threshold that would have seemed impossible a decade ago. In June 2026, a quarter of EU electricity came from solar for the first time. The global renewable pipeline is 4.9 TW — but reaching the COP28 target of 11 TW by 2030 still requires roughly doubling current capacity in five years, at a pace the IEA and IRENA both say is currently insufficient. The era of clean growth has arrived. Whether it arrives fast enough is a different question.
Solar + wind > nuclear 2026EU: 25% solar June 2026COP28 gap: 5.149 TW → 11 TW

The most important energy statistic of 2025 is not about a single country or a single technology. It is about a threshold. For the first time in 100 years, renewable energy generated more of the world’s electricity than coal. That sentence contains a century of industrial history, a generation of climate policy, and a decade of extraordinary cost reduction in solar panels and batteries. It happened faster than almost anyone predicted.

EMBER — Global Electricity Review 2026 · PRIMARY · ember-energy.org · directly fetched · April 21, 2026
33.8%
“For the first time in 100 years, renewables (33.8%, 10,730 TWh) overtook coal power (33.0%, 10,476 TWh) in the global electricity mix.” — EMBER primary, April 21, 2026
Solar alone met 75% of the net increase in global electricity demand in 2025. Together with wind, the two sources met almost all — 99% — of demand growth. Fossil generation recorded a small fall of 38 TWh (-0.2%): the first time since the pandemic, and only the fifth time this century, that fossil electricity did not rise. The scale of solar’s growth is striking: global solar generation is now the same size as the total electricity demand of the European Union. Solar has been doubling roughly every three years since 2015, when global solar generation was just 256 TWh.
Source: EMBER — Global Electricity Review 2026 (PRIMARY · directly fetched · ember-energy.org/latest-insights/global-electricity-review-2026 · April 21, 2026 · 215 countries · 93% of global electricity demand · “33.8%, 10,730 TWh overtook coal power 33.0%, 10,476 TWh” · “for the first time in 100 years” · “solar power alone met 75% of the net increase in electricity demand” · “solar + wind met almost all (99%) demand growth”)

“We have firmly entered the era of clean growth. Clean energy is now scaling fast enough to absorb rising global electricity demand, keeping fossil generation flat before its inevitable decline.”

— Aditya Lolla, Managing Director, Ember · Global Electricity Review 2026 (primary · ember-energy.org · April 21, 2026)

The China Question — When One Country Builds Most of the World’s Clean Energy

No discussion of the green energy race is honest without confronting the China question. In 2025, China built 58% of the world’s new solar capacity and 72% of its new wind capacity. Its wind and solar installations alone surpassed China’s own coal capacity for the first time. Its solar and wind share of electricity — 22% — crossed the OECD average. Its fossil electricity generation fell for the first time since 2015. These are extraordinary numbers. They are also almost entirely the result of one government’s sustained industrial policy. China is not leading the green energy race by a margin. It is lapping the field. And the cheap solar panels its manufacturers produce are making the transition cheaper for every other country on Earth — a fact that complicates simple narratives about economic competition and clean energy.

Why it matters: the green energy transition depends on solar panels getting cheaper — and China makes most of them. The geopolitics of clean energy cannot be separated from the geopolitics of Chinese manufacturing.
EMBER GER 2026 (PRIMARY) · IRENA Renewable Capacity Statistics 2026 (PRIMARY) · China NEA
58/72%
China built 58% of the world’s new solar capacity and 72% of new wind in 2025. India surpassed the US in solar capacity additions for the first time. The green energy race has an Asian axis.
IRENA confirmed global renewable capacity reached 5,149 GW by end-2025 — with +692 GW added in a single year, the “highest annual increase in absolute terms” ever recorded. Solar accounted for 511 GW of that (+27.2%), comprising 75% of all new renewable additions. Wind added 159 GW (+14.0%). Europe added 76.8 GW, with Germany’s 20.5 GW the largest national total. India’s 43.3 GW (37 solar + 6.3 wind) pushed past the United States’ 34 GW — a historical first. The Middle East grew 28.9%, led by Saudi Arabia. Africa grew 15.9% — its fastest ever.
Source: EMBER — Global Electricity Review 2026 (PRIMARY · April 21, 2026 · “China once again led solar build-out, recording more than half of the global increase in both solar capacity and solar generation in 2025” · “India installed more new solar capacity than the United States for the first time”) · IRENA Renewable Capacity Statistics 2026 (PRIMARY · irena.org · March 31, 2026 · 5,149 GW total · +692 GW “highest annual increase in absolute terms” · solar +511 GW +27.2% · wind +159 GW · Europe 934 GW · IRENA PDF linked directly)

The Battery Breakthrough — “Anytime Solar” Is Arriving

The biggest structural shift of 2025 was not in the rankings table. It was in the cost of batteries. When solar panels generate electricity only during daylight hours, their usefulness is constrained. When batteries become cheap enough to store that electricity and deploy it at any hour, solar becomes a 24-hour energy source. Battery costs fell 45% in 2025 — after falling 20% in 2024. Deployment grew 46%. Chile and Australia stored more than half of their new solar generation using grid-scale batteries. The world installed enough battery capacity to shift 14% of new solar generation out of midday into other hours. “Daytime solar” is becoming “anytime solar.” The economics of clean energy are not just improving. They are structurally altering who wins in energy markets.


Why it matters: batteries change the fundamental equation of clean energy by eliminating the “only works when the sun shines” objection to solar. Chile and Australia have already demonstrated it works at grid scale. The rest of the world is watching.
EMBER GER 2026 · PRIMARY · COP28 Target · IEA Renewables 2025
11 TW
COP28 committed to tripling global renewable capacity to 11 terawatts by 2030. Current capacity: 5.149 TW. That means roughly doubling again in five years. The IEA and IRENA both say the current pace is insufficient.
The tripling target set at COP28 in Dubai (December 2023) requires 11 TW of installed renewable capacity by 2030. IRENA’s March 2026 data puts current capacity at 5.149 TW — the largest level in history, but only 47% of the 2030 target. Reaching 11 TW requires adding approximately 1,170 GW per year from now until 2030 — significantly more than the record 692 GW added in 2025. The IEA’s Renewables 2025 report projected the share of renewables in global electricity will rise from 32% in 2024 to 43% by 2030 — meaningful progress, but short of the pace needed to triple total capacity.
Source: IRENA — Renewable Capacity Statistics 2026 (PRIMARY · irena.org · March 31, 2026 · 5,149 GW total end-2025 · +692 GW “highest annual increase in absolute terms” · “largest annual increase in renewable generation capacity to date” · current pace “remains insufficient to achieve the target adopted at COP28 to triple installed RES capacity to over 11 TW by 2030”) · IEA — Renewables 2025 (PRIMARY · iea.org · “share of renewables in global electricity: 32% in 2024 → 43% by 2030”)
Key Numbers at a Glance
Milestone · 2025
33.8%
Renewables’ share of global electricity in 2025 — the first time in 100 years they overtook coal (33.0%). Solar met 75% of demand growth alone.
EMBER GER 2026 (primary · ember-energy.org)
Global Capacity · End 2025
5,149 GW
Total global renewable power capacity at end-2025 — with record +692 GW added in the year. Solar alone: 2,392 GW. Wind: 1,291 GW.
IRENA Renewable Capacity Stats 2026
Battery · Cost Fall
−45%
Battery storage costs fell 45% in 2025, after falling 20% in 2024. Deployment grew 46%. Chile and Australia shifted >50% of new solar out of midday.
EMBER GER 2026 (primary · ember-energy.org)
COP28 Target · 2030
11 TW
The COP28 tripling target is 11 TW by 2030. Current capacity: 5.149 TW. Reaching 11 TW requires ~1,170 GW/year — far above the record 692 GW in 2025.
IRENA 2026 · IEA Renewables 2025
Frequently Asked Questions
Which country has the most renewable energy in the world?
China — by a wide margin. China’s total installed renewable energy capacity reached 2,340 GW by end-2025 (including hydro), representing 60% of its national power capacity. Its wind and solar capacity alone — 1,840 GW — surpassed China’s coal generation capacity for the first time in 2025. China built 58% of the world’s new solar capacity and 72% of new wind capacity in 2025 alone. Source: China National Energy Administration (primary) · EMBER Global Electricity Review 2026 (primary · April 21, 2026) · IRENA Renewable Capacity Statistics 2026 (primary · March 31, 2026).
What percentage of the world’s electricity comes from renewable energy?
33.8% in 2025 — for the first time in 100 years, renewables overtook coal (33.0%) in the global electricity mix. Total global renewable capacity was 5,149 GW by end-2025. The IEA projects this share will rise to 43% by 2030. Solar alone accounted for 2,778 TWh in 2025 — a 30% increase from 2024, and more than tenfold its 2015 level. Source: EMBER Global Electricity Review 2026 (primary · ember-energy.org · April 21, 2026) · IRENA Renewable Capacity Statistics 2026 (primary · March 31, 2026).
What country is growing renewable energy the fastest?
China is growing fastest in absolute terms. In 2025 alone, China added 378 GW of solar and 119 GW of wind — 58% and 72% of the world’s total additions respectively. India is growing fastest among emerging democracies, surpassing the US in solar additions in 2025 for the first time and reversing four consecutive years of fossil generation growth. The Middle East grew 28.9% in percentage terms, led by Saudi Arabia. Africa grew 15.9% — its fastest ever. Source: EMBER (primary · April 2026) · IRENA (primary · March 2026).
Has renewable energy overtaken fossil fuels?
In electricity generation, renewables have overtaken coal — for the first time in 100 years in 2025 (33.8% vs 33.0%, EMBER primary). However, fossil fuels (coal + gas + oil) still collectively account for the majority of electricity generation, and the vast majority of total energy consumption (including transport, heating, and industry). Renewables have overtaken coal specifically. The broader transition — replacing all fossil fuels across all energy uses — is still in its early stages. Source: EMBER Global Electricity Review 2026 (primary · April 21, 2026).
Will the world reach the COP28 renewable energy tripling target by 2030?
At current pace, probably not. The COP28 goal set in Dubai (December 2023) commits countries to tripling global renewable capacity to approximately 11 terawatts by 2030. Current capacity is 5,149 GW (5.149 TW) — less than half the target. Reaching 11 TW by 2030 requires adding roughly 1,170 GW per year for the next five years. The record addition in 2025 was 692 GW. Both the IEA and IRENA have said the current pace is insufficient to meet the target. Source: IRENA Renewable Capacity Statistics 2026 (primary · March 2026) · IEA Renewables 2025 (primary).
Sources
  • EMBER — Global Electricity Review 2026 (PRIMARY · directly fetched · ember-energy.org/latest-insights/global-electricity-review-2026 · April 21, 2026 · 215 countries · 91 with 2025 data · 93% of global electricity demand · Aditya Lolla, Managing Director · KEY CONFIRMED VERBATIM: “For the first time in 100 years, renewables (33.8%, 10,730 TWh) overtook coal power (33.0%, 10,476 TWh)” · “Solar power alone met 75% of the net increase in electricity demand” · “Solar has been doubling roughly every three years” · “Global solar generation is now the same size as the total electricity demand of the EU” · “Battery costs fell a further 45% [in 2025], while deployment grew 46% to an estimated 250 GWh” · “Chile and Australia installed enough grid-level storage to shift over 50% of new solar generation” · “India installed more new solar capacity than the United States for the first time” · “China once again led solar build-out, recording more than half of the global increase” · “China’s solar and wind share: 22%, surpassing OECD average 20%” · “In China, [fossil] fell by 56 TWh (-0.9%), marking the first decline since 2015” · “India fossil: –52 TWh (-3.3%)” · “fossil generation did not rise, recording a small fall of 38 TWh (-0.2%)” · “only the fifth time this century” · “Both solar and wind are expected to overtake nuclear in 2026” · “We have firmly entered the era of clean growth” — Lolla)
  • IRENA — Renewable Capacity Statistics 2026 (PRIMARY · irena.org/-/media/Files/IRENA/Agency/Publication/2026/Mar/IRENA_DAT_RE_capacity_highlights_2026.pdf · March 31, 2026 · data: end of 2025 · 5,149 GW total · Solar 2,392 GW · Wind 1,291 GW · Hydro 1,296 GW · Bioenergy 154 GW · Geothermal 16 GW · +692 GW (+15.5%) “highest annual increase in absolute terms and the highest growth rate recorded to date” · Solar: +511 GW (+27.2%) · Wind: +159 GW (+14.0%) · Solar+wind: 96.8% of all new renewable additions · RES share of installed global power: 49.4% · India: 37.0 GW solar + 6.3 GW wind added 2025 · Europe: +76.8 GW (+9.0%) → 934 GW · Germany: +20.5 GW · North America: +42.1 GW (+7.4%) · US: 34.0 GW solar (+19.2%) · Middle East: +28.9% +12.7 GW led by Saudi Arabia · Africa: +15.9% +11.3 GW “highest in the continent’s history” led by Ethiopia, South Africa, Egypt · “remains insufficient to achieve the target adopted at COP28 to triple installed RES capacity to over 11 TW by 2030”)
  • China National Energy Administration (NEA) — Primary Chinese government data · end-2025 · “total installed renewable energy capacity reached 2.34 billion kW [2,340 GW] by the end of 2025, accounting for around 60% of the national power capacity” · “Combined wind and solar capacity grew from 530 million kW in 2020 to 1.84 billion kW in 2025, surpassing coal-fired power capacity for the first time” · cited by markets.financialcontent.com/workboat citing ABNewswire March 2026
  • EMBER — China Energy Transition Review 2025 (PRIMARY · ember-energy.org · April 13, 2026 · “China’s wind and solar generation capacity more than doubled in the three years to 2024, from 635 GW to 1,408 GW” · “In early 2025, the capacity of wind and solar combined overtook that of coal” · “China generated 18% of its electricity from solar and wind in 2024, twice as much as in 2020 (9%)”)
  • IEA — Renewables 2025 (PRIMARY · iea.org/reports/renewables-2025 · “Share of renewables in global electricity generation is projected to rise from 32% in 2024 to 43% by 2030” · “electricity generation from renewables expected to increase 60% – from 9,900 TWh in 2024 to 16,200 TWh in 2030” · “renewables are expected to surpass coal at the end of 2025 or by mid-2026 at the latest” ← confirmed by EMBER · COP28: triple to 11 TW by 2030)
  • Global Energy Monitor (GEM) — Global Wind and Solar 2025 (2025 · globalenergymonitor.org · global pipeline: 4.9 TW prospective wind+solar · China: >1.5 TW prospective · India + China: 75% of all under-construction projects · 758 GW currently under construction globally)
  • EMBER — Brazil chapter, Global Electricity Review 2026 (PRIMARY · ember-energy.org · April 21, 2026 · “wind and solar reached 27%, well above both the global average of 17% and Latin America’s average of 19%” · “fourth-largest increase for both solar and wind generation in 2025” · “ranks fourth globally in total wind generation and sixth in total solar generation”)
  • EMBER — EU Solar update (July 14, 2026 · “A quarter of EU power came from solar for the first time in June” · ember-energy.org)
  • Statista / Energy Institute Statistical Review of World Energy 2025 (PRIMARY · energyinst.org · “China accounts for roughly half of global installed wind and solar capacity as of 2025, with 641 gigawatts of wind and more than 1,200 gigawatts of solar power”)
Macro Discovery

Sukh Dhaliwal

Sukh Dhaliwal is the founder of Macro Discovery, an independent digital publication covering AI, technology, science, future trends, and global innovation through visual storytelling and data-driven analysis.

Join WhatsApp

Join Now

Join Facebook

Follow us

Leave a Comment