
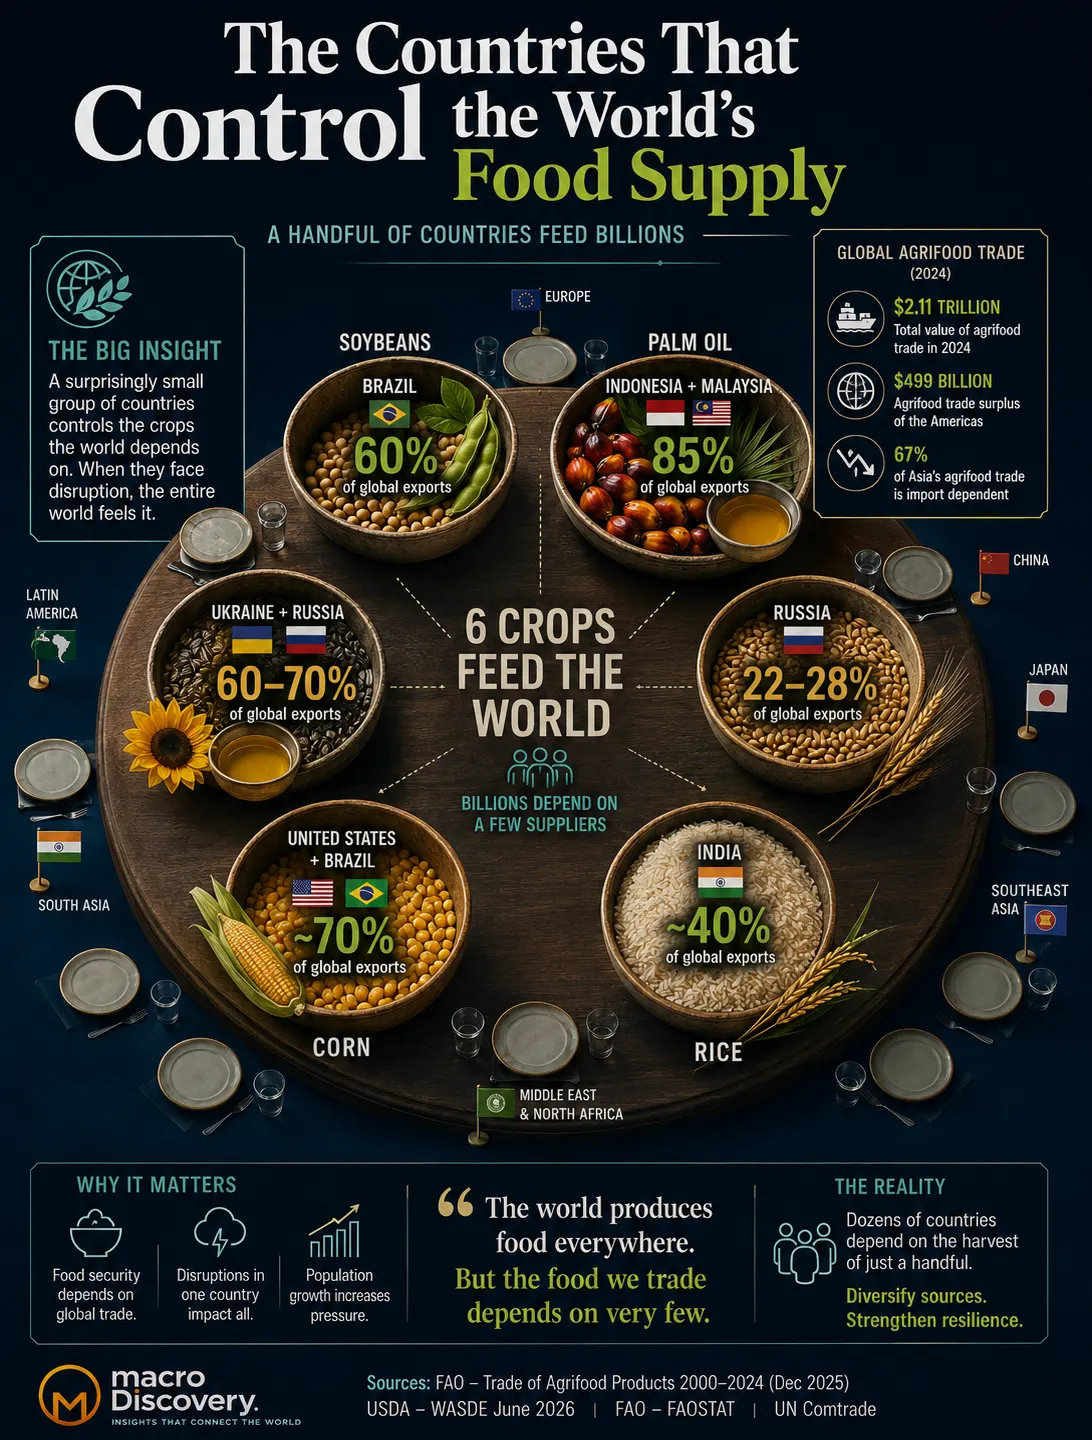
The Countries That Control
the World’s Food Supply
The United States exports $142 billion in food per year. Brazil exports even more by net surplus. Russia — which once could not feed itself — is now the world’s largest wheat exporter, controlling nearly a quarter of global wheat trade and using grain as geopolitical leverage. Just two countries produce 84% of the world’s palm oil. The concentration of global food supply in the hands of a small number of nations is one of the most underappreciated strategic facts of the modern world.
- The United States is the world’s largest food exporter by value — but Brazil is the world’s largest net food exporter. The US exports $142 billion but also imports heavily; its net surplus is much smaller. Brazil exported $127 billion in 2023 with a net surplus of $115.8 billion — meaning almost every dollar of its food exports is genuine surplus, not re-export. Soybeans account for 33% of Brazil’s net food export value, and the single largest bilateral food trade flow in the world is Brazil shipping soybeans and other agricultural products to China ($53.6 billion in 2023).
- Russia turned the global wheat market into a geopolitical tool. The Soviet Union couldn’t feed itself and depended on US and Canadian grain. Today, Russia is the world’s largest wheat exporter, with a peak of 55.5 million tonnes shipped in the 2023/24 season — controlling approximately 22-28% of global wheat trade. Russia has used this position strategically: suspending the Black Sea Grain Initiative in 2023 and pricing wheat below competitors to capture market share across Africa, the Middle East, and South Asia.
- The concentration of food supply creates systemic vulnerability. Just two countries — Indonesia and Malaysia — produce 84% of the world’s palm oil (FAO 2024). The top three soybean producers account for approximately 85% of global output. The top five wheat exporters account for 63.8% of trade by value. When these chokepoints fail — as Brazil’s coffee crops did during a 2023-2025 drought, or as India’s rice export ban in 2023 disrupted Asian markets — prices spike globally and food-insecure populations bear the cost.
- China is the world’s largest food importer with a deficit of $133.2 billion in 2023. Despite being the world’s largest agricultural producer (pig meat, rice, potatoes, wheat by volume), China consumes nearly all of it domestically. Its enormous and growing food deficit makes it the single most consequential force in global agricultural trade — what China buys shapes prices and trade routes worldwide. Soybeans alone account for 30% of China’s net food import value.
- The Netherlands, despite having less than 42,000 km² of land, is the world’s third-largest food exporter by value ($99.6 billion) and second-largest net exporter (+$27.7 billion). It achieves this through greenhouse technology, precision agriculture, advanced logistics, and its position as Europe’s primary food processing and redistribution hub. The Netherlands exports more food by value than Russia, Australia, or India.
| # | Country | Food Exports 2023 | % of Global | Net Surplus/Deficit | Top export | Share |
|---|---|---|---|---|---|---|
| 1 | 🇺🇸United States |
$142B | 8.7% | Large surplus | Corn, soybeans, meat, dairy, wheat. World’s largest agri-producer alongside China. | |
| 2 | 🇧🇷Brazil |
$127B | 7.8% | +$115.8B ★ | Soybeans (#1 exporter), sugar, coffee, orange juice, beef, chicken. Largest net food exporter on earth. | |
| 3 | 🇳🇱Netherlands |
$99.6B | 6.1% | +$27.7B | Dairy, meat, vegetables, flowers (world’s largest flower exporter), processed foods. Europe’s food hub despite tiny land area. | |
| 4 | 🇩🇪Germany |
~$90B+ | ~5% | Net exporter | Dairy, processed foods, beverages, pork, confectionery. Major EU food processing hub. | |
| 5 | 🇦🇺Australia |
— | — | +$27.5B | Beef, wheat, barley, wool, wine. Third-largest net food exporter globally 2023. Key supplier to Asia. | |
| 6 | 🇷🇺Russia |
~$45B+ | ~3% | Net exporter | World’s #1 wheat exporter (22-28% share). Top sunflower oil exporter with Ukraine. Grain as geopolitical tool. | |
| 7 | 🇮🇳India |
$60B+ | ~4% | Net exporter | World’s #1 rice exporter (~40% of global rice trade). #1 spices exporter. Export restrictions 2023 caused global rice price spike. | |
| — | 🇨🇳China |
~$92B | ~5% | −$133.2B ★ | World’s largest food PRODUCER (pig meat, rice, potatoes, wheat by volume) but consumes almost all domestically. World’s largest food import deficit. |
Sources: FAO Analytical Brief 98 — “Trade of Agricultural Commodities 2010–2023” (primary · December 2024 · directly fetched). Top 3 export values (US $142B, Brazil $127B, Netherlands $99.6B) and net surplus/deficit figures (Brazil +$115.8B, Netherlands +$27.7B, Australia +$27.5B, China −$133.2B) directly confirmed from FAO primary. Russia and India export values are approximations from secondary sources for context. Germany exact net figure not published in primary source. Data year: 2023. Rows for Australia, Russia, India, China are supplementary context. Click column headers to sort.
| Commodity | Top exporter(s) | Concentration | Risk level | Key vulnerability | Conc. |
|---|---|---|---|---|---|
🌴 Palm OilMost traded vegetable oil |
🇮🇩 Indonesia (62%) · 🇲🇾 Malaysia (22%) | 84% from 2 countries | ⚠ Extreme | Drought, deforestation bans, or geopolitical action by either nation would affect cooking oil prices globally. Palm oil = 46.6% of all vegetable oil exports. | |
🌾 Wheat2nd most produced grain |
🇷🇺 Russia (22-28%) · 🇪🇺 EU (17%) · 🇨🇦 Canada (14%) · 🇦🇺 Australia (9%) | Top 5 = 63.8% | ⚠ Very High | Russia led 5 of last 6 years. Peak 55.5 Mt in 2023/24. Uses grain as geopolitical tool. US share collapsed from 50% (1973) to ~11% today. | |
🫘 SoybeansWorld’s primary protein crop |
🇧🇷 Brazil (~60%+ exports) · 🇺🇸 USA · 🇦🇷 Argentina | ~85% from 3 countries | ⚠ Very High | Soybeans = 80% of global oilseed exports by volume. Brazil 2023 production: 152.1 Mt (up from 121.3 Mt in 2022 — +25%). Americas = 81% of oilseed exports. | |
🌾 RiceStaple for 3.5B people |
🇮🇳 India (~40%) · 🇹🇭 Thailand · 🇻🇳 Vietnam | India: ~40% alone | ⚠ High | India’s export ban in 2023 immediately caused global price spike. Asia = 90% of global rice production. Most production consumed domestically. Trade flows are thin relative to production. | |
🌻 Sunflower Oil16% of global veg oil exports |
🇺🇦 Ukraine (#1) · 🇷🇺 Russia (#2) together = dominant | 2 countries dominant | ⚠ High | Ukraine exports +33.2% in 2023. Russia +54.2%. Ukraine war in 2022 disrupted sunflower exports immediately, pushing substitution to palm oil. War risk ongoing. | |
🌽 Maize (Corn)#1 grain by volume |
🇺🇸 USA · 🇧🇷 Brazil · 🇦🇷 Argentina | Americas = ~70% | High | USA 30% of global corn production. Americas = 50% of world total. 2023 global exports: 197.9 Mt (down 11.6 Mt as US + Argentina fell, Brazil grew). Corn = feed + fuel + food. | |
☕ CoffeeMost traded food commodity |
🇧🇷 Brazil (>25% exports) · 🇻🇳 Vietnam (#2) · 🇨🇴 Colombia | Brazil dominant | Moderate | Brazil coffee exports hit by 2023-2025 drought. Arabica prices surged to multi-decade highs. Climate sensitivity makes this commodity vulnerable to weather shocks in Brazil. | |
🥩 BeefHighest-value meat |
🇧🇷 Brazil (#1 exporter) · 🇦🇺 Australia · 🇺🇸 USA | Top 3 = ~55% | Moderate | US = 19% of world cattle meat production. Brazil = major global exporter. China = 46% of pig meat but mostly domestic. Market more diversified than grains. |
Sources: FAO Statistical Yearbook 2024 (primary) — oil palm fruit 84% from Indonesia+Malaysia; US 30% of corn; Americas 50% corn, 87% oil palm, 90% rice in Asia; top 3 producers = 43-87% depending on crop. USDA WASDE June 2026 (primary) — wheat export tables confirmed Russia #1; India 40% rice exports. FAO Analytical Brief 98 (primary) — Brazil soybean 2023 production 152.1 Mt; sunflower oil Ukraine/Russia growth. FoodNavigator (March 2026) — Brazil >60% soy exports; Russia geopolitical wheat use. Tendata/FAOSTAT — top 5 wheat exporters 63.8% of value. Click column headers to sort.
Source: FAO Analytical Brief 98 — “Trade of Agricultural Commodities 2010–2023” (Table 1 · primary · December 2024 · directly fetched). All figures in USD billions, data year 2023. Brazil→China flow is roughly two-thirds soybeans. US appears in three of the top seven bilateral flows. The Netherlands appears in three of the top ten — reflecting its role as Europe’s food processing and redistribution hub rather than only domestic production. China appears as destination in three of the top ten flows.
Why Is Brazil the Most Strategically Important Country in Global Food Supply?
Brazil is not the world’s largest food exporter by value — the United States holds that title at $142 billion in 2023. But by the measure that matters for global food security — net food surplus, what a country actually adds to the world’s food supply — Brazil is unambiguously dominant, with a surplus of $115.8 billion in 2023. Almost every dollar Brazil earns from food exports represents genuine surplus beyond its domestic needs. The US, by contrast, is also a major food importer, so its gross export figure overstates its net contribution.
Brazil’s dominance rests on a transformation that is less than 50 years old. In the 1970s, Brazil was a net food importer, dependent on imported calories for its growing population. The development of the Cerrado — a vast tropical savanna that covers roughly one-quarter of Brazil’s land area — through soil science, particularly the liming of Brazil’s naturally acidic soils and the development of tropical-adapted soybean varieties, turned it into one of the world’s most productive agricultural zones. By 2023, Brazil’s soybean harvest reached 152.1 million tonnes — up from 121.3 million tonnes just one year earlier — making it far and away the world’s largest soybean exporter, shipping over 60% of the global total.
The single most consequential bilateral food trade relationship in the world is Brazil supplying China. In 2023, Brazil exported $53.6 billion in food products to China — roughly two-thirds of it soybeans, which China crushes into animal feed and cooking oil to sustain its massive pork and poultry industries. This relationship represents a structural dependency that neither side can easily replace. China cannot grow the volume of soybeans it needs domestically (not enough arable land), and no other country can supply the volumes Brazil provides. The geopolitical implications are significant: if Brazil were to restrict soybean exports — for climate reasons, domestic food security, or political leverage — it would disrupt China’s food system within months.
How Did Russia Turn Wheat Into a Geopolitical Weapon?
During the Cold War, the Soviet Union was humiliatingly dependent on grain imports from its ideological enemies — the United States and Canada. In 1972, the USSR secretly purchased 28 million tonnes of American grain in what became known as the “Great Grain Robbery,” causing US domestic food prices to spike. The Soviet Union could not feed itself. Forty years later, Russia is the world’s largest wheat exporter, with a market share of 22-28% depending on the season — exporting more wheat than the US, Canada, and Australia combined in peak years. Russia shipped a record 55.5 million tonnes of wheat in the 2023/24 marketing year, according to USDA data. It has led global wheat exports in five of the last six seasons.
The US, which once dominated global wheat trade at nearly 50% of global exports in 1973, now accounts for approximately 11% — near a record low. American farmers rationally shifted to more profitable crops: corn (for ethanol and animal feed) and soybeans (for Chinese demand). Russia’s rise reflects cheap land, fertile black soil (chernozem), government export subsidies, and aggressive pricing in key markets — particularly Egypt, Turkey, Bangladesh, Algeria, and countries across the Middle East and Sub-Saharan Africa.
Russia has weaponised this position. The suspension of the Black Sea Grain Initiative in July 2023 — a deal that had allowed Ukrainian grain exports through Russian-controlled waters — was a direct use of food supply as geopolitical leverage, threatening the food security of dozens of wheat-importing nations. Russia targets wheat buyers in exactly the countries most dependent on imported calories: Egypt is Russia’s single largest wheat customer, importing 7.6 million tonnes in 2024/25. Bangladesh is second. Algeria and Kenya follow. These are not wealthy countries with easy substitutes — they are food-vulnerable nations where wheat price increases translate directly into food insecurity. The Rabobank agri-commodity research head, Carlos Mera, put it precisely in a 2026 analysis: “If you want to be influential, you need to look at human consumption because animals don’t vote. That’s wheat, primarily. Also rice and veg oils.”
Why Is China the World’s Largest Food Importer Despite Being Its Largest Producer?
China presents the defining paradox of global agricultural economics. It is the world’s largest producer of wheat, rice, potatoes, pork, and numerous other commodities — yet it is also the world’s largest food importer, running a net food deficit of $133.2 billion in 2023. Soybeans alone account for 30% of China’s net food import value. Its largest bilateral food trade relationship — receiving $53.6 billion of goods from Brazil — is entirely driven by the need to import protein and feed ingredients that China cannot produce domestically at the scale it needs.
The explanation is demographic and dietary. China has 1.4 billion people, rapidly improving living standards, and a strong preference for pork — it produces 46% of the world’s pig meat. Pigs require large quantities of soy-based feed. China’s agricultural land, while vast in absolute terms, is constrained relative to its population and is heavily used for staple grain production for human consumption. There is essentially no land available to grow the volume of soybeans China needs — the country would need to double its soybean crop area to approach self-sufficiency in protein feed, and that land does not exist without reducing grain production.
China’s food import dependency is its most strategically sensitive vulnerability — and its government knows it. The phrase “food security” appears more frequently in Chinese Communist Party documents than almost any other economic concern. If US-China trade tensions were to escalate to the point of restricting US agricultural exports to China, China would redirect demand to Brazil, Argentina, and Australia — and the US farm sector would face severe price collapse. This is why American soybean farmers are among the most attentive observers of US-China diplomatic relations.
How Does the Netherlands Export $100 Billion in Food From a Country Smaller Than West Virginia?
The Netherlands occupies roughly 42,000 square kilometres — smaller than the US state of West Virginia, smaller than Switzerland, smaller than any country one might intuitively associate with agricultural dominance. Yet in 2023 it was the world’s third-largest food exporter by value at $99.6 billion, and the second-largest net food exporter at +$27.7 billion, behind only Brazil. The Netherlands exports more food by value than Russia, Australia, or India.
The Dutch model rests on three pillars. First, greenhouse technology: the Netherlands has developed the world’s most intensive and efficient greenhouse agriculture, producing tomatoes, peppers, cucumbers, and flowers in climate-controlled glass structures year-round, with minimal water use and maximum yield per square metre. Its greenhouse horticulture sector generates some of the highest agricultural output per hectare on earth. Second, processing and value addition: the Netherlands imports raw commodities and adds value through processing — dairy products, meat processing, cocoa and chocolate (Rotterdam is the world’s largest cocoa port), and food manufacturing. Third, logistics infrastructure: the Port of Rotterdam is Europe’s largest port, and Amsterdam Schiphol is one of its busiest air cargo hubs. The Netherlands sits at the intersection of European trade flows as the primary gateway for food entering and leaving the continent.
The Netherlands → Germany bilateral food trade flow of $24.9 billion in 2023 was the fifth-largest bilateral food trade flow in the world — reflecting how deeply the Dutch food processing and distribution system is embedded in broader European supply chains. When you buy German dairy products, Dutch chocolate, or Belgian chocolates (the Netherlands → Belgium flow was $12.1 billion), you are often consuming ingredients and products processed through Dutch logistics infrastructure. This model of geographic smallness combined with processing and logistics excellence is one of the most successful economic models in global food trade history.
What Happens When a Single Country Restricts Its Food Exports?
The global food system’s concentration risk is not theoretical — it materialised visibly in 2022 and 2023. Russia’s invasion of Ukraine in February 2022 immediately disrupted two overlapping food systems. Ukraine and Russia together are the world’s dominant sunflower oil exporters — Ukraine’s exports surged 33.2% in 2023 as it found alternative shipping routes, but the initial 2022 disruption forced a rapid substitution toward palm oil. Ukraine is also a significant wheat and corn exporter, and its reduced shipments contributed to the global food price spike of 2022 that drove food inflation to double digits in low-income countries.
In 2023, India banned most rice exports to protect its domestic market after erratic monsoons threatened domestic production. India accounts for approximately 40% of global rice trade, according to USDA data. The immediate effect was a sharp rise in rice prices across Asia and Sub-Saharan Africa — markets where hundreds of millions of people depend on rice as their primary calorie source. The ban was temporary, but it demonstrated that a single government decision in Delhi could alter food access for a billion people outside India’s borders within weeks.
Brazil’s climate exposure is the most consequential single concentration risk in global food supply. Brazil accounts for more than 60% of global soybean exports, over half of sugar exports, over a quarter of coffee exports, and over three-quarters of orange juice exports — all from a country that is, as FoodNavigator’s 2026 analysis noted, “right on the frontline of climate change,” with a fivefold increase in climate-related disasters since the 1990s. The 2023-2025 drought in Brazil’s coffee-growing regions drove Arabica coffee prices to multi-decade highs. The catastrophic floods in Rio Grande do Sul in 2024 damaged Brazil’s rice production sufficiently to prompt the government to restart public rice stockpiling for the first time in years. As climate change intensifies in tropical and subtropical regions, the concentration of global food supply in Brazil becomes an increasingly urgent systemic risk.
- FAO — Analytical Brief 98: “Trade of Agricultural Commodities 2010–2023” (primary · December 2024 · directly fetched · US $142B · Brazil $127B · NL $99.6B · net surpluses/deficits · bilateral flows Table 1 · regional patterns · soybeans 80% oilseed exports)
- FAO Statistical Yearbook 2024 (primary · directly confirmed · oil palm Indonesia 62%/Malaysia 22% = 84% · US 30% corn · Americas 50% corn · Asia 90% rice · top 3 producers concentration data)
- USDA — Grain: World Markets and Trade (WASDE June 2026 · primary · wheat export tables confirmed · Russia #1 · India 40% rice exports confirmed · EU · Canada · Australia data)
- FoodNavigator — “Which countries control global food supply in 2026?” (March 2026 · Russia geopolitical wheat use · Brazil 60%+ soy · 50%+ sugar · 25%+ coffee · 75%+ OJ · US wheat decline from 50% to 11% · Rabobank Mera quote · Brazil climate exposure)
- Andaman Partners — “Global Agriculture: Producing and Trading the World’s Food” (July 2025 · FAOSTAT basis · Brazil-China $55.8B pre-update · geopolitical vulnerability · regional patterns)
- World Grain — “Russia expands lead in wheat exports” (May 2024 · Russia 5 of last 6 years leader · 55 Mt forecast · EU 35 Mt · all other major exporters reducing)
- Interfax citing Rusagrotrans — “Russia to remain global wheat export leader with 22% market share” (April 2025 · 40.8 Mt 2024/25 · Egypt 7.6 Mt top buyer · Bangladesh · Turkey · Algeria destinations)
- Visual Capitalist — “Ranked: The Countries That Feed the World” (May 2026 · China vs Brazil export contrast · Netherlands trade hub role · Australia Asia supplier · Indonesia palm oil)













I search for Countries That Control the World’s Food Supply chain from last week, now I get a complete and true information about this, Thanks, Very good information 📚
Keep it up 👍