
How the World’s
Food Supply Actually Works
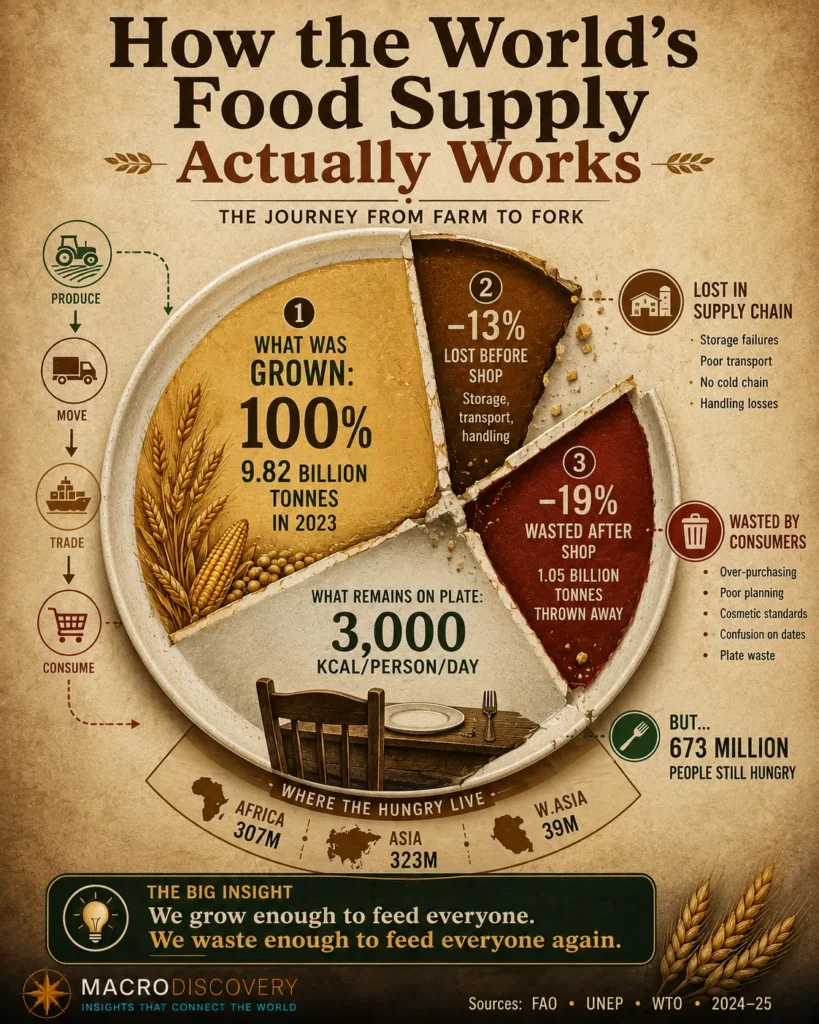
The world produces 9.82 billion tonnes of food — enough to cross 3,000 calories per person per day for all 8 billion of us. Yet 673 million people go hungry. About 13% of food is lost before it reaches a shop. One in five portions that reach consumers is thrown away. The gap between what is grown and what is eaten is one of the defining failures of the modern economy — and understanding it requires following the food from field to plate.
- The world grows enough food to feed everyone — global food supply crossed 3,000 calories per person per day for the first time in 2023 (FAO Food Balance Sheets). Yet 673 million people went hungry in 2024. The problem is not insufficient production. It is who can access and afford food.
- Global hunger declined slightly in 2024 — 15 million fewer hungry people than 2023 — but Africa and Western Asia are still going in the wrong direction. If current trends continue, 512 million people could face hunger in 2030, nearly 60% of them in Africa, according to SOFI 2025.
- About 13% of food is lost before it reaches a shop, mostly in the supply chain: post-harvest handling, storage, and transport failures. Another 19% of food that reaches consumers — 1.05 billion tonnes in 2022 — is wasted at retail, in restaurants, and in homes. Households account for 60% of all consumer food waste.
- Global food trade has quintupled since 2000, reaching $1.97 trillion in 2024 (crop and livestock products, FAOSTAT). One-third of food exports cross international borders at least twice. The Americas, Europe, and Oceania are net exporters; Africa and Asia are net importers. Just two countries dominate soybean and palm oil exports at 85% market share each.
- Rich countries waste 10–15 times more food per person than poor countries — 95–115 kg per person per year in Europe and North America, versus 6–11 kg in Sub-Saharan Africa and South/Southeast Asia. In wealthy nations, waste happens at home. In poor nations, it happens in the supply chain — because there is no cold storage, no proper roads, no processing infrastructure.
| Region | Hungry (millions) | Prevalence (%) | Trend | Status | Scale |
|---|---|---|---|---|---|
| 🌍 Africa | 307 million | >20% | ↑ Rising | ⚠ Crisis | |
| 🌏 Asia | 323 million | 6.7% | ↓ Improving | Improving | |
| 🌍 Western Asia | 39 million | 12.7% | ↑ Rising | ⚠ Rising | |
| 🌎 Latin America | 34 million | 5.1% | ↓ Improving | Improving | |
| 🌍 Global total | 673 million | 8.2% | ↓ Slight decline | Still above pre-pandemic |
Source: SOFI 2025 — The State of Food Security and Nutrition in the World (July 2025). Jointly published by FAO, IFAD, UNICEF, WFP, and WHO. Primary — directly fetched. Hunger = chronic undernourishment (insufficient calories for a normal active and healthy life). 2024 global midpoint estimate: 673 million (range: 638–720 million). Click column headers to sort.
Note: $1.97T = crop and livestock products only (FAOSTAT). Broader food and agricultural trade including fish and forestry reached $2.3 trillion in 2024, according to WTO Deputy Director-General Paugam (December 2024 Annual Agriculture Symposium, citing FAO).
How Much Food Does the World Actually Produce — and Is It Enough?
In 2023, the world harvested approximately 9.82 billion tonnes of primary crops — about 2 billion tonnes more than it produced in 2010, according to FAOSTAT. Cereals alone accounted for 3.13 billion tonnes, a third of the total. Global food supply crossed 3,000 kilocalories per person per day for the first time in history in 2023, according to FAO Food Balance Sheets. By the basic arithmetic of calories, the world produces more than enough food for every human being alive.
Global agricultural output has grown relentlessly for decades. Real agricultural value reached $3.8 trillion in 2022 — up 89% in real terms over the previous 20 years, according to the FAO Statistical Yearbook 2024. The workforce required to produce all of this has fallen: agriculture employed 40% of the global workforce in 2000 and employs 26% today, as mechanisation and technology increased output per worker. China alone accounts for 33.2% of global agricultural gross production value at $1.70 trillion, followed by India at $537 billion.
The paradox that defines modern food systems is that all of this production coexists with 673 million hungry people and 2.6 billion who cannot afford a healthy diet. The problem is not that the world cannot grow enough food. It is that the food grown does not reach the people who need it — because of poverty, conflict, dysfunctional supply chains, and the catastrophic waste that occurs at every stage between the field and the plate.
Why Are 673 Million People Still Hungry in a World of Food Abundance?
The SOFI 2025 report — the definitive annual assessment of global food security published jointly by FAO, IFAD, UNICEF, WFP, and WHO in July 2025 — found that 673 million people experienced hunger in 2024, down from 688 million in 2023 and 695 million in 2022. Progress is real but painfully slow and deeply uneven. Asia is improving substantially, driven by India. Latin America is improving. Africa and Western Asia are getting worse.
FAO Chief Economist Maximo Torero identified three overlapping causes in his commentary on the report. First, conflict — directly disrupting food production, supply chains, and income in countries across sub-Saharan Africa and parts of Asia. Second, macroeconomic stress — debt burdens and currency weakness making it increasingly difficult for import-dependent countries to afford food at global market prices. Third, climate — affecting the entire world but hitting the most vulnerable hardest, reducing yields and making growing seasons less predictable in regions already at the margin of food security.
The SOFI 2025 projection is sobering: if current trends continue, 512 million people could still face hunger in 2030 — the year the world committed, under Sustainable Development Goal 2, to end hunger entirely. Nearly 60% of those 512 million would be in Africa. The SDG 2 target of zero hunger by 2030 is not going to be achieved. The trajectory points to 512 million hungry in 2030, compared to 690 million in 2019 just before the pandemic. That is progress — but it is half a century away from zero, not five years.
Where Does a Third of the World’s Food Disappear Before Anyone Eats It?
The UNEP Food Waste Index Report 2024 and FAO’s food loss statistics together tell a story of staggering inefficiency across the entire food chain. About 13.2% of food is lost after harvest but before it reaches retail — in storage, in transit, in processing. Another 19% of what does reach consumers is wasted: thrown away at retail, left on restaurant plates, or discarded from household refrigerators. The 1.05 billion tonnes of consumer food waste recorded in 2022 alone would be enough to address global hunger many times over, if it could be redirected.
Critically, where food is lost depends on where you live. In wealthy countries — North America and Europe — the waste is predominantly at the consumption end: households discard 95–115 kg of food per person per year, food services throw away untouched portions, and supermarkets bin produce that doesn’t meet cosmetic standards. In low-income countries, the problem is largely different: people waste very little (6–11 kg per person per year) but food is lost in the supply chain before it ever reaches them — because there is no electricity for cold storage, no sealed roads for refrigerated transport, no processing infrastructure to extend shelf life.
The consequences extend far beyond economics. Food loss and waste generates 8–10% of global greenhouse gas emissions — almost five times the total emissions from all aviation globally, according to UNEP. It occupies a land area larger than China and consumes roughly one-quarter of all water used in global agriculture. The food wasted annually is worth more than $1 trillion. SDG target 12.3 commits the world to halving food waste by 2030. Of all G20 countries, only four — Australia, Japan, the UK, and the US — and the EU have food waste estimates suitable for tracking progress toward that target, according to the UNEP 2024 report.
How Does Global Food Trade Work — and Who Controls It?
Food trade has been one of the most transformative forces in human nutrition over the last quarter-century. In 2000, global food and agricultural trade was worth around $400 billion. By 2022, it had reached $1.9 trillion. By 2024, crop and livestock exports alone hit $1.97 trillion — a new nominal high, according to FAOSTAT’s December 2025 update. The broader food and agricultural trade including fish and forestry reached $2.3 trillion (WTO). The energy content of internationally traded food has more than doubled since 2000, and the variety of foods available to consumers globally was 90% higher by 2020 than what their domestic agriculture could supply alone.
The geography of food trade is structurally straightforward: the Americas, Europe, and Oceania export food; Africa and Asia import it. The largest single bilateral food trade flow in 2023 was Brazil exporting $55.8 billion in agricultural products to China — two-thirds of it soybeans. The second and third largest were Canada and Mexico exporting to the United States. Europe’s largest flow was the Netherlands exporting $31.8 billion to Germany, mostly dairy and fresh produce.
Concentration is a defining feature of the global food system. The top two exporters of soybeans account for approximately 85% of total global soybean exports. The top two palm oil exporters account for approximately 85% of palm oil exports. One-third of all food and agricultural exports cross international borders at least twice before reaching their final consumer — a reflection of how deeply processed food has transformed the supply chain. A wheat grain grown in Kansas may be exported to the Netherlands, milled into flour, exported to West Africa, mixed with local ingredients, packaged in Senegal, and sold in a market in Côte d’Ivoire. The food system is not a simple line from farm to fork — it is a web of global intermediaries, each adding value and cost.
Is the Global Food System Getting Better or Getting Worse?
The honest answer is: it depends on where you look. Production is at or near record levels. Global hunger has declined from a peak of around 811 million in 2020 (pandemic year) to 673 million in 2024. Latin America and Asia are improving meaningfully. Trade has grown, increasing the diversity and quantity of food available in countries that could not previously produce sufficient variety domestically. Stunting in children under five has fallen from 180 million in 2012 to 150 million in 2024 — still far too many, but a significant improvement over a decade.
At the same time: Africa is going backwards. Western Asia is going backwards. 2.6 billion people cannot afford a healthy diet. The 2030 SDG hunger target is going to be missed by hundreds of millions. Food waste is consuming one-third of everything produced. Climate change is making agriculture less predictable in the most food-insecure regions. The food system is producing more, but the gains are not reaching the people who need them most.
The structural problem is not biological or physical — it is economic and political. Food is produced in surplus in aggregate terms. The question is whether it is produced where needed, priced within reach, preserved without waste, and distributed without loss. None of these questions are answered by planting more crops. They require investment in cold storage infrastructure in sub-Saharan Africa, income support for the 2.6 billion who cannot afford a healthy diet, reduction of the supply chain losses that consume 13% of production before it reaches a shop, and political willingness to address the conflicts that are the single largest driver of acute hunger today.
- FAO — SOFI 2025: The State of Food Security and Nutrition in the World (July 2025 · primary · directly fetched · 673M hungry · 2.6B can’t afford healthy diet · regional breakdown · 512M 2030 projection · food price inflation data)
- United Nations — Food (global issues page · SOFI 2025 summary · Africa 307M · Western Asia 39M · Asia 6.7% · Latin America 5.1%)
- UNICEF Data — SOFI 2025 (512M projection by 2030 · 60% in Africa · affordability data · food price inflation link to child wasting)
- European Commission citing UNEP — Food Waste Index Report 2024 (1.05Bt consumer waste in 2022 · 19% · household 60% · 8-10% GHG · G20 tracking)
- FAO — Food Loss and Waste Policy Series (13.2% supply chain loss · 8-10% GHG confirmed · $400B food loss value)
- FAO FAOSTAT — “Trade of agrifood products 2000–2024” (December 2025 update · $1.97T 2024 · 85% soy/palm concentration · net exporter/importer regions)
- WTO — DDG Paugam: “Trade is key to food and nutrition security” (December 2024 · $2.3T food + agricultural trade · 25% production traded · 1/3 cross borders twice · diversity 90% higher)
- ReliefWeb citing FAO — Statistical Yearbook 2024: World Food and Agriculture ($3.8T agricultural value · +89% real · 26% workforce · new employment data)
- WRI — “How Much Food Does the World Really Waste?” (November 2024 · up to 40% overall · land larger than China · 45 trillion gallons water · 8-10% GHG)
- Andaman Partners — “World Food in 2024: Record Trade Values, Plateauing Production Volumes” (January 2026 · $1.97T FAOSTAT · bilateral flows · top exporters · China GPV 33.2%)












