
The Foods That
Feed the World
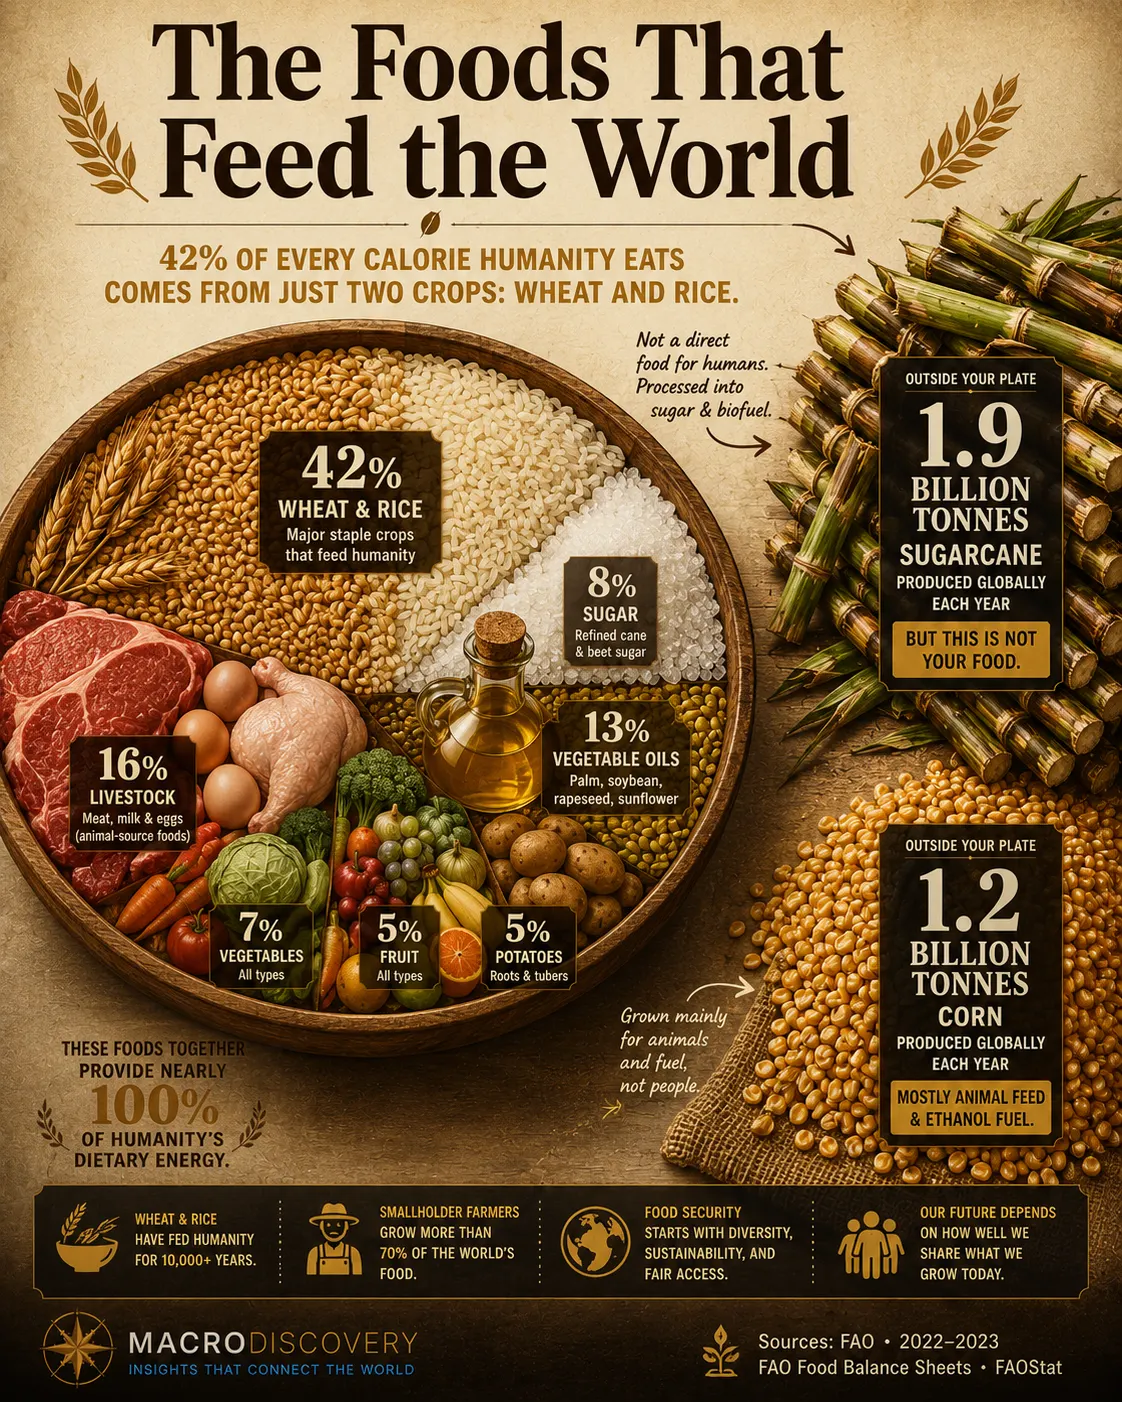
Cereals supply 42% of every calorie humanity eats. The world’s most produced crop by weight is sugarcane — but humans barely eat it. In 2023, for the first time in history, global food supply crossed 3,000 calories per person per day. Here is what actually reaches our plates, and where it comes from.
Every year humanity produces 9.6 billion tonnes of crops. But most of it never reaches a human mouth. Vast quantities become animal feed, biofuel, industrial raw material, or are lost to waste before they ever reach a kitchen. The gap between what the world grows and what the world actually eats is one of the most important and least understood facts in global food security. This article maps what humanity genuinely consumes — by food group, by caloric weight, and by the share that makes it to the plate.
- Cereals are the foundation of human nutrition — supplying 42% of all dietary energy and 36% of all protein globally in 2023. Wheat and rice together account for 82% of cereal food supply. Everything else is built on top of these two grains.
- The most-produced crop by weight is sugarcane at 1.9 billion tonnes — but humans do not eat cane. After processing, it becomes ~180 million tonnes of refined sugar. The world’s largest crop by weight has already lost 90% of itself before it reaches a consumer.
- Maize is produced in larger volume than wheat or rice (almost 1.2 billion tonnes in 2022) — but only about 11% of global cereal food supply comes from maize eaten directly. The rest goes to animal feed, ethanol, starch, and industrial uses.
- Livestock products — meat, eggs, and milk — supply 36% of global protein from just 16% of dietary energy. Animal foods are protein-dense but calorie-light compared to cereals.
- In 2023, 45% of all vegetable oils were used for non-food purposes — primarily biofuel — up from much lower levels a decade ago. The food system is increasingly competing with the energy system for the same crops.
| Food Group | Production 2022 | Goes to Human Food | Share of DES | Key Item(s) | DES bar |
|---|---|---|---|---|---|
Cerealswheat · rice · maize · barley |
3.06 billion tlargest crop group by weight |
45% as food 35% = animal feed |
42% of calories 36% of protein |
Wheat: 42% of cereal calories · Rice: 40% · Maize: 11% (mostly non-food use) | |
Sugar cropscane · beet → refined sugar |
2.2 billion tcane 1.9Bt · beet 260Mt |
Processed Raw cane is not eaten; becomes refined sugar (~8-10% of cane weight) |
~8% of calories |
Refined sugar is the consumed product — a fraction of cane weight. Americas use more cane for biofuel (26% non-food). | |
Vegetablestomatoes · onions · cabbage · more |
1.2 billion t |
88% as food |
—Low calorie density; high micronutrient value |
Tomatoes are the world’s most produced individual vegetable. Overwhelmingly eaten directly. | |
Oil cropspalm · soy · rapeseed · sunflower |
1.1 billion tpalm 425Mt · soy 349Mt |
42% as food 45% non-food (biofuel, industry) |
13% of calories |
Vegetable oil is the food product. Non-food use surged with biofuel mandates — nearly half the crop never becomes food. | |
Fruitbananas · apples · citrus · grapes |
0.9 billion t |
83% as food |
—Important micronutrients; modest caloric share |
High direct food share. Losses mainly from logistics — fruit is perishable and bruises easily in transit. | |
Roots & tuberspotatoes · cassava · yams |
0.9 billion tpotato 375Mt · cassava 330Mt |
Majority as food |
—Critical calorie base in Africa, Asia, Latin America |
Cassava is the primary caloric staple for hundreds of millions in sub-Saharan Africa but barely appears in Western diets. | |
Milkcattle · buffalo · goat · sheep |
~930 million t2022 · all species |
Majority as food(some → butter, powder, cheese) |
16% of DES 36% of protein(combined: meat + eggs + milk) |
Liquid food is heavy. India produces 23% of world milk. Asia’s share grew 142% between 2000 and 2021. | |
Meatpoultry · pork · beef · other |
341 million tpig 120Mt · beef 69Mt · buffalo 10Mt |
~All as food |
21% of proteinPoultry 41% · Pork 31% · Beef 21% of meat protein |
China produces 45% of world pork. Asia accounts for 43% of global meat production. Poultry surpassed all other meats. | |
Eggshen eggs (93% of total) |
87 million then eggs · 2022 · +70% since 2000 |
~All as food |
Part of 16% DES livestock total |
Asia produces 63% of world eggs. One of the fastest-growing food categories globally — egg production doubled in 22 years. | |
Pulseslentils · chickpeas · beans · peas |
~90 million t(approx) |
76% as food 24% = animal feed |
—Dense protein; critical in vegetarian diets |
Affordable, protein-rich, low environmental footprint. A key protein source across South Asia, East Africa, and the Middle East. |
Sources: FAO Food Balance Sheets 2010–2023 (October 2025) · FAO Food Balance Sheets 2010–2022 (July 2024) · FAOSTAT Analytical Brief 79: Agricultural Production Statistics 2000–2022 (FAO, 2023) · FAO Statistical Yearbook 2023 · UK Government Food Security Report 2024, Theme 1 (citing FAOSTAT 2024). Production figures: 2022. DES and utilization ratios: 2023. Fish and seafood are not included in this table — FAO Fisheries statistics and Food Balance Sheets use different compilation methodologies and cannot be directly compared here.
The Number That Matters Is Not Production — It’s Food Use
The world’s most-produced crop by weight is sugarcane: 1.9 billion tonnes in 2022. But nobody eats sugarcane. It is fed into mills, crushed, boiled, and crystallised into refined sugar — and roughly 90% of the cane’s original weight disappears in that process. The food that reaches your kitchen is a small fraction of the agricultural effort that produced it.
This gap between production and food use runs through almost every category. Maize is the world’s most produced cereal at almost 1.2 billion tonnes — yet only 11% of the global cereal food supply comes from maize eaten directly. The rest is fed to pigs, cattle, and chickens; turned into ethanol in the US and Brazil; or processed into corn starch, high-fructose corn syrup, and industrial inputs. Wheat and rice, which together produce far less than maize by weight, feed far more people directly. Understanding why requires looking at what actually happens to each crop after harvest — not just how much is grown.
Cereals: The Foundation of Every Diet on Earth
Two crops — wheat and rice — supply 82% of all cereal calories consumed by humans globally. Wheat dominates in Europe, the Middle East, North Africa, South Asia, and the Americas. Rice dominates in East, Southeast, and South Asia. Between them, they are the primary caloric staple of every major civilisation on earth. Together they contribute roughly 34% of all human dietary energy — more than any other pair of foods in history.
Of the 3.06 billion tonnes of cereals produced in 2022, only 45% went directly to human food. About 35% became animal feed — grain that was converted, at significant efficiency loss, into the meat, milk, and eggs that appear later in the food chain. This is why the food system’s environmental footprint is so much larger than it appears from the human food supply alone: for every calorie of beef on your plate, many more grain calories were consumed to produce it.
Wheat and rice are exported heavily — cereals represent the world’s most traded food commodity by quantity, according to the FAO Statistical Yearbook 2023, with the Americas and Europe as the largest exporters and Asia as the largest importer. A bad harvest in any major wheat-producing country sends price signals around the world within days.
Meat, Milk, and Eggs: The Animal Foods Reshaping the Planet
The world produced 341 million tonnes of meat in 2022 — almost all of which went directly to human consumption. Poultry has overtaken every other meat type, now accounting for 41% of global meat protein supply. Pork comes second at 31%, bovine meat third at 21%. China alone produces 45% of the world’s pork — a single country feeding nearly half of the planet’s most consumed meat type. Asia as a whole accounts for 43% of all global meat production.
Milk tells a different story of scale. Global milk production reached approximately 930 million tonnes in 2022 — the largest food volume of any single animal product. India is the world’s largest milk producer at 23% of the global total, having grown its output by 142% between 2000 and 2021. Much of Asia’s milk is consumed domestically — virtually none of India’s or Pakistan’s milk enters export markets — which makes Asian dairy largely invisible in global commodity trade statistics despite its enormous volume.
Eggs are the quiet success story of the global food system. Hen egg production reached 87 million tonnes in 2022 — 70% higher than in 2000 — driven almost entirely by Asia, which accounts for 63% of global production. Eggs are produced and consumed locally, require relatively little land or water compared to meat, and deliver high-quality protein at low cost. Their growth curve has been faster and steadier than almost any other protein source.
The Crops That Disappear Before You Eat Them
Two categories in the food supply have seen dramatic shifts in how much of their production actually reaches human mouths. The first is vegetable oils. In 2023, 45% of all vegetable oils were used for non-food purposes — primarily biofuel — up from a much smaller share a decade earlier. The same palm oil that fries food in Asian kitchens now competes with biodiesel mandates in Indonesia and Malaysia. The same soybean oil that goes into food processing in the US is also refined into renewable diesel. The food system and the energy system are drawing from the same field.
The second is sugar crops. In the Americas, 26% of sugar crop production goes to non-food uses — primarily ethanol. Brazil runs a large portion of its vehicle fleet on sugarcane ethanol; the US converts billions of bushels of maize into corn ethanol. The result is that some of the most energy-dense agricultural products humans have ever grown are now diverted away from food before they ever reach a plate.
Pulses — lentils, chickpeas, beans, and peas — show the opposite pattern. They are protein-dense, relatively affordable, have a low environmental footprint, and 76% of all pulses go directly to human food. In South Asia, East Africa, and the Middle East, pulses are a nutritional cornerstone. They are also one of the few protein sources whose caloric efficiency is comparable to cereals. As the world’s population grows and pressure on livestock production increases, pulses are likely to play a larger role in feeding humanity.
How Asia Feeds the World — and Itself
Asia is the dominant force in global food production across almost every category. It produces the majority of the world’s rice, half of all vegetables, 63% of all eggs, 44% of all milk, and 43% of all meat. China alone produces 25% of the world’s rice, 25% of the world’s potatoes, and 45% of the world’s pork. India produces 23% of the world’s milk. These are not export volumes — they are almost entirely consumed domestically. Asia feeds itself, largely independently of global commodity markets.
The structural consequence is that global food trade statistics understate the true scale of Asian food production. When analysts track wheat prices, corn futures, or soybean shipments, they are watching markets that are genuinely global. When they track rice, pork, eggs, or fresh vegetables, they are watching markets that are predominantly regional — where Chinese or Indian domestic supply-demand dynamics matter far more than anything happening in Chicago or Rotterdam. The foods that actually feed the most people are often the least visible in international trade data.
- FAO — “Food Balance Sheets 2010–2023” (October 2025 · DES milestone 3,000 kcal/day · cereals 42% DES · utilization ratios 2023)
- FAO — “Food Balance Sheets 2010–2022: Global, Regional and Country Trends” (July 2024 · meat protein breakdown · poultry 41%)
- FAOSTAT Analytical Brief 79: “Agricultural Production Statistics 2000–2022” (FAO, 2023 · production volumes by group · sugarcane 1.9Bt · potatoes 375Mt · cassava 330Mt · eggs 87Mt · oil palm 425Mt · soy 349Mt)
- FAO Statistical Yearbook 2023 (China milk/rice/potato shares · India milk 23% · Asia milk growth 142% · pig meat 120Mt · beef 69Mt · buffalo 10Mt)
- UK Government Food Security Report 2024, Theme 1: Global Food Availability (citing FAOSTAT 2024 · total meat 341Mt · global milk 930Mt · cereals 3.06Bt)
- FAO Food Balance Sheets 2010–2021 (FAO Knowledge Repository · wheat 42% / rice 40% / maize 11% of cereal food supply shares)












