
Where the World’s Oil
Comes From — and Where It Goes
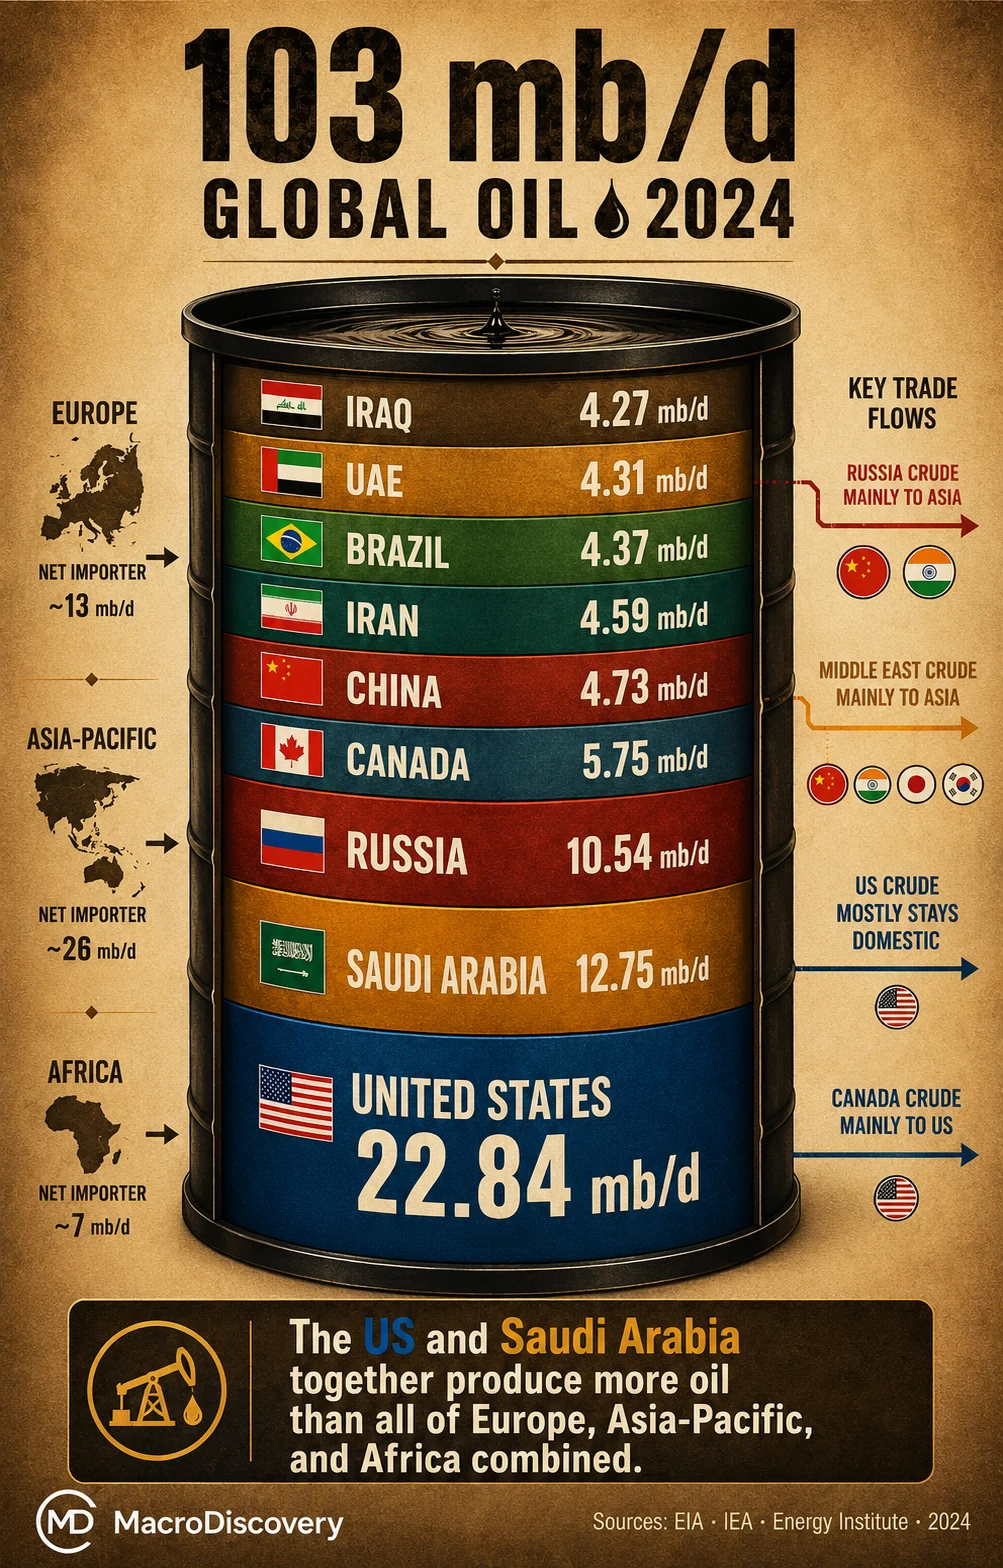
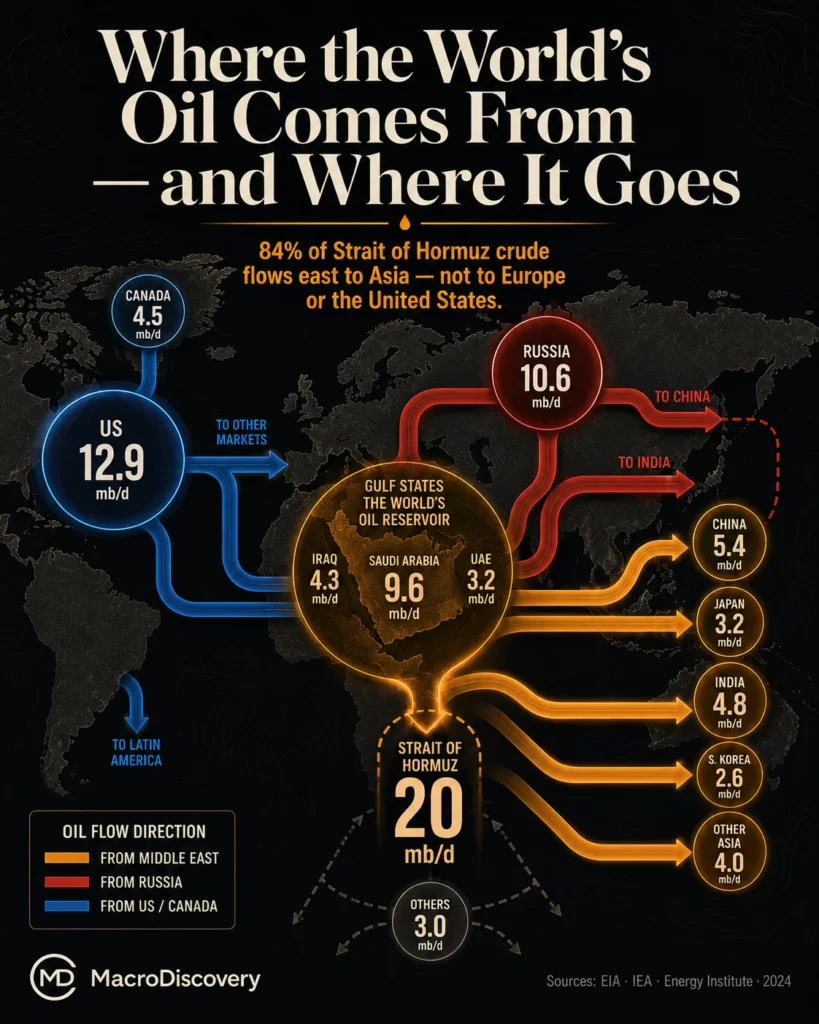
The US produces more oil than any country in recorded history. Asia consumes most of what the Middle East exports. One 21-mile strait carries one-fifth of everything the world burns. And the geography of who needs oil from whom is reshaping every major alliance on earth.
Oil is the circulatory system of the global economy. Every day, roughly 103 million barrels move from fields to refineries to fuel tanks across every continent. Three countries — the US, Saudi Arabia, and Russia — produce more than a third of it. Three countries — the US, China, and India — consume more than a third of it. The flows between those two groups, and the chokepoints they pass through, are among the most consequential facts in world affairs.
- The US is simultaneously the world’s largest oil producer and its largest consumer — the only major economy with that distinction. It produced 22.84 mb/d in 2024 while consuming roughly 20 mb/d.
- China imports 11.1 mb/d of crude oil — more than any other country — with Russia, Saudi Arabia, and Iraq as its top three suppliers. Over a third of China’s imports come from countries under Western sanctions.
- India overtook China as the top source of oil consumption growth in 2024 and 2025, according to the EIA. India’s consumption has grown 3.8% per year on average for a decade and shows no sign of slowing.
- The Middle East sends 13.2 mb/d to Asia — and barely any to Europe or North America. The global oil map has shifted east.
- The Strait of Hormuz carries 20 mb/d — about 25% of all seaborne oil trade — through a passage 21 nautical miles wide at its narrowest. There is no viable alternative route.
| # | Country | mb/d |
|---|---|---|
| 1 | 🇺🇸USA |
22.847th yr in a row |
| 2 | 🇸🇦Saudi Arabia |
10.88OPEC+ cuts applied |
| 3 | 🇷🇺Russia |
10.53OPEC+ cuts applied |
| 4 | 🇨🇦Canada |
6.00 |
| 5 | 🇨🇳China |
5.33 |
| 6 | 🇮🇷Iran |
4.62Under sanctions |
| 7 | 🇧🇷Brazil |
4.28 |
| 8 | 🇦🇪UAE |
4.25 |
| 9 | 🇮🇶Iraq |
4.60 |
| # | Country | mb/d |
|---|---|---|
| 1 | 🇺🇸USA |
~20.0Also #1 producer |
| 2 | 🇨🇳China |
16.4Imports 11.1 mb/d |
| 3 | 🇮🇳India |
5.6Fastest growing |
| 4 | 🇷🇺Russia |
3.79 |
| 5 | 🇸🇦Saudi Arabia |
3.63 |
| 6 | 🇯🇵Japan |
3.14-42% since 2000 |
| 7 | 🇧🇷Brazil |
3.27 |
| 8 | 🇰🇷S. Korea |
2.51 |
| 9 | 🇩🇪Germany |
2.06-26% since 2000 |
Sources: Production — EIA International Energy Statistics (total petroleum and other liquids) via INN (March 2026) · EIA STEO February 2025 (Canada, Saudi Arabia crude figures) · Consumption — Energy Institute Statistical Review of World Energy 2024 via Statbase / Visual Capitalist.
Sources: Visual Capitalist / Energy Institute (global trade flows) · EIA primary article on China crude oil imports (February 2025) · EIA / IEA data on Hormuz destinations and Japan Middle East dependency.
America Produces More Oil Than Any Country in History
The US shale revolution — centred on the Permian Basin in Texas and New Mexico — transformed American geopolitics. In 2005, the US was importing over 10 mb/d of crude. By 2024, it was producing 22.84 mb/d of total petroleum liquids — more than any country has ever produced — while remaining the world’s largest consumer at roughly 20 mb/d. The US is simultaneously the world’s largest oil producer and its largest oil consumer. No other major economy comes close to that combination.
The consequence is that the US imports 6.6 mb/d — but about 62% of that comes from Canada, and only about 0.5 mb/d comes from the Persian Gulf. The US is less exposed to a Middle East supply shock than at any point in 40 years. Its Asian allies are not. Japan gets 77% of its oil consumption from the Middle East. South Korea and Taiwan are similarly exposed. The strategic geometry of oil — and of any conflict near the Strait of Hormuz — is an Asia problem far more than an American one, even though the US has historically guaranteed the security of those shipping lanes.
China Imports More Oil Than Any Country on Earth — Mostly From Sanctioned Nations
China consumed 16.4 mb/d in 2024 but produced only 4.3 mb/d of crude domestically. The gap — 11.1 mb/d of crude imports — makes China the world’s largest oil importer by a wide margin. Its largest supplier is Russia, at 2.2 mb/d. Saudi Arabia comes second at 1.6 mb/d, followed by Iraq, Oman, and Malaysia. Altogether, Russia, Iran, and Venezuela supply about a third of China’s crude import mix — all three under Western sanctions, all three offering discounted prices, all three with few other buyers.
This is not accidental. After Russia’s 2022 invasion of Ukraine, G7 countries imposed price caps on Russian oil. Russia turned east. China and India absorbed the redirected barrels at steep discounts. The result is a bifurcated global oil market — one priced in dollars and flowing to OECD countries, and one flowing at a discount to the non-Western world. The geography of who buys Russian oil has become one of the sharpest dividing lines in global geopolitics.
India Is Now the Fastest-Growing Oil Market on Earth
For most of this century, China was the engine of global oil demand growth. That has changed. In 2024 and 2025, India overtook China as the top source of growth in global oil consumption, according to the EIA. India’s consumption has grown 3.8% per year on average over the past decade and reached 5.6 mb/d in 2024 — driven by expanding vehicle fleets, air travel, and cooking fuel demand. India accounts for roughly 25% of total global oil consumption growth in 2024–2025.
China’s growth has slowed partly because of electric vehicle adoption — China installs more EVs than the rest of the world combined — and partly because of a structural shift away from diesel-heavy industrial activity. Japan, meanwhile, has moved in the opposite direction from India: its oil consumption is down 42% since 2000, as an ageing and shrinking population drives fewer cars and uses less energy. Germany is down 26%. Western Europe as a whole is on a long-run decline in oil demand.
OPEC+ Cut Production in 2024 — but the Rest of the World Did Not
Saudi Arabia and Russia voluntarily reduced production throughout 2024 in an attempt to keep oil prices from falling. Saudi Arabia produced 9.0 mb/d of crude — down 13% from its 2022 level. Russia’s crude output fell 3%. Kuwait, Algeria, and the UAE also cut. But the global supply picture was shaped more by what happened outside OPEC+. The US grew its crude production by 4% to 13.2 mb/d. Canada grew by 4%. Brazil grew. Iran — exempt from OPEC+ agreements due to sanctions — grew by 12%, recovering volume lost during the years of maximum Western pressure.
The structural shift is clear: the Americas are increasingly dominating non-OPEC oil supply growth while the Middle East manages production to support prices. The Permian Basin, the Alberta oil sands, and Brazil’s pre-salt offshore fields are the new growth engines of global supply. Venezuela tells the opposite story — it produced 3.2 mb/d in 2000 and only 0.89 mb/d in 2024, a 72% decline driven entirely by political collapse, not geological depletion.
- EIA — “Petroleum liquids supply growth driven by non-OPEC+ countries” (February 2025 · primary production data: Canada 6.0 mb/d, Saudi Arabia crude 9.0 mb/d, Russia crude 9.2 mb/d)
- EIA — “China’s crude oil imports decreased from a record” (February 2025 · China imports 11.1 mb/d, Russia 2.2 mb/d, Saudi 1.6 mb/d)
- EIA — “India to surpass China as top source of global oil consumption growth in 2024 and 2025” (primary)
- EIA — “Amid regional conflict, the Strait of Hormuz remains critical oil chokepoint” (June 2025 · 20 mb/d, 20% of global consumption, Saudi 38%)
- IEA — Strait of Hormuz factsheet (2025 · 20 mb/d, 25% seaborne trade, 84% to Asia, LNG flows)
- Investing News Network — “Top Oil-Producing Countries” (March 2026 · citing EIA · US 22.84 mb/d, global 103.32 mb/d)
- Visual Capitalist — “Visualizing Global Oil Trade Flows by Country” (2024 data, Energy Institute · China 11.1 mb/d imports, US 6.6 mb/d, Canada 62%)
- Visual Capitalist — “Oil Trade Through the Strait of Hormuz by Country” (Gulf→China 5.1 mb/d, Gulf→Japan+Korea 4.2 mb/d, Japan 77%)
- Statbase — Oil consumption by country 2024 (Energy Institute data · full country table)












