The Global Wealth Gap , How Inequality Has Changed Over 50 Years , global wealth inequality statistics , UBS wealth report Piketty data , how unequal is global wealth distribution , is global inequality getting better or worse ,
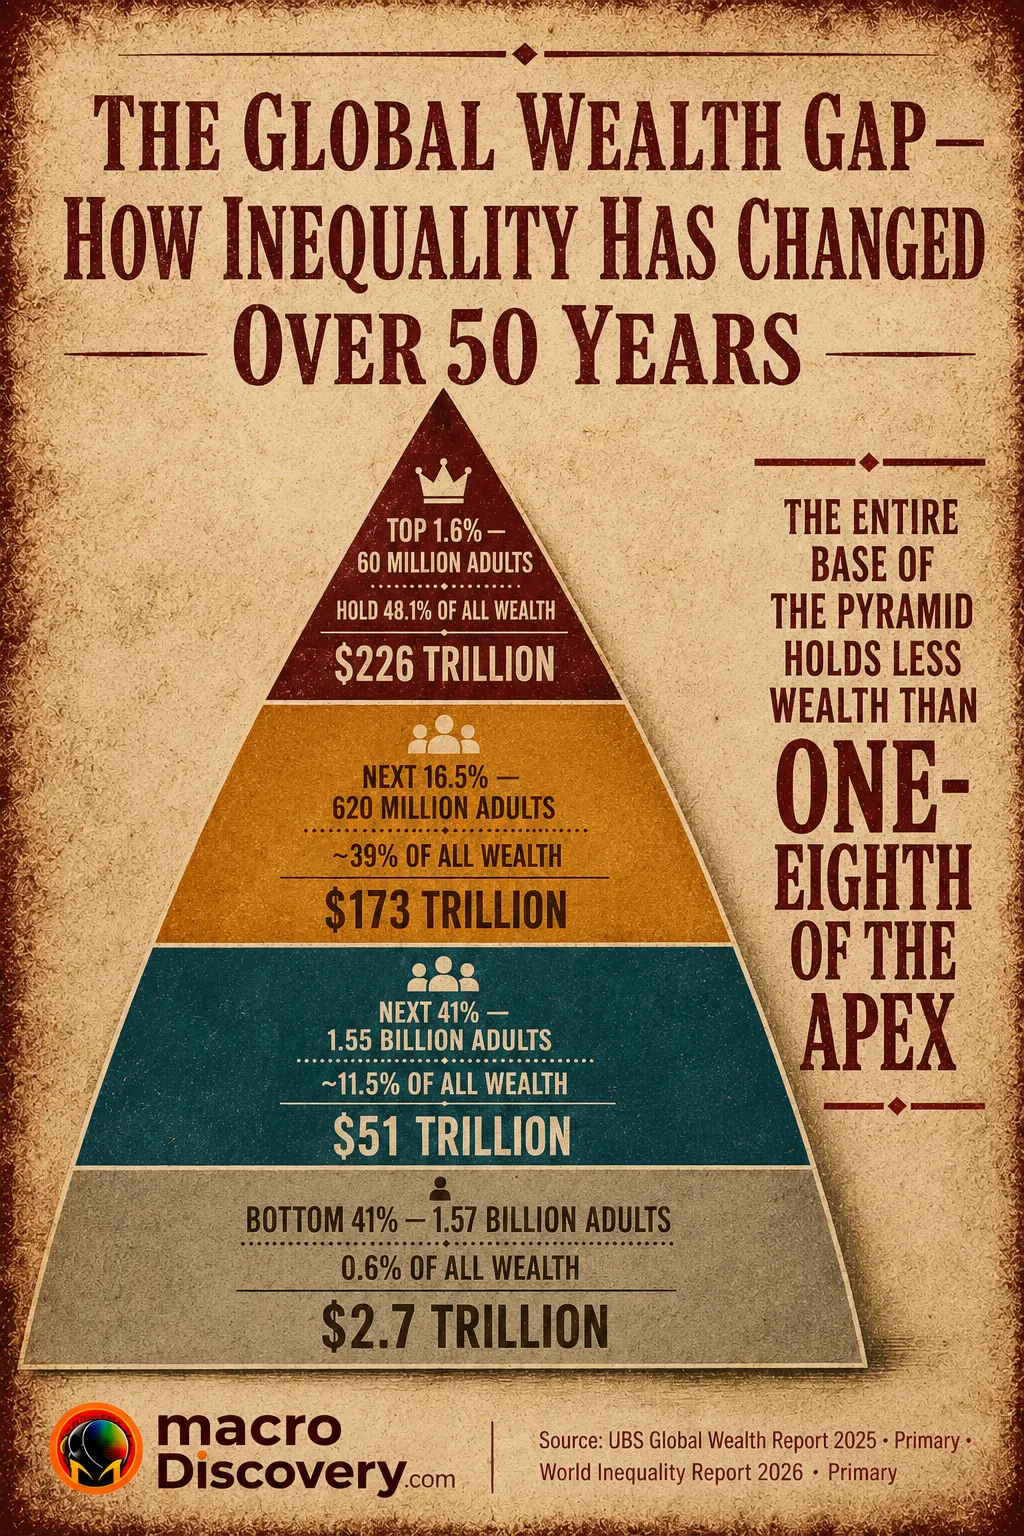
The Global Wealth Gap —
How Inequality Has Changed Over 50 Years
Fewer than 60,000 people — the world’s top 0.001% — now own three times more wealth than the entire bottom half of humanity combined. The standard measure of inequality, the Gini coefficient, says things are getting more equal. But that is because China and India’s growth has closed the gap between countries — not within them. Inside almost every country, the top 1% now holds more wealth than the bottom 90%. Economist Thomas Piketty of the Paris School of Economics has spent 40 years explaining why this is not an accident.
| Wealth tier | Number of adults | % of adults | Wealth held | % of total | Tier |
|---|---|---|---|---|---|
| 🌟 Over $1 million | ~60 million | 1.6% | ~$226 trillion | 48.1% of world wealth | |
| 💰 $100K – $1M | ~620 million | 16.5% | ~$173 trillion | ~39% of world wealth | |
| 💲 $10K – $100K | ~1.55 billion | 41.3% | ~$51 trillion | ~11.5% of world wealth | |
| 💵 Under $10,000 | ~1.57 billion | 41%+ | ~$2.7 trillion | 0.6% of world wealth |
Source: UBS Global Wealth Report 2025 (primary · directly fetched · June 18, 2025 · ubs.com · formerly Credit Suisse Global Wealth Report, same methodology, continuous series since 2010). Tier boundaries and wealth shares from global wealth pyramid. Analysis of 2024 data (reporting year). Individual tier figures from Michael Roberts analysis (July 2025) of UBS 2025 pyramid data. Bar lengths proportional to wealth share.
What the UBS Wealth Pyramid Actually Shows
The headline number from the UBS Global Wealth Report 2025 (primary) is that global wealth rose 4.6% in 2024 — but the distribution of that growth was radically uneven. The Americas accounted for more than 11% growth; Europe, the Middle East and Africa grew less than 0.5%. More than half of the 56 markets analysed saw wealth per adult decline in real terms. At the apex of the pyramid, the number of dollar billionaires grew to 2,891 — including 31 individuals with fortunes exceeding $50 billion each. The number of billionaires’ children grew from 4,136 in 2015 to 6,441 in 2024. The United States and mainland China together account for more than 50% of all personal wealth in the world — the US alone holds approximately 35%, China approximately 20% — leaving 54 other countries sharing the remaining 46%.
Why it matters: global wealth is rising — but the growth is concentrating in fewer hands and fewer countries simultaneously.
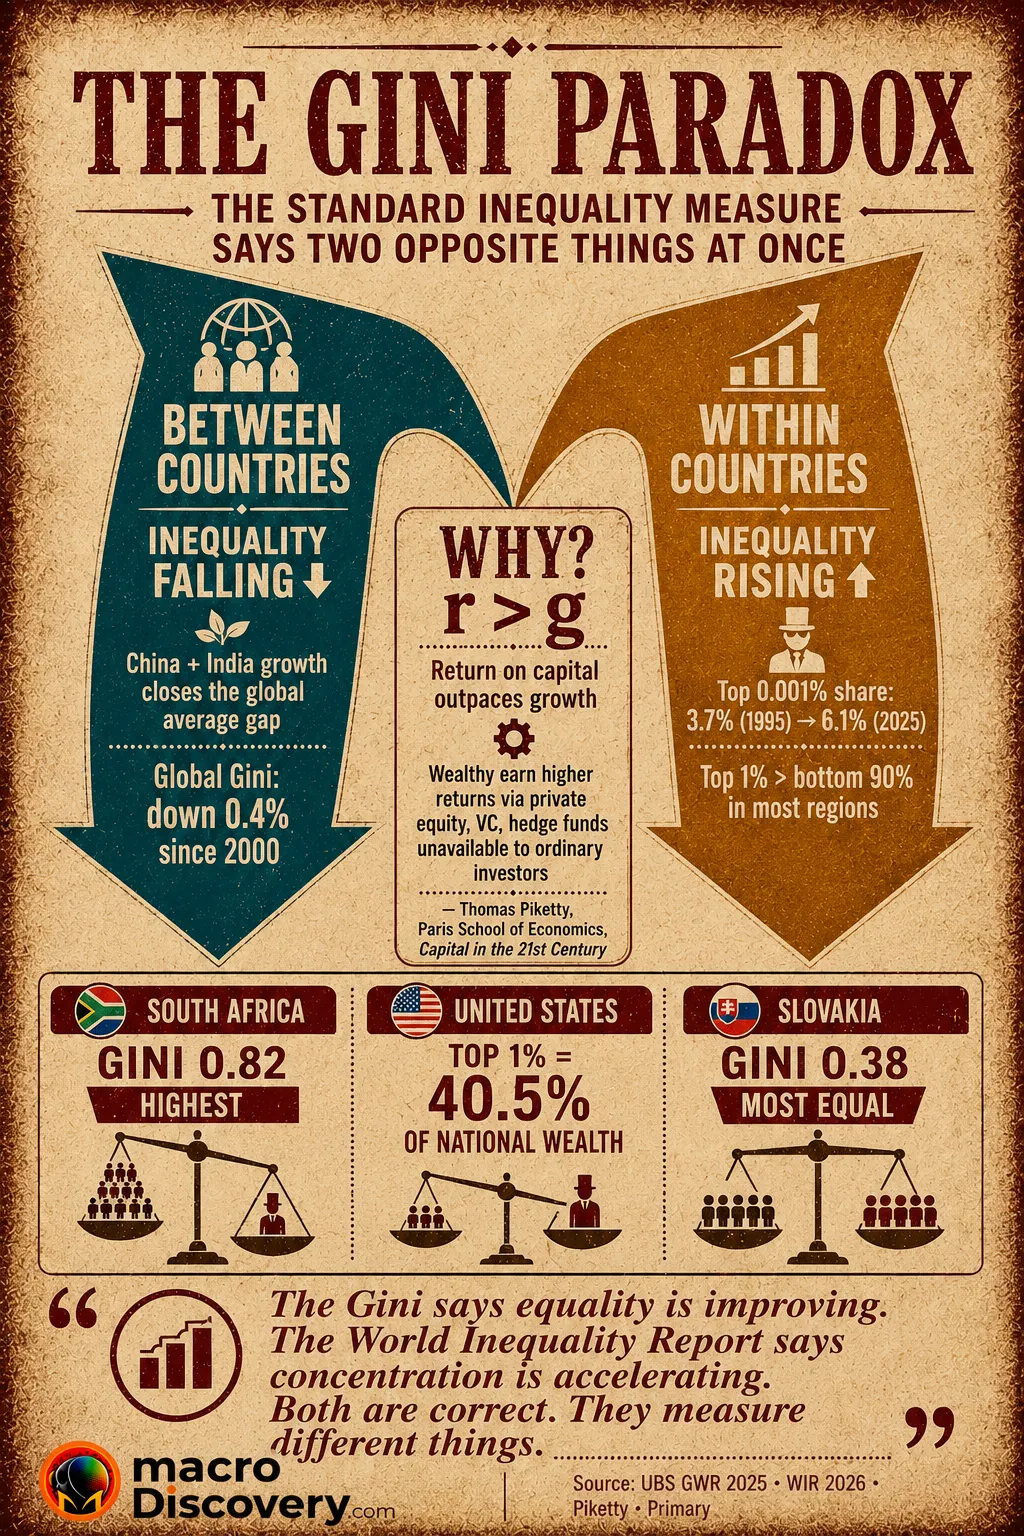
The Gini Paradox: Why the Standard Measure Says One Thing and the Data Says Another
The Gini coefficient — the most widely used measure of inequality, ranging from 0 (perfect equality) to 1 (perfect concentration) — shows global inequality declining. The UBS report notes inequality has “diminished marginally since the turn of the millennium, by 0.4 percent”. The World Bank finds the same: global inequality fell in the 2000s for the first time since the Industrial Revolution. The explanation is China and India — two countries that grew fast enough to lift their average income toward the global mean, reducing between-country inequality. But the Gini is mathematically more sensitive to the middle of the distribution than the extremes. It misses what is happening at the very top. The top 0.001%’s share of global wealth has risen every year since 1995 — from 3.7% to 6.1% (World Inequality Report 2026, primary). Within almost every region, the top 1% now holds more wealth than the bottom 90% combined.
Why it matters: the Gini headline and the wealth concentration reality are both true simultaneously — which is why which metric you use determines which story you tell.
Piketty’s r > g: The Mechanism the Data Keeps Confirming
Thomas Piketty, professor at the Paris School of Economics and co-editor of the World Inequality Report 2026, published Capital in the Twenty-First Century in French in 2013 (English translation, Belknap/Harvard, April 2014). Its central argument: when the return on capital (r) exceeds the rate of economic growth (g), wealth concentrates over time. The wealthy accumulate faster than the economy grows — and faster than wages rise. Piketty documents that the mid-20th century period of relatively lower inequality (1930–1975) was an aberration caused by wars, the Great Depression, and deliberate policy: progressive taxation, capital destruction, and debt. Since 1980, r has again exceeded g globally, and concentration has followed. His collaborator Gabriel Zucman has shown that the wealthiest earn higher returns than others — accessing private equity, venture capital, and hedge funds unavailable to ordinary investors — compounding the divergence.
South Africa: 0.82 — the world’s highest Gini in the UBS sample. Post-apartheid South Africa has seen its wealth Gini worsen since 2008. The legacy of historical dispossession means wealth remains concentrated among a small population segment regardless of income policies.
Brazil: 0.79 — historically one of the most unequal countries in the world, where the top 1% regularly capture more than half of total income growth.
Russia: 0.75+ — among the highest in the sample. A small group of oligarchs controls assets comparable to the wealth of the entire Russian middle class.
United States: high relative to peers — the top 1% holds 40.5% of US national wealth (OECD), by far the highest share of any high-income OECD country. North America average wealth per adult: $593,347 — nearly 6× China, 12× Eastern Europe, 20× Latin America.
Slovakia: 0.38 — the most equal country in the UBS sample, among the lowest Gini coefficients in Europe.
Nordic countries: cluster around Gini 0.27–0.30 — achieved through strong wealth taxation, inheritance limits, and compressed wage structures.
Sources: UBS Global Wealth Report 2025 (primary) · inequality.org citing OECD · Michael Roberts analysis of UBS 2025.
Why it matters: the countries with the lowest wealth inequality did not get there by accident — they built specific institutional structures over decades specifically designed to compress the distribution.
Is Wealth Inequality Getting Worse — or Just Redistributing?
The honest answer is: both. Between countries, convergence is real: China and India’s growth has raised hundreds of millions out of poverty and narrowed the average gap between rich and poor nations. The proportion of adults with less than $10,000 in wealth has nearly halved since 2000 (UBS 2025, primary). But within countries — particularly the US, UK, and across the developing world — concentration at the extreme top has grown continuously. The World Inequality Report 2026 co-edited by Piketty frames it directly: “inequality persists at a very extreme level.” The dynastification of wealth is accelerating: billionaires’ children grew from 4,136 to 6,441 between 2015 and 2024; multi-generational billionaires from 582 to 805. Inherited wealth — the phenomenon Piketty called “patrimonial capitalism” — is not a 19th-century relic. It is the trajectory of 21st-century wealth distribution.
Why it matters: the global wealth story is not one trend but two running simultaneously — convergence between countries and concentration within them.
- The top 1.6% of adults (60 million people) hold 48.1% of all global personal wealth; the bottom 41% (1.57 billion adults) hold just 0.6% (UBS Global Wealth Report 2025, primary).
- Fewer than 60,000 people own three times more wealth than the entire bottom half of humanity combined — and their share has risen from 3.7% in 1995 to 6.1% in 2025 (World Inequality Report 2026, primary).
- The Gini coefficient shows global inequality declining — because China and India’s growth has narrowed between-country gaps — while within-country concentration has increased almost everywhere.
- Thomas Piketty (Paris School of Economics) argues the mechanism is r > g: when returns on capital exceed economic growth, wealth concentrates over time, absent deliberate redistribution.
- The US and China together hold more than 50% of all personal wealth — the US alone holds ~35%, leaving 54 other countries sharing the remaining 46% (UBS GWR 2025, primary).
- South Africa has the world’s highest wealth Gini at 0.82; Slovakia the lowest in the UBS sample at 0.38 (UBS Global Wealth Report 2025, primary).
- Billionaires’ children grew from 4,136 to 6,441 between 2015 and 2024 — the “dynastification” of extreme wealth is accelerating (UBS Billionaire Ambitions Report).
The global wealth gap is not one story. It is two stories happening simultaneously: between nations, inequality is declining as Asia’s growth lifts average incomes toward the global mean; within nations, it is rising as returns on capital compound faster than wages. The Gini coefficient captures the first story and misses the second. Piketty’s r > g captures the second. Both are true. What the UBS and World Inequality data show, taken together, is a world getting richer at the top faster than it is getting equal anywhere else — and a wealth distribution that is increasingly inherited rather than earned.
- UBS — Global Wealth Report 2025 press release (primary · directly fetched · June 18, 2025 · 16th edition · global wealth +4.6% · Americas +11% · EMEA <0.5% · N.America avg $593,347 · millionaires +684K · 2,891 billionaires · US+China >50% of sample wealth · Gini “diminished marginally by 0.4%”)
- World Inequality Database — World Inequality Report 2026 (primary · wid.world · February 2026 · Chancel, Gómez-Carrera, Moshrif, Piketty eds. · “top 0.001% owns 3× more than bottom 50%” · “within almost every region, top 1% holds more than bottom 90%” · “inequality persists at very extreme level” · share 3.7%→6.1%)
- Michael Roberts — Analysis of UBS Global Wealth Report 2025 (July 8, 2025 · top 1.6% = 48.1% · bottom 41% = 0.6% · $2.7T vs $226T · South Africa Gini 0.82 · dynastic billionaires data · Britain wealth -3.6% · billionaires’ children 4,136→6,441)
- Inequality.org — Global Inequality Facts (citing UBS GWR 2025 + WIR 2026 · updated May 2026 · top 0.001% share 3.7%→6.1% · US top 1% = 40.5% of national wealth · US top 0.1% income: 3.4%→10% · US = 31.7% of global billionaires · CEO pay vs worker wages 2019–2025)
- Wikipedia — Capital in the Twenty-First Century (Thomas Piketty · Paris School of Economics · published French 2013 / English April 2014 · Belknap Press / Harvard · r > g thesis · 1930–1975 as exceptional period · since 1980 concentration rising)
- World Bank — Global Inequality: Implications of Piketty’s Capital (citing within/between-country divergence · “In the 2000s, global inequality fell for the first time since the Industrial Revolution, driven by a decline in the dispersion of average incomes across countries”)